Races in Royal Oak, Michigan (MI) Detailed Stats
Data:
Races - White alone (%)
Races - White alone (% change since 2000)
Races - Black alone (%)
Races - Black alone (% change since 2000)
Races - American Indian alone (%)
Races - American Indian alone (% change since 2000)
Races - Asian alone (%)
Races - Asian alone (% change since 2000)
Races - Hispanic (%)
Races - Hispanic (% change since 2000)
Races - Native Hawaiian and Other Pacific Islander alone (%)
Races - Native Hawaiian and Other Pacific Islander alone (% change since 2000)
Races - Two or more races(%)
Races - Two or more races(% change since 2000)
Races - Other race alone (%)
Races - Other race alone (% change since 2000)
Racial diversity
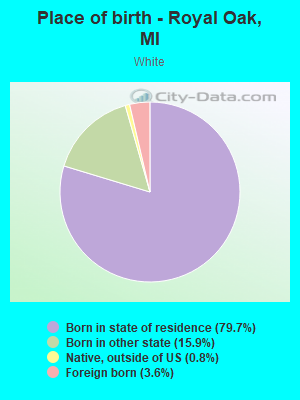
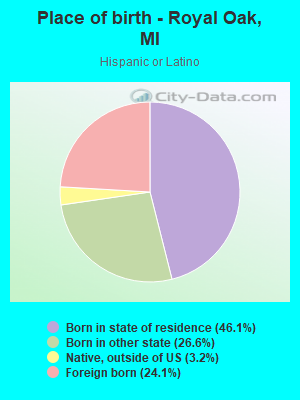
Place of birth - Born in state of residence (%)
Place of birth - Born in state of residence (%) - White
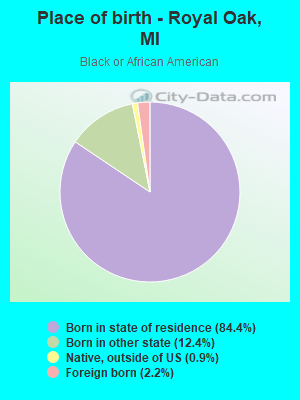
Place of birth - Born in state of residence (%) - Black or African American
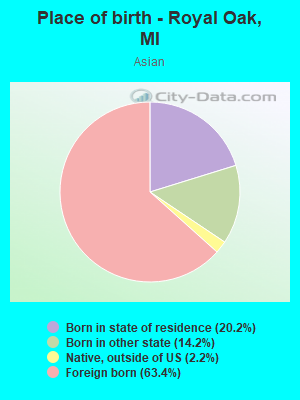
Place of birth - Born in state of residence (%) - Asian
Place of birth - Born in state of residence (%) - Hispanic or Latino
Place of birth - Born in state of residence (%) - American Indian and Alaska Native
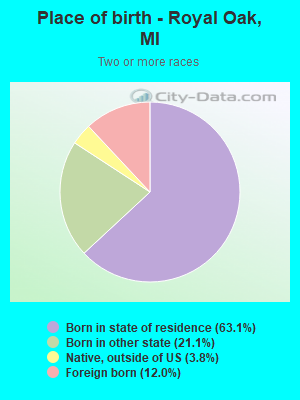
Place of birth - Born in state of residence (%) - Multirace
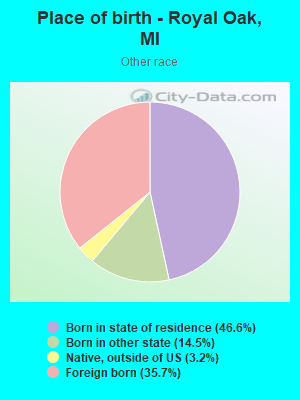
Place of birth - Born in state of residence (%) - Other Race
Place of birth - Born in other state (%)
Place of birth - Born in other state (%) - White
Place of birth - Born in other state (%) - Black or African American
Place of birth - Born in other state (%) - Asian
Place of birth - Born in other state (%) - Hispanic or Latino
Place of birth - Born in other state (%) - American Indian and Alaska Native
Place of birth - Born in other state (%) - Multirace
Place of birth - Born in other state (%) - Other Race
Place of birth - Native, outside of US (%)
Place of birth - Native, outside of US (%) - White
Place of birth - Native, outside of US (%) - Black or African American
Place of birth - Native, outside of US (%) - Asian
Place of birth - Native, outside of US (%) - Hispanic or Latino
Place of birth - Native, outside of US (%) - American Indian and Alaska Native
Place of birth - Native, outside of US (%) - Multirace
Place of birth - Native, outside of US (%) - Other Race
Place of birth - Foreign born (%)
Place of birth - Foreign born (%) - White
Place of birth - Foreign born (%) - Black or African American
Place of birth - Foreign born (%) - Asian
Place of birth - Foreign born (%) - Hispanic or Latino
Place of birth - Foreign born (%) - American Indian and Alaska Native
Place of birth - Foreign born (%) - Multirace
Place of birth - Foreign born (%) - Other Race
Residents speaking English at home (%)
Residents speaking English at home - Born in the United States (%)
Residents speaking English at home - Native, born elsewhere (%)
Residents speaking English at home - Foreign born (%)
Residents speaking Spanish at home (%)
Residents speaking Spanish at home - Born in the United States (%)
Residents speaking Spanish at home - Native, born elsewhere (%)
Residents speaking Spanish at home - Foreign born (%)
Residents speaking other language at home (%)
Residents speaking other language at home - Born in the United States (%)
Residents speaking other language at home - Native, born elsewhere (%)
Residents speaking other language at home - Foreign born (%)
Marital status - Never married (%)
Marital status - Now married (%)
Marital status - Separated (%)
Marital status - Widowed (%)
Marital status - Divorced (%)
Ancestries Reported - Arab (%)
Ancestries Reported - Czech (%)
Ancestries Reported - Danish (%)
Ancestries Reported - Dutch (%)
Ancestries Reported - English (%)
Ancestries Reported - French (%)
Ancestries Reported - French Canadian (%)
Ancestries Reported - German (%)
Ancestries Reported - Greek (%)
Ancestries Reported - Hungarian (%)
Ancestries Reported - Irish (%)
Ancestries Reported - Italian (%)
Ancestries Reported - Lithuanian (%)
Ancestries Reported - Norwegian (%)
Ancestries Reported - Polish (%)
Ancestries Reported - Portuguese (%)
Ancestries Reported - Russian (%)
Ancestries Reported - Scotch-Irish (%)
Ancestries Reported - Scottish (%)
Ancestries Reported - Slovak (%)
Ancestries Reported - Subsaharan African (%)
Ancestries Reported - Swedish (%)
Ancestries Reported - Swiss (%)
Ancestries Reported - Ukrainian (%)
Ancestries Reported - United States (%)
Ancestries Reported - Welsh (%)
Ancestries Reported - West Indian (%)
Ancestries Reported - Other (%)
Geographical mobility - Same house 1 year ago (%)
Geographical mobility - Same house 1 year ago (%) - White
Geographical mobility - Same house 1 year ago (%) - Black or African American
Geographical mobility - Same house 1 year ago (%) - Asian
Geographical mobility - Same house 1 year ago (%) - Hispanic or Latino
Geographical mobility - Same house 1 year ago (%) - American Indian and Alaska Native
Geographical mobility - Same house 1 year ago (%) - Multirace
Geographical mobility - Same house 1 year ago (%) - Other Race
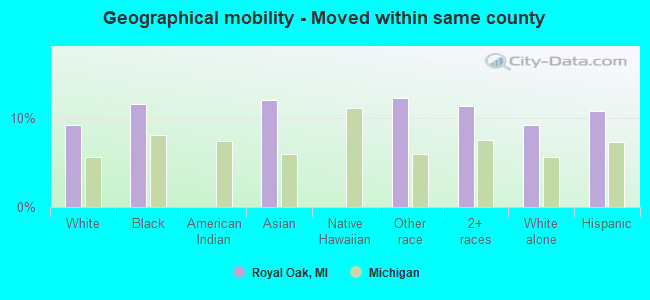
Geographical mobility - Moved within same county (%)
Geographical mobility - Moved within same county (%) - White
Geographical mobility - Moved within same county (%) - Black or African American
Geographical mobility - Moved within same county (%) - Asian
Geographical mobility - Moved within same county (%) - Hispanic or Latino
Geographical mobility - Moved within same county (%) - American Indian and Alaska Native
Geographical mobility - Moved within same county (%) - Multirace
Geographical mobility - Moved within same county (%) - Other Race
Geographical mobility - Moved from different county within same state (%)
Geographical mobility - Moved from different county within same state (%) - White
Geographical mobility - Moved from different county within same state (%) - Black or African American
Geographical mobility - Moved from different county within same state (%) - Asian
Geographical mobility - Moved from different county within same state (%) - Hispanic or Latino
Geographical mobility - Moved from different county within same state (%) - American Indian and Alaska Native
Geographical mobility - Moved from different county within same state (%) - Multirace
Geographical mobility - Moved from different county within same state (%) - Other Race
Geographical mobility - Moved from different state (%)
Geographical mobility - Moved from different state (%) - White
Geographical mobility - Moved from different state (%) - Black or African American
Geographical mobility - Moved from different state (%) - Asian
Geographical mobility - Moved from different state (%) - Hispanic or Latino
Geographical mobility - Moved from different state (%) - American Indian and Alaska Native
Geographical mobility - Moved from different state (%) - Multirace
Geographical mobility - Moved from different state (%) - Other Race
Geographical mobility - Moved from abroad (%)
Geographical mobility - Moved from abroad (%) - White
Geographical mobility - Moved from abroad (%) - Black or African American
Geographical mobility - Moved from abroad (%) - Asian
Geographical mobility - Moved from abroad (%) - Hispanic or Latino
Geographical mobility - Moved from abroad (%) - American Indian and Alaska Native
Geographical mobility - Moved from abroad (%) - Multirace
Geographical mobility - Moved from abroad (%) - Other Race
Place of birth for the foreign-born population - Ireland (%)
Place of birth for the foreign-born population - Denmark (%)
Place of birth for the foreign-born population - Norway (%)
Place of birth for the foreign-born population - Sweden (%)
Place of birth for the foreign-born population - United Kingdom (%)
Place of birth for the foreign-born population - England (%)
Place of birth for the foreign-born population - Scotland (%)
Place of birth for the foreign-born population - Other Northern Europe (%)
Place of birth for the foreign-born population - Austria (%)
Place of birth for the foreign-born population - Belgium (%)
Place of birth for the foreign-born population - France (%)
Place of birth for the foreign-born population - Germany (%)
Place of birth for the foreign-born population - Netherlands (%)
Place of birth for the foreign-born population - Switzerland (%)
Place of birth for the foreign-born population - Other Western Europe (%)
Place of birth for the foreign-born population - Greece (%)
Place of birth for the foreign-born population - Italy (%)
Place of birth for the foreign-born population - Portugal (%)
Place of birth for the foreign-born population - Spain (%)
Place of birth for the foreign-born population - Other Southern Europe (%)
Place of birth for the foreign-born population - Albania (%)
Place of birth for the foreign-born population - Belarus (%)
Place of birth for the foreign-born population - Bosnia and Herzegovina (%)
Place of birth for the foreign-born population - Bulgaria (%)
Place of birth for the foreign-born population - Croatia (%)
Place of birth for the foreign-born population - Czechoslovakia (%)
Place of birth for the foreign-born population - Hungary (%)
Place of birth for the foreign-born population - Latvia (%)
Place of birth for the foreign-born population - Lithuania (%)
Place of birth for the foreign-born population - North Macedonia (Macedonia) (%)
Place of birth for the foreign-born population - Moldova (%)
Place of birth for the foreign-born population - Poland (%)
Place of birth for the foreign-born population - Romania (%)
Place of birth for the foreign-born population - Russia (%)
Place of birth for the foreign-born population - Serbia (%)
Place of birth for the foreign-born population - Ukraine (%)
Place of birth for the foreign-born population - Other Eastern Europe (%)
Place of birth for the foreign-born population - China (%)
Place of birth for the foreign-born population - Hong Kong (%)
Place of birth for the foreign-born population - Taiwan (%)
Place of birth for the foreign-born population - Japan (%)
Place of birth for the foreign-born population - Korea (%)
Place of birth for the foreign-born population - Other Eastern Asia (%)
Place of birth for the foreign-born population - Afghanistan (%)
Place of birth for the foreign-born population - Bangladesh (%)
Place of birth for the foreign-born population - India (%)
Place of birth for the foreign-born population - Iran (%)
Place of birth for the foreign-born population - Kazakhstan (%)
Place of birth for the foreign-born population - Nepal (%)
Place of birth for the foreign-born population - Pakistan (%)
Place of birth for the foreign-born population - Sri Lanka (%)
Place of birth for the foreign-born population - Uzbekistan (%)
Place of birth for the foreign-born population - Other South Central Asia (%)
Place of birth for the foreign-born population - Burma (%)
Place of birth for the foreign-born population - Cambodia (%)
Place of birth for the foreign-born population - Indonesia (%)
Place of birth for the foreign-born population - Laos (%)
Place of birth for the foreign-born population - Malaysia (%)
Place of birth for the foreign-born population - Philippines (%)
Place of birth for the foreign-born population - Singapore (%)
Place of birth for the foreign-born population - Thailand (%)
Place of birth for the foreign-born population - Vietnam (%)
Place of birth for the foreign-born population - Other South Eastern Asia (%)
Place of birth for the foreign-born population - Armenia (%)
Place of birth for the foreign-born population - Iraq (%)
Place of birth for the foreign-born population - Israel (%)
Place of birth for the foreign-born population - Jordan (%)
Place of birth for the foreign-born population - Kuwait (%)
Place of birth for the foreign-born population - Lebanon (%)
Place of birth for the foreign-born population - Saudi Arabia (%)
Place of birth for the foreign-born population - Syria (%)
Place of birth for the foreign-born population - Turkey (%)
Place of birth for the foreign-born population - Yemen (%)
Place of birth for the foreign-born population - Other Western Asia (%)
Place of birth for the foreign-born population - Eritrea (%)
Place of birth for the foreign-born population - Ethiopia (%)
Place of birth for the foreign-born population - Kenya (%)
Place of birth for the foreign-born population - Somalia (%)
Place of birth for the foreign-born population - Uganda (%)
Place of birth for the foreign-born population - Zimbabwe (%)
Place of birth for the foreign-born population - Other Eastern Africa (%)
Place of birth for the foreign-born population - Cameroon (%)
Place of birth for the foreign-born population - Congo (%)
Place of birth for the foreign-born population - Democratic Republic of Congo (Zaire) (%)
Place of birth for the foreign-born population - Other Middle Africa (%)
Place of birth for the foreign-born population - Egypt (%)
Place of birth for the foreign-born population - Morocco (%)
Place of birth for the foreign-born population - Sudan (%)
Place of birth for the foreign-born population - Other Northern Africa (%)
Place of birth for the foreign-born population - South Africa (%)
Place of birth for the foreign-born population - Other Southern Africa (%)
Place of birth for the foreign-born population - Cabo Verde (%)
Place of birth for the foreign-born population - Ghana (%)
Place of birth for the foreign-born population - Liberia (%)
Place of birth for the foreign-born population - Nigeria (%)
Place of birth for the foreign-born population - Senegal (%)
Place of birth for the foreign-born population - Sierra Leone (%)
Place of birth for the foreign-born population - Other Western Africa (%)
Place of birth for the foreign-born population - Australia (%)
Place of birth for the foreign-born population - New Zealand (%)
Place of birth for the foreign-born population - Fiji (%)
Place of birth for the foreign-born population - Micronesia (%)
Place of birth for the foreign-born population - Bahamas (%)
Place of birth for the foreign-born population - Barbados (%)
Place of birth for the foreign-born population - Cuba (%)
Place of birth for the foreign-born population - Dominica (%)
Place of birth for the foreign-born population - Dominican Republic (%)
Place of birth for the foreign-born population - Grenada (%)
Place of birth for the foreign-born population - Haiti (%)
Place of birth for the foreign-born population - Jamaica (%)
Place of birth for the foreign-born population - St. Vincent and the Grenadines (%)
Place of birth for the foreign-born population - Trinidad and Tobago (%)
Place of birth for the foreign-born population - West Indies (%)
Place of birth for the foreign-born population - Other Caribbean (%)
Place of birth for the foreign-born population - Belize (%)
Place of birth for the foreign-born population - Costa Rica (%)
Place of birth for the foreign-born population - El Salvador (%)
Place of birth for the foreign-born population - Guatemala (%)
Place of birth for the foreign-born population - Honduras (%)
Place of birth for the foreign-born population - Mexico (%)
Place of birth for the foreign-born population - Nicaragua (%)
Place of birth for the foreign-born population - Panama (%)
Place of birth for the foreign-born population - Other Central America (%)
Place of birth for the foreign-born population - Argentina (%)
Place of birth for the foreign-born population - Bolivia (%)
Place of birth for the foreign-born population - Brazil (%)
Place of birth for the foreign-born population - Chile (%)
Place of birth for the foreign-born population - Colombia (%)
Place of birth for the foreign-born population - Ecuador (%)
Place of birth for the foreign-born population - Guyana (%)
Place of birth for the foreign-born population - Peru (%)
Place of birth for the foreign-born population - Uruguay (%)
Place of birth for the foreign-born population - Venezuela (%)
Place of birth for the foreign-born population - Other South America (%)
Place of birth for the foreign-born population - Canada (%)
Place of birth for the foreign-born population - Other Northern America (%)
Place of birth for the foreign-born population - Other (%)
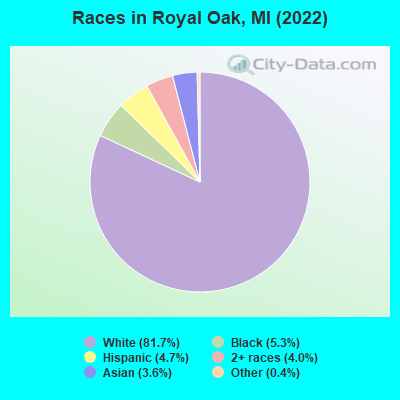
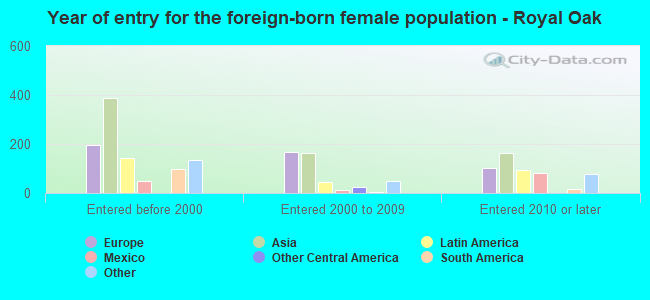
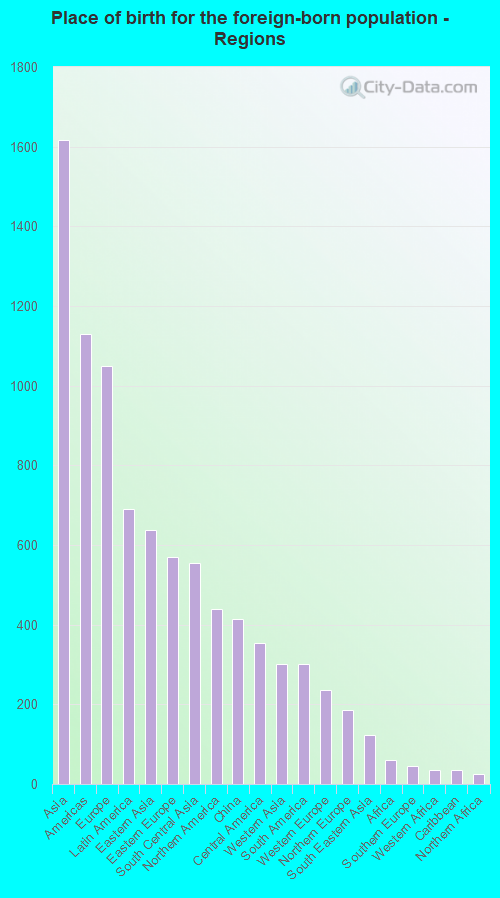
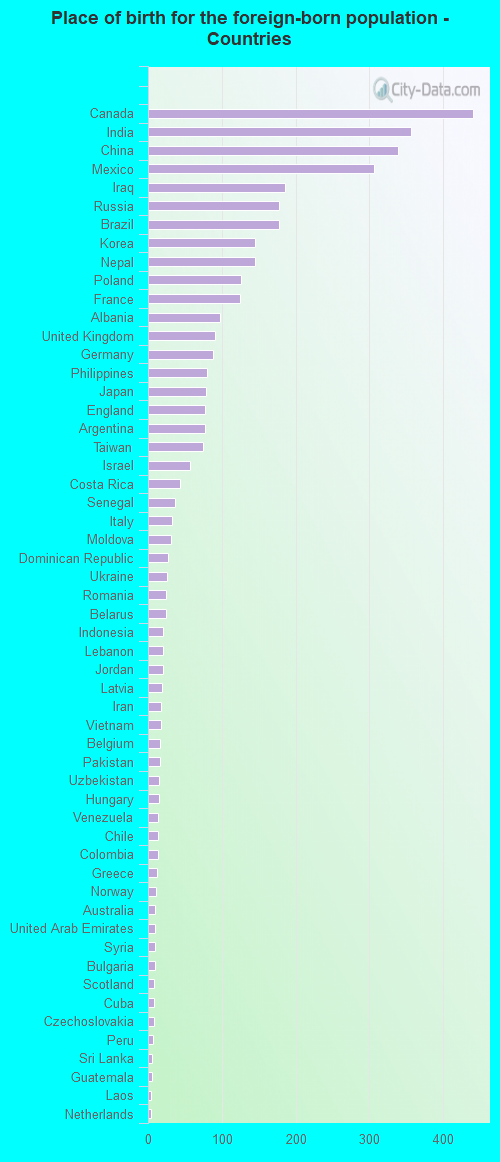
According to 2022 data, the most numerous races in Royal Oak, MI are White alone (47,308 residents), Black alone (3,068 residents), and Hispanic (2,703 residents). 92.3% of Royal Oak residents speak English at home. 6.7% of Royal Oak, MI residents are foreign-born (2.8% born in Asia, 1.8% born in Europe, 1.2% born in Latin America, 0.8% born in North America), which is 10.2% greater than the foreign-born rate of 6.0% across the entire state of Michigan.
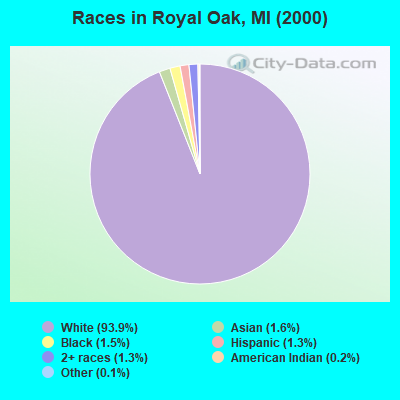
Race distribution in Royal Oak
2000 2022
7,806,691 78.6% White alone 1,402,047 14.1% Black alone 323,877 3.3% Hispanic 175,311 1.8% Asian alone 163,487 1.6% Two or more races 53,421 0.5% American Indian alone 11,465 0.1% Other race alone 2,145 0.02% Native Hawaiian and Other
7,289,051 72.6% White alone 1,310,464 13.1% Black alone 572,405 5.7% Hispanic 450,031 4.5% Two or more races 335,732 3.3% Asian alone 45,217 0.5% Other race alone 29,011 0.3% American Indian alone 2,207 0.02% Native Hawaiian and Other
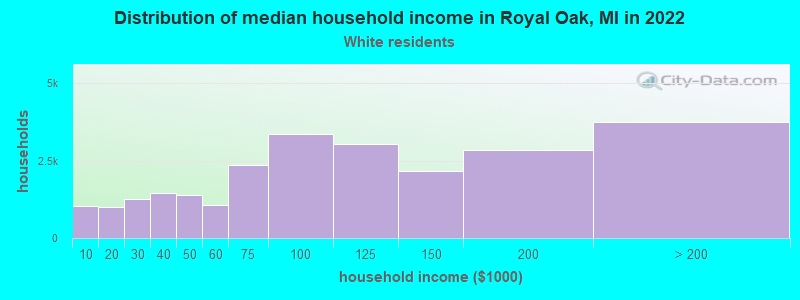
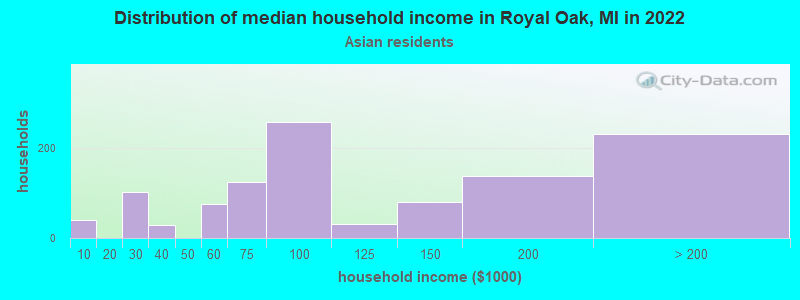
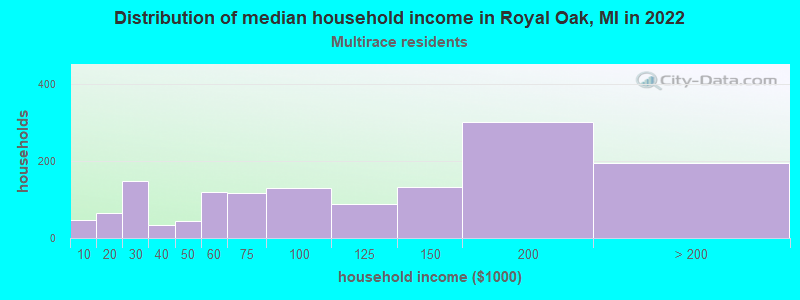
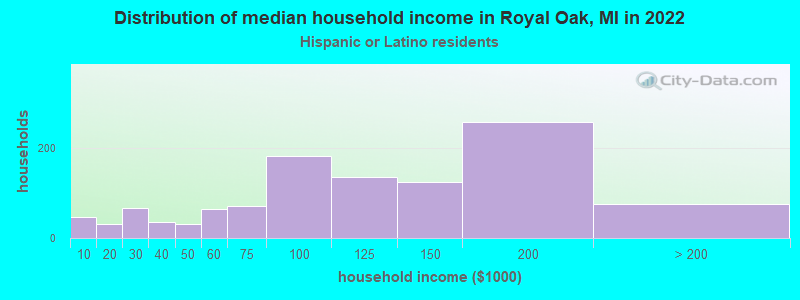
Income and house value in Royal Oak Median household income in 2022 $93,293 White non-Hispanic householders$39,394 Black householders$94,815 Asian householders$120,979 Some other race householders$108,918 Two or more races householders$108,103 Hispanic or Latino race householdersMedian 2022 house value $318,928 White Non-Hispanic householders$351,563 Black or African American householders$328,465 American Indian or Alaska Native householders $315,538 Asian householders$476,804 Native Hawaiian and other Pacific Islander householders$385,893 Some other race householders$342,875 Two or more races householders$351,775 Hispanic or Latino householders
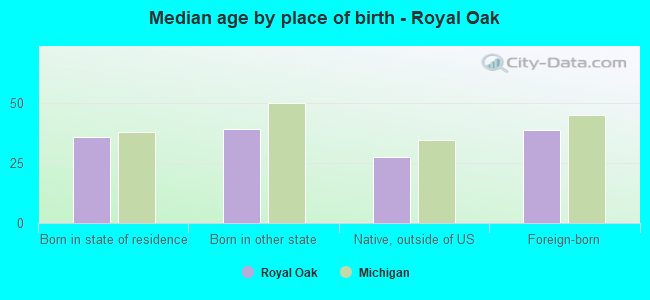
Median age by race in Royal Oak
38.0 Median age for White residents37.1 39.2 35.9 Median age for Black or African American residents34.5 36.7 51.0 Median age for American Indian / Alaska Native residents-505,050,504.5 -728,395,061.0 33.4 Median age for Asian residents32.8 35.0 -670,531,400.3 Median age for Native Hawaiian / Pacific Islander residents-674,772,035.8 -699,588,476.7 30.0 Median age for Other race residents32.2 27.9 27.1 Median age for Two or more races residents29.3 26.0 37.9 Median age for White alone residents36.9 39.5 33.7 Median age for Hispanic or Latino residents34.4 32.3
Owner/renter occupied households by race in Royal Oak
House owners and renters - White residents 17,273 70.1% Owner occupied7,355 29.9% Renter occupiedHouse owners and renters - Black or African American residents 186 13.3% Owner occupied1,211 86.7% Renter occupiedHouse owners and renters - American Indian / Alaska Native residents 2 100.0% Owner occupiedHouse owners and renters - Asian residents 579 52.3% Owner occupied529 47.7% Renter occupiedHouse owners and renters - Other race residents 197 60.9% Owner occupied127 39.1% Renter occupiedHouse owners and renters - Two or more races residents 949 64.8% Owner occupied515 35.2% Renter occupiedHouse owners and renters - White alone residents 17,162 70.3% Owner occupied7,237 29.7% Renter occupiedHouse owners and renters - Hispanic or Latino residents 544 48.6% Owner occupied575 51.4% Renter occupied
Language usage in Royal Oak
English speakers - Total 92.3% of residents of Royal Oak speak English at home.
2.0% of residents speak Spanish at home 970 89.2% Speak English very well118 10.8% Speak English less than very well5.6% of residents speak other language at home 2,338 75.5% Speak English very well758 24.5% Speak English less than very well
English speakers - Born in the United States 94.0% of residents of Royal Oak speak English at home.
1.9% of residents speak Spanish at home 140 79.1% Speak English very well37 20.9% Speak English less than very well3.8% of residents speak other language at home 344 98.6% Speak English very well5 1.4% Speak English less than very well
English speakers - Native, born elsewhere 71.4% of residents of Royal Oak speak English at home.
13.3% of residents speak Spanish at home 80 100.0% Speak English very well23.1% of residents speak other language at home 139 100.0% Speak English very well
English speakers - Foreign-born 36.9% of residents of Royal Oak speak English at home.
17.1% of residents speak Spanish at home 623 93.8% Speak English very well41 6.2% Speak English less than very well48.2% of residents speak other language at home 1,230 65.7% Speak English very well641 34.3% Speak English less than very well
White (Caucasian) - Speak only English Native:
97.5% (42,968)Foreign-born:
46.1% (793)
White (Caucasian) - Speak another language Native:
2.6% (1,138)Foreign-born:
55.6% (957)
Black or African American - Speak only English Native:
99.8% (2,725)Foreign-born:
18.5% (13)
Black or African American - Speak another language Native:
0.2% (6)Foreign-born:
86.6% (59)
Asian - Speak only English Native:
70.2% (517)Foreign-born:
44.6% (600)
Asian - Speak another language Native:
30.8% (227)Foreign-born:
56.8% (764)
Other race - Speak only English Native:
84.3% (393)Foreign-born:
1.6% (5)
Other race - Speak another language Native:
9.9% (46)Foreign-born:
100.0% (290)
Two or more races - Speak only English Native:
92.3% (2,453)Foreign-born:
10.2% (45)
Two or more races - Speak another language Native:
7.6% (201)Foreign-born:
90.3% (400)
White alone - Speak only English Native:
97.4% (42,518)Foreign-born:
46.0% (781)
White alone - Speak another language Native:
2.5% (1,097)Foreign-born:
55.0% (933)
Hispanic or Latino - Speak only English Native:
80.4% (1,420)Foreign-born:
5.1% (34)
Hispanic or Latino - Speak another language Native:
17.5% (309)Foreign-born:
95.2% (622)
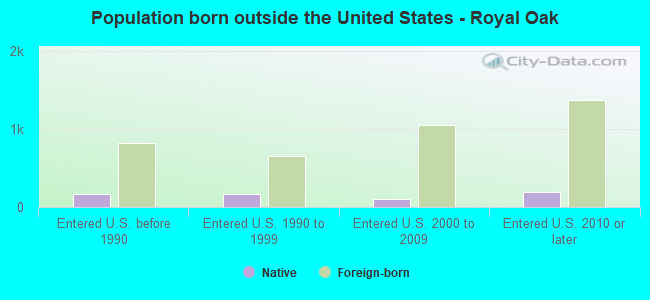
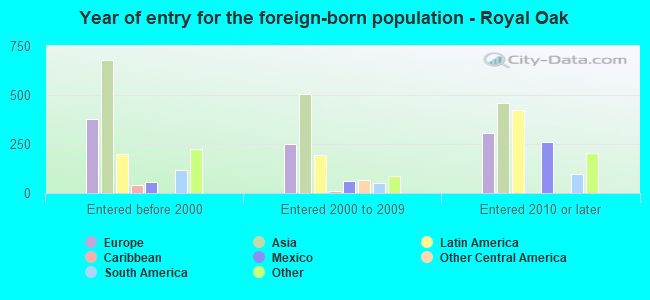
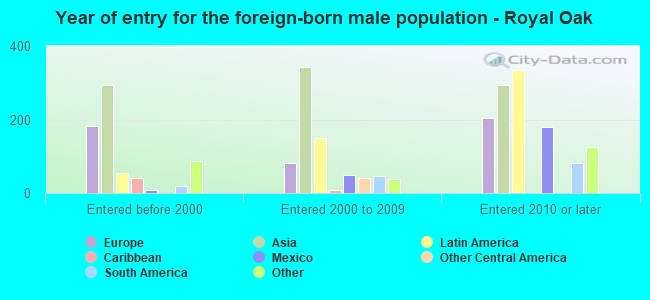
Foreign-born residents in Royal Oak 3,869 residents are foreign born (2.8% Asia , 1.8% Europe , 1.2% Latin America , 0.8% North America ).
This city:
6.7%Michigan:
6.9%
Marital status for residents in Royal Oak Marital status - White (Caucasian) population 15 years and over
Males 46.6% Never married42.1% Now married0.4% Separated1.9% Widowed9.1% DivorcedFemales 37.0% Never married43.1% Now married0.9% Separated6.2% Widowed12.9% DivorcedWomen who gave birth in the past 12 months Now married:
98.2% (523)Unmarried:
1.8% (10)
Women who did not give birth in the past 12 months Now married:
38.8% (4,446)Unmarried:
61.2% (7,027)
Marital status - Black or African American population 15 years and over
Males 60.4% Never married22.2% Now married2.5% Separated0.0% Widowed14.9% DivorcedFemales 40.7% Never married31.5% Now married0.7% Separated9.8% Widowed17.2% DivorcedWomen who gave birth in the past 12 months Now married:
45.5% (9)Unmarried:
54.5% (11)
Women who did not give birth in the past 12 months Now married:
41.2% (354)Unmarried:
58.8% (505)
Marital status - American Indian / Alaska Native population 15 years and over
Males 0.0% Never married0.0% Now married0.0% Separated0.0% Widowed100.0% DivorcedFemales 0.0% Never married87.0% Now married0.0% Separated0.0% Widowed13.0% DivorcedWomen who did not give birth in the past 12 months Now married:
100.0% (21)Unmarried:
0.0% (0)
Marital status - Asian population 15 years and over
Males 58.3% Never married37.7% Now married0.0% Separated1.1% Widowed2.9% DivorcedFemales 41.9% Never married44.8% Now married0.0% Separated5.4% Widowed8.0% DivorcedWomen who gave birth in the past 12 months Now married:
76.2% (48)Unmarried:
23.8% (15)
Women who did not give birth in the past 12 months Now married:
38.6% (305)Unmarried:
61.4% (485)
Marital status - Other race population 15 years and over
Males 76.0% Never married15.5% Now married0.0% Separated0.0% Widowed8.4% DivorcedFemales 48.4% Never married26.1% Now married0.0% Separated0.0% Widowed25.5% DivorcedWomen who did not give birth in the past 12 months Now married:
15.6% (32)Unmarried:
84.4% (174)
Marital status - Two or more races population 15 years and over
Males 57.9% Never married36.3% Now married2.4% Separated0.9% Widowed2.6% DivorcedFemales 49.3% Never married40.6% Now married0.0% Separated3.2% Widowed6.9% DivorcedWomen who gave birth in the past 12 months Now married:
55.3% (29)Unmarried:
44.7% (24)
Women who did not give birth in the past 12 months Now married:
34.5% (319)Unmarried:
65.5% (606)
Marital status - White alone, not Hispanic / Latino population 15 years and over
Males 46.6% Never married42.2% Now married0.4% Separated1.9% Widowed8.9% DivorcedFemales 36.6% Never married43.4% Now married0.6% Separated6.3% Widowed13.0% DivorcedWomen who gave birth in the past 12 months Now married:
100.0% (500)Unmarried:
0.0% (0)
Women who did not give birth in the past 12 months Now married:
38.6% (4,324)Unmarried:
61.4% (6,882)
Marital status - Hispanic or Latino population 15 years and over
Males 55.4% Never married31.9% Now married1.4% Separated0.0% Widowed11.3% DivorcedFemales 45.3% Never married36.5% Now married7.1% Separated0.0% Widowed11.1% DivorcedWomen who gave birth in the past 12 months Now married:
55.0% (36)Unmarried:
45.0% (29)
Women who did not give birth in the past 12 months Now married:
39.8% (342)Unmarried:
60.2% (517)
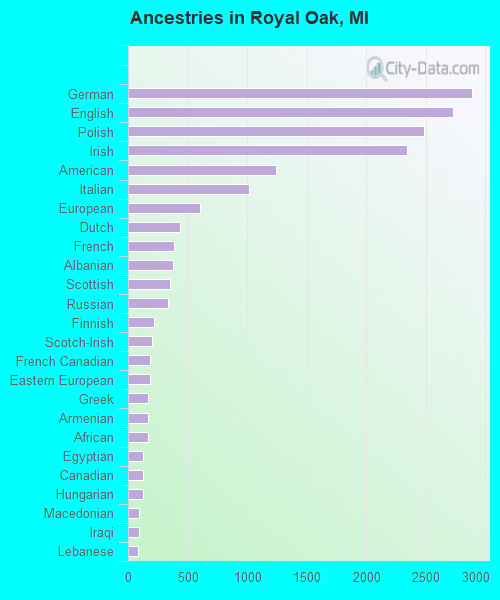
Ancestries in Royal Oak
2,886 12.0% German2,725 11.4% English2,483 10.3% Polish2,339 9.7% Irish1,242 5.2% American1,018 4.2% Italian604 2.5% European433 1.8% Dutch383 1.6% French376 1.6% Albanian353 1.5% Scottish335 1.4% Russian222 0.9% Finnish200 0.8% Scotch-Irish184 0.8% French Canadian181 0.8% Eastern European171 0.7% Greek167 0.7% Armenian166 0.7% African129 0.5% Egyptian128 0.5% Canadian124 0.5% Hungarian94 0.4% Macedonian89 0.4% Iraqi81 0.3% Lebanese81 0.3% Brazilian77 0.3% British77 0.3% Belgian75 0.3% Slovak74 0.3% Swedish71 0.3% Northern European61 0.3% Scandinavian60 0.2% Austrian59 0.2% Syrian59 0.2% Guyanese59 0.2% Arab53 0.2% Assyrian50 0.2% Romanian42 0.2% Ukrainian40 0.2% Israeli37 0.2% Carpatho Rusyn36 0.1% Norwegian31 0.1% Yugoslavian30 0.1% Czechoslovakian30 0.1% Danish29 0.1% Iranian28 0.1% Croatian25 0.1% Celtic23 0.10% Swiss20 0.08% Bulgarian18 0.07% Serbian17 0.07% Ethiopian16 0.07% Palestinian15 0.06% Afghan13 0.05% Cypriot12 0.05% Jordanian10 0.04% Maltese9 0.04% Czech8 0.03% Icelander8 0.03% Jamaican5 0.02% Portuguese4 0.02% Moroccan3 0.01% Lithuanian
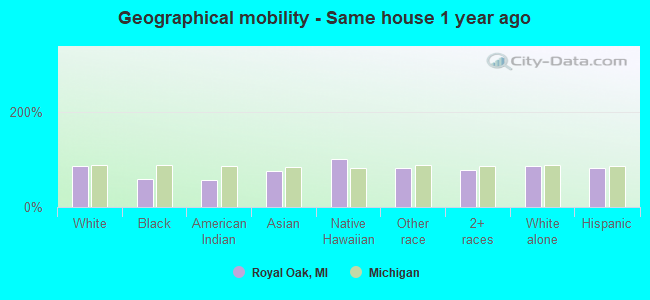
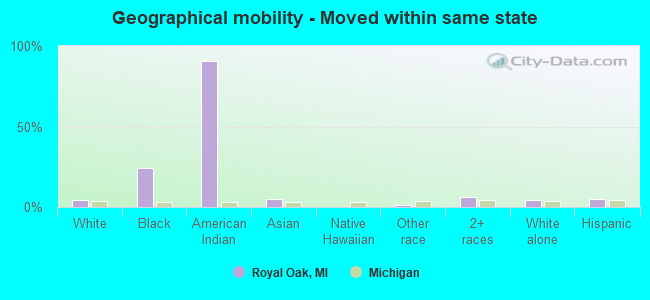
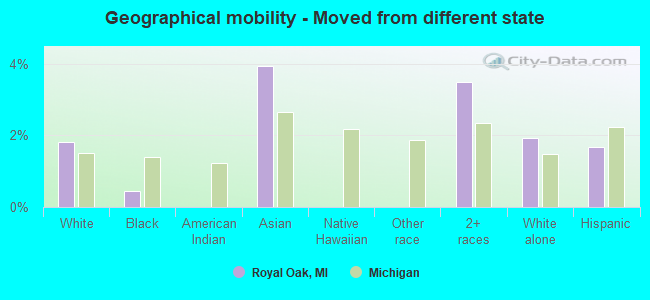
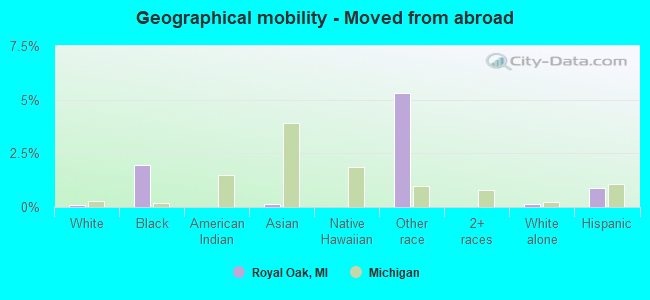
Geographical mobility in Royal Oak Same house 1 year ago 40,068 84.7% White (Caucasian)1,818 58.8% Black or African American16 56.4% American Indian / Alaska Native1,577 74.8% Asian13 100.0% Native Hawaiian / Pacific Islander667 81.7% Other race2,729 78.4% Two or more races39,653 84.6% White alone, not Hispanic / Latino2,098 80.6% Hispanic or LatinoMoved within same county 4,347 9.2% White / Caucasian355 11.5% Black or African American253 12.0% Asian99 12.2% Other race391 11.2% Two or more races4,305 9.2% White alone, not Hispanic / Latino281 10.8% Hispanic or LatinoMoved within same state 1,953 4.1% White / Caucasian741 24.0% Black or African American26 90.7% American Indian / Alaska Native111 5.3% Asian11 1.4% Other race207 5.9% Two or more races1,916 4.1% White alone, not Hispanic / Latino129 4.9% Hispanic or LatinoMoved from different state 864 1.8% White / Caucasian14 0.5% Black or African American83 3.9% Asian121 3.5% Two or more races905 1.9% White alone, not Hispanic / Latino44 1.7% Hispanic or LatinoMoved from abroad 46 0.1% White60 1.9% Black or African American3 0.2% Asian43 5.3% Other race60 0.1% White alone, not Hispanic / Latino23 0.9% Hispanic or Latino
Children Nativity (place of birth) in Royal Oak
Children under 6 years - Living with two parents Both parents native 2,543 100.0% Native1 0.0% Foreign-bornBoth parents foreign-born 117 85.0% Native21 15.0% Foreign-bornOne native, one foreign-born parent 276 100.0% NativeChildren under 6 years - Living with one parent Native parent 905 100.0% NativeChildren 6 to 17 years - Living with two parents Both parents native 2,469 99.0% Native26 1.0% Foreign-bornBoth parents foreign-born 78 100.0% NativeOne native, one foreign-born parent 374 97.3% Native10 2.7% Foreign-bornChildren 6 to 17 years - Living with one parent Native parent 1,089 100.0% NativeForeign-born parent 66 46.9% Native75 53.1% Foreign-born
Grandparents responsible for own grandchildren in Royal Oak
Grandparents (30 to 59 years) White / Caucasian 20 42.9% Responsible for grandchildren26 57.1% Not responsible for grandchildrenBlack or African American 19 100.0% Not responsible for grandchildrenWhite alone, not Hispanic / Latino 20 43.3% Responsible for grandchildren27 56.7% Not responsible for grandchildrenGrandparents (60 years and over) White / Caucasian 63 25.1% Responsible for grandchildren187 74.9% Not responsible for grandchildrenBlack or African American 84 100.0% Not responsible for grandchildrenWhite alone, not Hispanic / Latino 65 25.7% Responsible for grandchildren189 74.3% Not responsible for grandchildren