Races in Ruston, Louisiana (LA) Detailed Stats
Data:
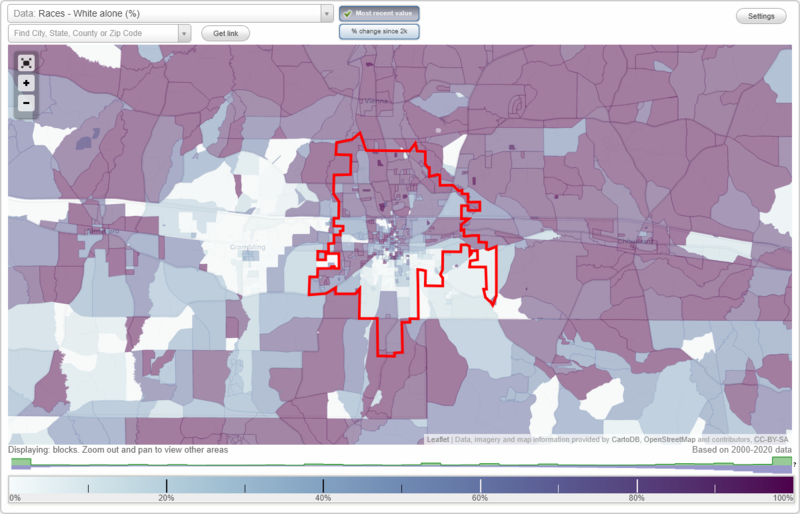
Races - White alone (%)
Races - White alone (% change since 2000)
Races - Black alone (%)
Races - Black alone (% change since 2000)
Races - American Indian alone (%)
Races - American Indian alone (% change since 2000)
Races - Asian alone (%)
Races - Asian alone (% change since 2000)
Races - Hispanic (%)
Races - Hispanic (% change since 2000)
Races - Native Hawaiian and Other Pacific Islander alone (%)
Races - Native Hawaiian and Other Pacific Islander alone (% change since 2000)
Races - Two or more races(%)
Races - Two or more races(% change since 2000)
Races - Other race alone (%)
Races - Other race alone (% change since 2000)
Racial diversity
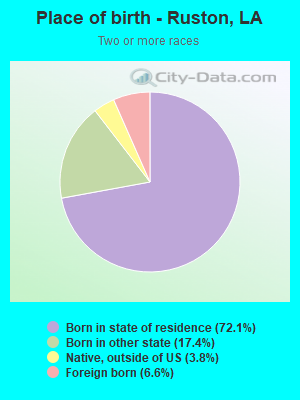
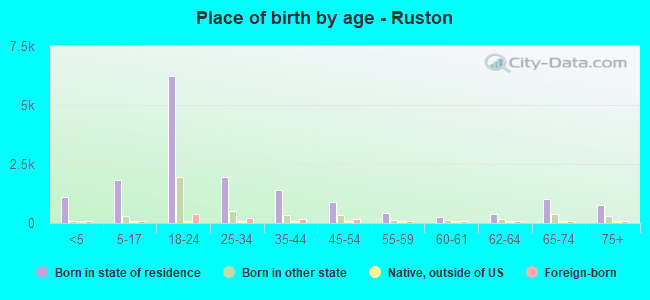
Place of birth - Born in state of residence (%)
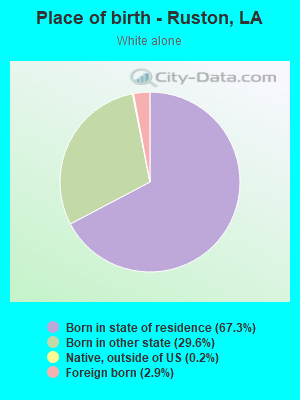
Place of birth - Born in state of residence (%) - White
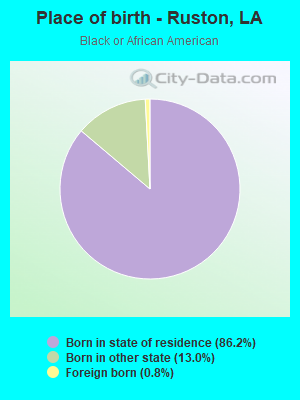
Place of birth - Born in state of residence (%) - Black or African American
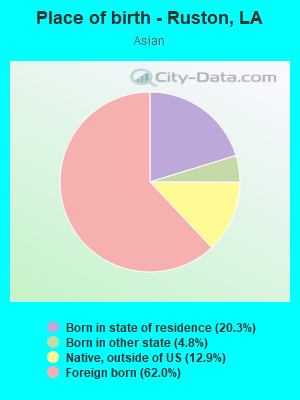
Place of birth - Born in state of residence (%) - Asian
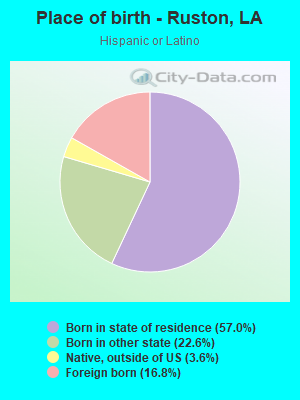
Place of birth - Born in state of residence (%) - Hispanic or Latino
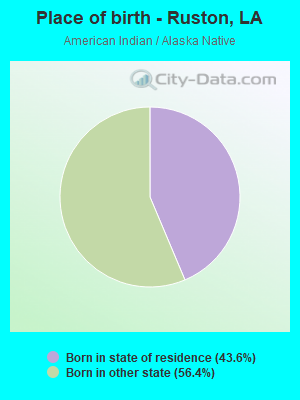
Place of birth - Born in state of residence (%) - American Indian and Alaska Native
Place of birth - Born in state of residence (%) - Multirace
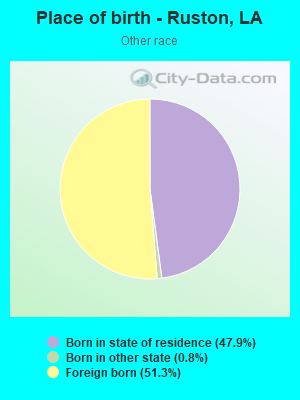
Place of birth - Born in state of residence (%) - Other Race
Place of birth - Born in other state (%)
Place of birth - Born in other state (%) - White
Place of birth - Born in other state (%) - Black or African American
Place of birth - Born in other state (%) - Asian
Place of birth - Born in other state (%) - Hispanic or Latino
Place of birth - Born in other state (%) - American Indian and Alaska Native
Place of birth - Born in other state (%) - Multirace
Place of birth - Born in other state (%) - Other Race
Place of birth - Native, outside of US (%)
Place of birth - Native, outside of US (%) - White
Place of birth - Native, outside of US (%) - Black or African American
Place of birth - Native, outside of US (%) - Asian
Place of birth - Native, outside of US (%) - Hispanic or Latino
Place of birth - Native, outside of US (%) - American Indian and Alaska Native
Place of birth - Native, outside of US (%) - Multirace
Place of birth - Native, outside of US (%) - Other Race
Place of birth - Foreign born (%)
Place of birth - Foreign born (%) - White
Place of birth - Foreign born (%) - Black or African American
Place of birth - Foreign born (%) - Asian
Place of birth - Foreign born (%) - Hispanic or Latino
Place of birth - Foreign born (%) - American Indian and Alaska Native
Place of birth - Foreign born (%) - Multirace
Place of birth - Foreign born (%) - Other Race
Residents speaking English at home (%)
Residents speaking English at home - Born in the United States (%)
Residents speaking English at home - Native, born elsewhere (%)
Residents speaking English at home - Foreign born (%)
Residents speaking Spanish at home (%)
Residents speaking Spanish at home - Born in the United States (%)
Residents speaking Spanish at home - Native, born elsewhere (%)
Residents speaking Spanish at home - Foreign born (%)
Residents speaking other language at home (%)
Residents speaking other language at home - Born in the United States (%)
Residents speaking other language at home - Native, born elsewhere (%)
Residents speaking other language at home - Foreign born (%)
Marital status - Never married (%)
Marital status - Now married (%)
Marital status - Separated (%)
Marital status - Widowed (%)
Marital status - Divorced (%)
Ancestries Reported - Arab (%)
Ancestries Reported - Czech (%)
Ancestries Reported - Danish (%)
Ancestries Reported - Dutch (%)
Ancestries Reported - English (%)
Ancestries Reported - French (%)
Ancestries Reported - French Canadian (%)
Ancestries Reported - German (%)
Ancestries Reported - Greek (%)
Ancestries Reported - Hungarian (%)
Ancestries Reported - Irish (%)
Ancestries Reported - Italian (%)
Ancestries Reported - Lithuanian (%)
Ancestries Reported - Norwegian (%)
Ancestries Reported - Polish (%)
Ancestries Reported - Portuguese (%)
Ancestries Reported - Russian (%)
Ancestries Reported - Scotch-Irish (%)
Ancestries Reported - Scottish (%)
Ancestries Reported - Slovak (%)
Ancestries Reported - Subsaharan African (%)
Ancestries Reported - Swedish (%)
Ancestries Reported - Swiss (%)
Ancestries Reported - Ukrainian (%)
Ancestries Reported - United States (%)
Ancestries Reported - Welsh (%)
Ancestries Reported - West Indian (%)
Ancestries Reported - Other (%)
Geographical mobility - Same house 1 year ago (%)
Geographical mobility - Same house 1 year ago (%) - White
Geographical mobility - Same house 1 year ago (%) - Black or African American
Geographical mobility - Same house 1 year ago (%) - Asian
Geographical mobility - Same house 1 year ago (%) - Hispanic or Latino
Geographical mobility - Same house 1 year ago (%) - American Indian and Alaska Native
Geographical mobility - Same house 1 year ago (%) - Multirace
Geographical mobility - Same house 1 year ago (%) - Other Race
Geographical mobility - Moved within same county (%)
Geographical mobility - Moved within same county (%) - White
Geographical mobility - Moved within same county (%) - Black or African American
Geographical mobility - Moved within same county (%) - Asian
Geographical mobility - Moved within same county (%) - Hispanic or Latino
Geographical mobility - Moved within same county (%) - American Indian and Alaska Native
Geographical mobility - Moved within same county (%) - Multirace
Geographical mobility - Moved within same county (%) - Other Race
Geographical mobility - Moved from different county within same state (%)
Geographical mobility - Moved from different county within same state (%) - White
Geographical mobility - Moved from different county within same state (%) - Black or African American
Geographical mobility - Moved from different county within same state (%) - Asian
Geographical mobility - Moved from different county within same state (%) - Hispanic or Latino
Geographical mobility - Moved from different county within same state (%) - American Indian and Alaska Native
Geographical mobility - Moved from different county within same state (%) - Multirace
Geographical mobility - Moved from different county within same state (%) - Other Race
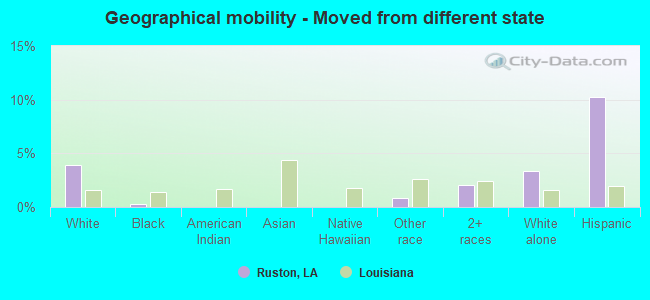
Geographical mobility - Moved from different state (%)
Geographical mobility - Moved from different state (%) - White
Geographical mobility - Moved from different state (%) - Black or African American
Geographical mobility - Moved from different state (%) - Asian
Geographical mobility - Moved from different state (%) - Hispanic or Latino
Geographical mobility - Moved from different state (%) - American Indian and Alaska Native
Geographical mobility - Moved from different state (%) - Multirace
Geographical mobility - Moved from different state (%) - Other Race
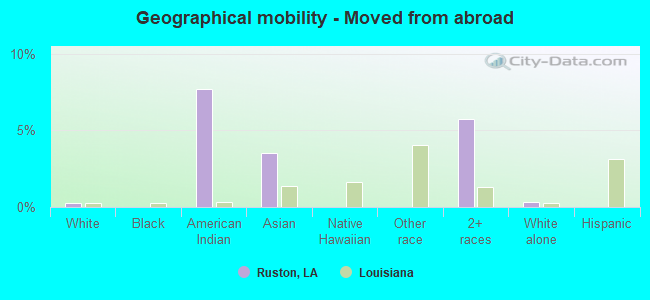
Geographical mobility - Moved from abroad (%)
Geographical mobility - Moved from abroad (%) - White
Geographical mobility - Moved from abroad (%) - Black or African American
Geographical mobility - Moved from abroad (%) - Asian
Geographical mobility - Moved from abroad (%) - Hispanic or Latino
Geographical mobility - Moved from abroad (%) - American Indian and Alaska Native
Geographical mobility - Moved from abroad (%) - Multirace
Geographical mobility - Moved from abroad (%) - Other Race
Place of birth for the foreign-born population - Ireland (%)
Place of birth for the foreign-born population - Denmark (%)
Place of birth for the foreign-born population - Norway (%)
Place of birth for the foreign-born population - Sweden (%)
Place of birth for the foreign-born population - United Kingdom (%)
Place of birth for the foreign-born population - England (%)
Place of birth for the foreign-born population - Scotland (%)
Place of birth for the foreign-born population - Other Northern Europe (%)
Place of birth for the foreign-born population - Austria (%)
Place of birth for the foreign-born population - Belgium (%)
Place of birth for the foreign-born population - France (%)
Place of birth for the foreign-born population - Germany (%)
Place of birth for the foreign-born population - Netherlands (%)
Place of birth for the foreign-born population - Switzerland (%)
Place of birth for the foreign-born population - Other Western Europe (%)
Place of birth for the foreign-born population - Greece (%)
Place of birth for the foreign-born population - Italy (%)
Place of birth for the foreign-born population - Portugal (%)
Place of birth for the foreign-born population - Spain (%)
Place of birth for the foreign-born population - Other Southern Europe (%)
Place of birth for the foreign-born population - Albania (%)
Place of birth for the foreign-born population - Belarus (%)
Place of birth for the foreign-born population - Bosnia and Herzegovina (%)
Place of birth for the foreign-born population - Bulgaria (%)
Place of birth for the foreign-born population - Croatia (%)
Place of birth for the foreign-born population - Czechoslovakia (%)
Place of birth for the foreign-born population - Hungary (%)
Place of birth for the foreign-born population - Latvia (%)
Place of birth for the foreign-born population - Lithuania (%)
Place of birth for the foreign-born population - North Macedonia (Macedonia) (%)
Place of birth for the foreign-born population - Moldova (%)
Place of birth for the foreign-born population - Poland (%)
Place of birth for the foreign-born population - Romania (%)
Place of birth for the foreign-born population - Russia (%)
Place of birth for the foreign-born population - Serbia (%)
Place of birth for the foreign-born population - Ukraine (%)
Place of birth for the foreign-born population - Other Eastern Europe (%)
Place of birth for the foreign-born population - China (%)
Place of birth for the foreign-born population - Hong Kong (%)
Place of birth for the foreign-born population - Taiwan (%)
Place of birth for the foreign-born population - Japan (%)
Place of birth for the foreign-born population - Korea (%)
Place of birth for the foreign-born population - Other Eastern Asia (%)
Place of birth for the foreign-born population - Afghanistan (%)
Place of birth for the foreign-born population - Bangladesh (%)
Place of birth for the foreign-born population - India (%)
Place of birth for the foreign-born population - Iran (%)
Place of birth for the foreign-born population - Kazakhstan (%)
Place of birth for the foreign-born population - Nepal (%)
Place of birth for the foreign-born population - Pakistan (%)
Place of birth for the foreign-born population - Sri Lanka (%)
Place of birth for the foreign-born population - Uzbekistan (%)
Place of birth for the foreign-born population - Other South Central Asia (%)
Place of birth for the foreign-born population - Burma (%)
Place of birth for the foreign-born population - Cambodia (%)
Place of birth for the foreign-born population - Indonesia (%)
Place of birth for the foreign-born population - Laos (%)
Place of birth for the foreign-born population - Malaysia (%)
Place of birth for the foreign-born population - Philippines (%)
Place of birth for the foreign-born population - Singapore (%)
Place of birth for the foreign-born population - Thailand (%)
Place of birth for the foreign-born population - Vietnam (%)
Place of birth for the foreign-born population - Other South Eastern Asia (%)
Place of birth for the foreign-born population - Armenia (%)
Place of birth for the foreign-born population - Iraq (%)
Place of birth for the foreign-born population - Israel (%)
Place of birth for the foreign-born population - Jordan (%)
Place of birth for the foreign-born population - Kuwait (%)
Place of birth for the foreign-born population - Lebanon (%)
Place of birth for the foreign-born population - Saudi Arabia (%)
Place of birth for the foreign-born population - Syria (%)
Place of birth for the foreign-born population - Turkey (%)
Place of birth for the foreign-born population - Yemen (%)
Place of birth for the foreign-born population - Other Western Asia (%)
Place of birth for the foreign-born population - Eritrea (%)
Place of birth for the foreign-born population - Ethiopia (%)
Place of birth for the foreign-born population - Kenya (%)
Place of birth for the foreign-born population - Somalia (%)
Place of birth for the foreign-born population - Uganda (%)
Place of birth for the foreign-born population - Zimbabwe (%)
Place of birth for the foreign-born population - Other Eastern Africa (%)
Place of birth for the foreign-born population - Cameroon (%)
Place of birth for the foreign-born population - Congo (%)
Place of birth for the foreign-born population - Democratic Republic of Congo (Zaire) (%)
Place of birth for the foreign-born population - Other Middle Africa (%)
Place of birth for the foreign-born population - Egypt (%)
Place of birth for the foreign-born population - Morocco (%)
Place of birth for the foreign-born population - Sudan (%)
Place of birth for the foreign-born population - Other Northern Africa (%)
Place of birth for the foreign-born population - South Africa (%)
Place of birth for the foreign-born population - Other Southern Africa (%)
Place of birth for the foreign-born population - Cabo Verde (%)
Place of birth for the foreign-born population - Ghana (%)
Place of birth for the foreign-born population - Liberia (%)
Place of birth for the foreign-born population - Nigeria (%)
Place of birth for the foreign-born population - Senegal (%)
Place of birth for the foreign-born population - Sierra Leone (%)
Place of birth for the foreign-born population - Other Western Africa (%)
Place of birth for the foreign-born population - Australia (%)
Place of birth for the foreign-born population - New Zealand (%)
Place of birth for the foreign-born population - Fiji (%)
Place of birth for the foreign-born population - Micronesia (%)
Place of birth for the foreign-born population - Bahamas (%)
Place of birth for the foreign-born population - Barbados (%)
Place of birth for the foreign-born population - Cuba (%)
Place of birth for the foreign-born population - Dominica (%)
Place of birth for the foreign-born population - Dominican Republic (%)
Place of birth for the foreign-born population - Grenada (%)
Place of birth for the foreign-born population - Haiti (%)
Place of birth for the foreign-born population - Jamaica (%)
Place of birth for the foreign-born population - St. Vincent and the Grenadines (%)
Place of birth for the foreign-born population - Trinidad and Tobago (%)
Place of birth for the foreign-born population - West Indies (%)
Place of birth for the foreign-born population - Other Caribbean (%)
Place of birth for the foreign-born population - Belize (%)
Place of birth for the foreign-born population - Costa Rica (%)
Place of birth for the foreign-born population - El Salvador (%)
Place of birth for the foreign-born population - Guatemala (%)
Place of birth for the foreign-born population - Honduras (%)
Place of birth for the foreign-born population - Mexico (%)
Place of birth for the foreign-born population - Nicaragua (%)
Place of birth for the foreign-born population - Panama (%)
Place of birth for the foreign-born population - Other Central America (%)
Place of birth for the foreign-born population - Argentina (%)
Place of birth for the foreign-born population - Bolivia (%)
Place of birth for the foreign-born population - Brazil (%)
Place of birth for the foreign-born population - Chile (%)
Place of birth for the foreign-born population - Colombia (%)
Place of birth for the foreign-born population - Ecuador (%)
Place of birth for the foreign-born population - Guyana (%)
Place of birth for the foreign-born population - Peru (%)
Place of birth for the foreign-born population - Uruguay (%)
Place of birth for the foreign-born population - Venezuela (%)
Place of birth for the foreign-born population - Other South America (%)
Place of birth for the foreign-born population - Canada (%)
Place of birth for the foreign-born population - Other Northern America (%)
Place of birth for the foreign-born population - Other (%)
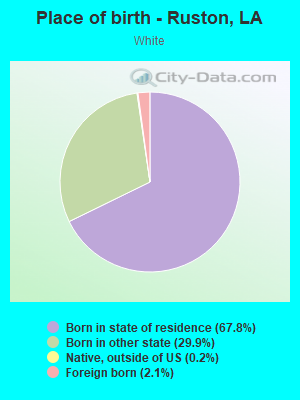
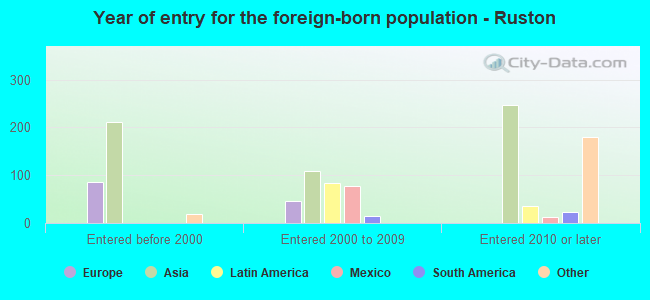
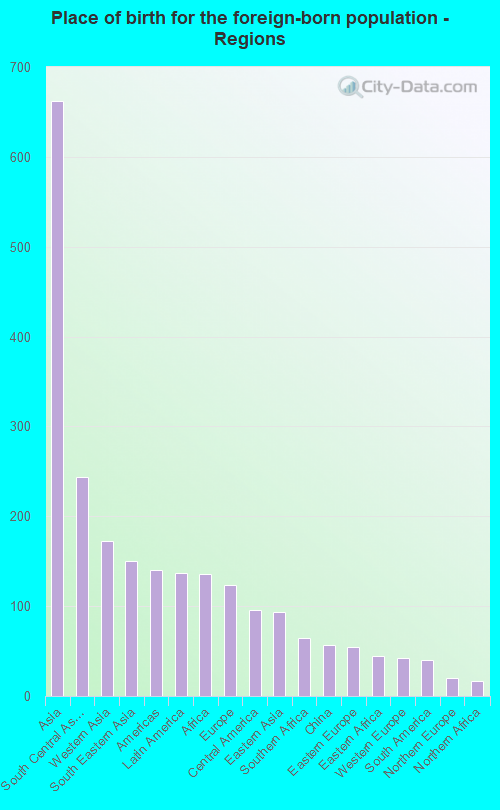
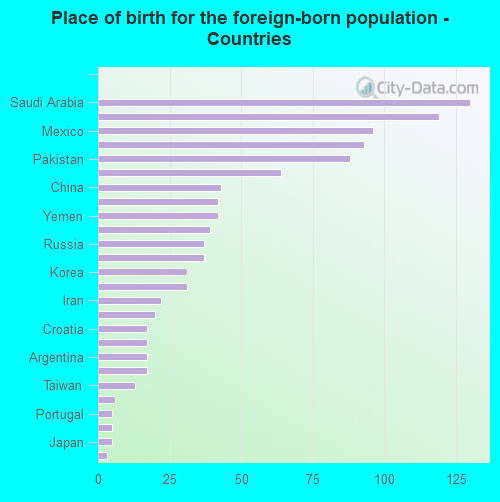
According to 2022 data, the most numerous races in Ruston, LA are White alone (10,315 residents), Black alone (9,125 residents), and Hispanic (734 residents). 94.2% of Ruston residents speak English at home. 4.8% of Ruston, LA residents are foreign-born (2.9% born in Asia, 0.6% born in Latin America, 0.6% born in Africa, 0.5% born in Europe), which is 17.1% greater than the foreign-born rate of 4.0% across the entire state of Louisiana.
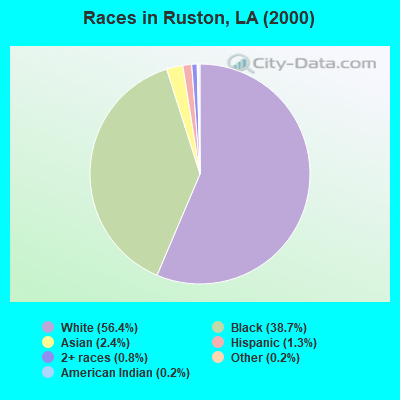
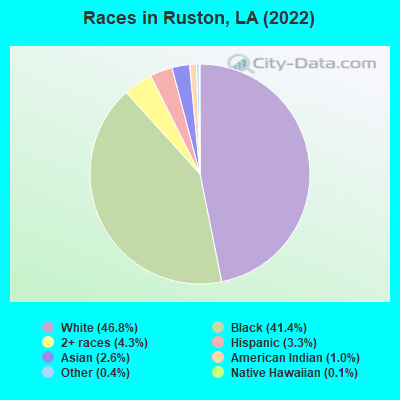
Race distribution in Ruston
2000 2022
2,794,391 62.5% White alone 1,443,390 32.3% Black alone 107,738 2.4% Hispanic 54,256 1.2% Asian alone 39,260 0.9% Two or more races 24,129 0.5% American Indian alone 4,736 0.1% Other race alone 1,076 0.02% Native Hawaiian and Other
2,603,221 56.7% White alone 1,420,055 30.9% Black alone 262,213 5.7% Hispanic 183,270 4.0% Two or more races 81,169 1.8% Asian alone 19,991 0.4% American Indian alone 18,043 0.4% Other race alone 2,279 0.05% Native Hawaiian and Other
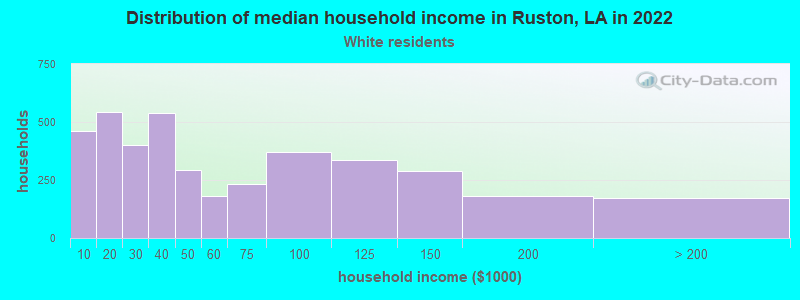
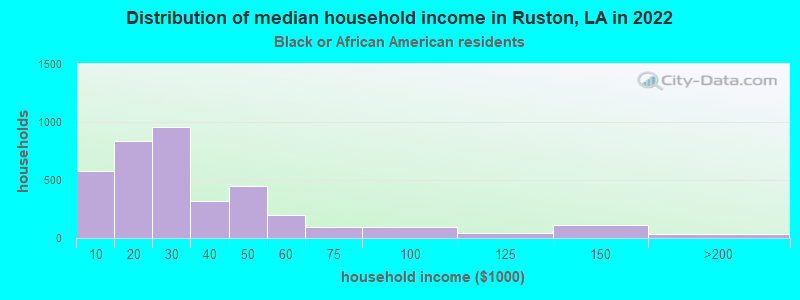
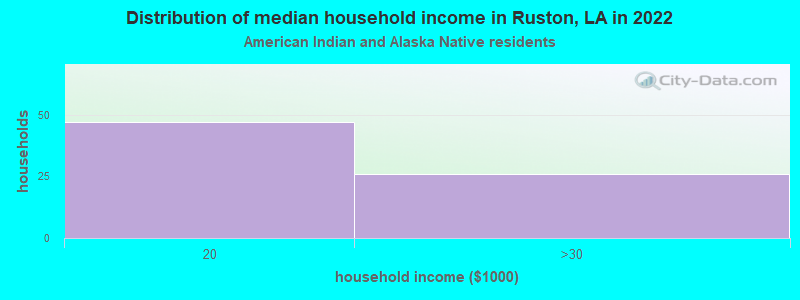
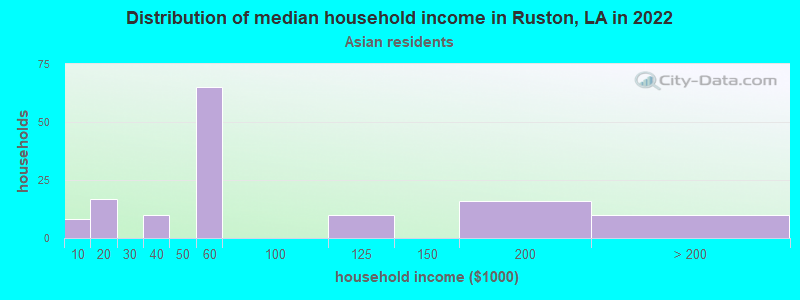
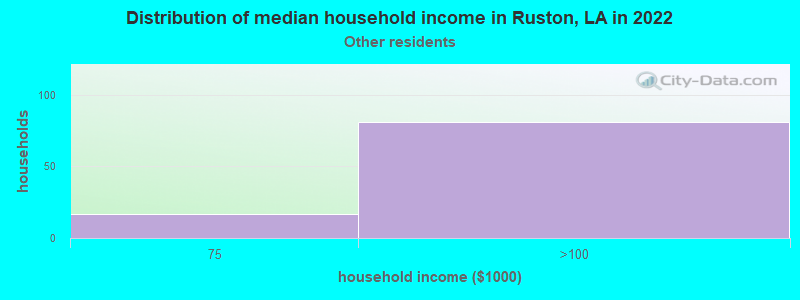
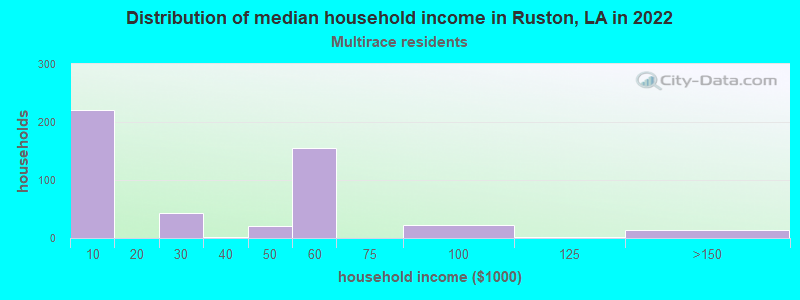
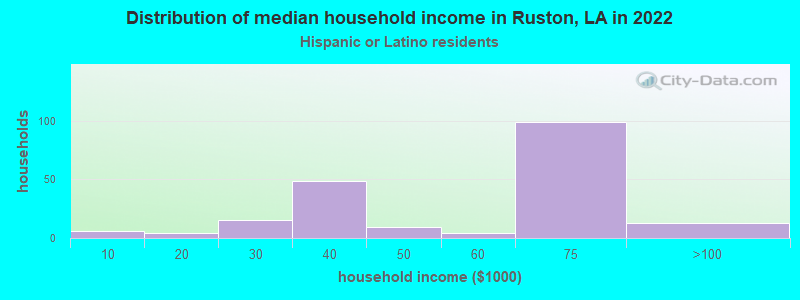
Income and house value in Ruston Median household income in 2022 $43,445 White non-Hispanic householders$24,580 Black householders$49,162 Asian householders$62,767 Hispanic or Latino race householdersMedian 2022 house value $250,466 White Non-Hispanic householders$135,669 Black or African American householders$137,317 American Indian or Alaska Native householders $353,180 Asian householders$514,940 Some other race householders$419,367 Two or more races householders$205,976 Hispanic or Latino householders
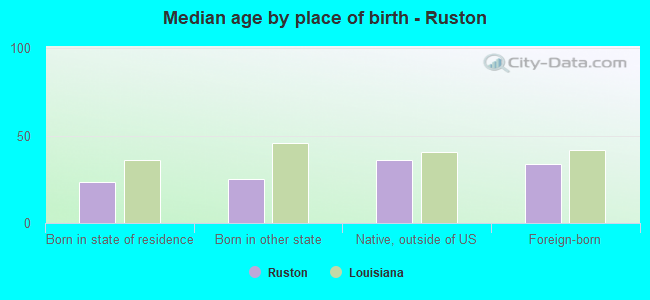
Median age by race in Ruston
25.0 Median age for White residents24.1 26.7 23.8 Median age for Black or African American residents22.9 24.5 25.3 Median age for American Indian / Alaska Native residents42.3 17.3 30.4 Median age for Asian residents28.2 38.6 -821,138,210.6 Median age for Native Hawaiian / Pacific Islander residents-868,167,201.7 -599,999,999.4 20.2 Median age for Other race residents26.7 10.6 22.0 Median age for Two or more races residents21.3 25.5 24.8 Median age for White alone residents23.8 26.8 20.1 Median age for Hispanic or Latino residents21.3 20.4
Owner/renter occupied households by race in Ruston
House owners and renters - White residents 1,878 47.9% Owner occupied2,043 52.1% Renter occupiedHouse owners and renters - Black or African American residents 784 21.4% Owner occupied2,885 78.6% Renter occupiedHouse owners and renters - American Indian / Alaska Native residents 52 58.4% Owner occupied37 41.6% Renter occupiedHouse owners and renters - Asian residents 123 75.0% Owner occupied41 25.0% Renter occupiedHouse owners and renters - Native Hawaiian / Pacific Islander residents 34 100.0% Renter occupiedHouse owners and renters - Other race residents 115 100.0% Renter occupiedHouse owners and renters - Two or more races residents 64 14.7% Owner occupied371 85.3% Renter occupiedHouse owners and renters - White alone residents 1,872 48.3% Owner occupied2,007 51.7% Renter occupiedHouse owners and renters - Hispanic or Latino residents 41 22.3% Owner occupied142 77.7% Renter occupied
Language usage in Ruston
English speakers - Total 94.2% of residents of Ruston speak English at home.
1.4% of residents speak Spanish at home 217 74.6% Speak English very well74 25.4% Speak English less than very well4.4% of residents speak other language at home 535 58.3% Speak English very well382 41.7% Speak English less than very well
English speakers - Born in the United States 98.3% of residents of Ruston speak English at home.
1.0% of residents speak Spanish at home 31 64.6% Speak English very well17 35.4% Speak English less than very well0.6% of residents speak other language at home 26 100.0% Speak English very well
English speakers - Native, born elsewhere 20.4% of residents of Ruston speak English at home.
23.7% of residents speak Spanish at home 22 100.0% Speak English very well62.4% of residents speak other language at home 58 100.0% Speak English very well
English speakers - Foreign-born 14.6% of residents of Ruston speak English at home.
12.2% of residents speak Spanish at home 71 56.8% Speak English very well54 43.2% Speak English less than very well74.9% of residents speak other language at home 393 51.3% Speak English very well373 48.7% Speak English less than very well
White (Caucasian) - Speak only English Native:
99.5% (9,733)Foreign-born:
28.5% (64)
White (Caucasian) - Speak another language Native:
0.9% (86)Foreign-born:
70.0% (157)
Black or African American - Speak only English Native:
98.6% (8,324)Foreign-born:
35.6% (27)
Black or African American - Speak another language Native:
1.4% (118)Foreign-born:
64.7% (49)
Asian - Speak only English Native:
55.1% (103)Foreign-born:
4.6% (17)
Asian - Speak another language Native:
41.6% (77)Foreign-born:
96.7% (361)
Two or more races - Speak only English Native:
95.5% (1,059)Foreign-born:
53.7% (45)
Two or more races - Speak another language Native:
4.1% (45)Foreign-born:
29.5% (25)
White alone - Speak only English Native:
99.5% (9,578)Foreign-born:
23.5% (71)
White alone - Speak another language Native:
0.6% (59)Foreign-born:
76.4% (232)
Hispanic or Latino - Speak another language Native:
13.1% (65)Foreign-born:
99.9% (126)
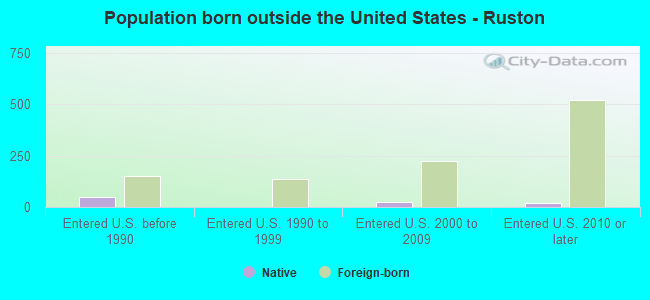
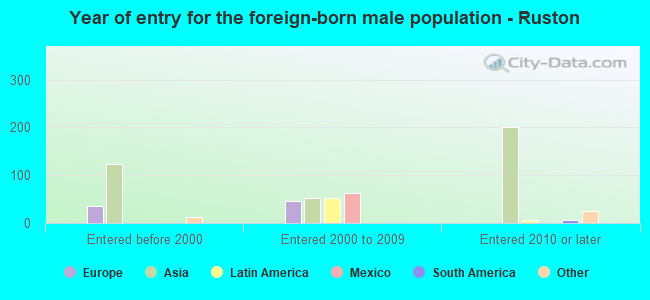
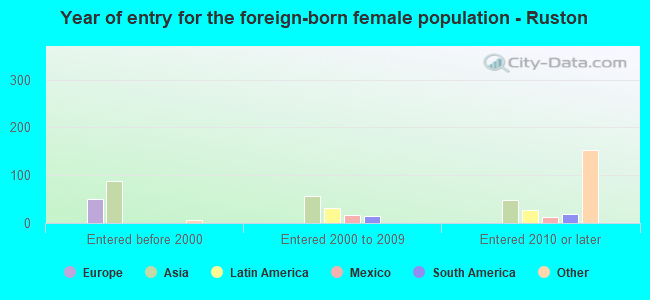
Foreign-born residents in Ruston 1,063 residents are foreign born (2.9% Asia , 0.6% Latin America , 0.6% Africa , 0.5% Europe ).
This city:
4.8%Louisiana:
4.2%
Marital status for residents in Ruston Marital status - White (Caucasian) population 15 years and over
Males 68.0% Never married28.1% Now married0.3% Separated1.3% Widowed2.3% DivorcedFemales 46.5% Never married32.8% Now married1.8% Separated13.3% Widowed5.6% DivorcedWomen who gave birth in the past 12 months Now married:
100.0% (34)Unmarried:
0.0% (0)
Women who did not give birth in the past 12 months Now married:
23.5% (687)Unmarried:
76.5% (2,233)
Marital status - Black or African American population 15 years and over
Males 69.6% Never married21.6% Now married1.5% Separated0.6% Widowed6.7% DivorcedFemales 71.1% Never married12.2% Now married1.3% Separated4.1% Widowed11.3% DivorcedWomen who gave birth in the past 12 months Now married:
30.8% (43)Unmarried:
69.2% (97)
Women who did not give birth in the past 12 months Now married:
5.6% (185)Unmarried:
94.4% (3,102)
Marital status - American Indian / Alaska Native population 15 years and over
Males 100.0% Never married0.0% Now married0.0% Separated0.0% Widowed0.0% DivorcedFemales 45.0% Never married0.0% Now married0.0% Separated0.0% Widowed55.0% DivorcedWomen who did not give birth in the past 12 months Now married:
0.0% (0)Unmarried:
100.0% (22)
Marital status - Asian population 15 years and over
Males 43.6% Never married53.4% Now married0.0% Separated0.0% Widowed3.0% DivorcedFemales 23.5% Never married71.1% Now married0.0% Separated5.4% Widowed0.0% DivorcedWomen who did not give birth in the past 12 months Now married:
73.6% (139)Unmarried:
26.4% (50)
Marital status - Other race population 15 years and over
Males 64.7% Never married0.0% Now married0.0% Separated0.0% Widowed35.3% DivorcedFemales 100.0% Never married0.0% Now married0.0% Separated0.0% Widowed0.0% DivorcedWomen who gave birth in the past 12 months Now married:
0.0% (0)Unmarried:
100.0% (18)
Women who did not give birth in the past 12 months Now married:
0.0% (0)Unmarried:
100.0% (13)
Marital status - Two or more races population 15 years and over
Males 90.4% Never married9.6% Now married0.0% Separated0.0% Widowed0.0% DivorcedFemales 65.0% Never married10.8% Now married0.0% Separated6.5% Widowed17.7% DivorcedWomen who did not give birth in the past 12 months Now married:
6.0% (20)Unmarried:
94.0% (307)
Marital status - White alone, not Hispanic / Latino population 15 years and over
Males 67.6% Never married28.3% Now married0.3% Separated1.4% Widowed2.4% DivorcedFemales 46.2% Never married32.9% Now married1.8% Separated13.4% Widowed5.7% DivorcedWomen who gave birth in the past 12 months Now married:
100.0% (35)Unmarried:
0.0% (0)
Women who did not give birth in the past 12 months Now married:
23.4% (685)Unmarried:
76.6% (2,235)
Marital status - Hispanic or Latino population 15 years and over
Males 66.5% Never married16.3% Now married0.0% Separated0.0% Widowed17.3% DivorcedFemales 76.8% Never married14.6% Now married0.0% Separated0.0% Widowed8.6% DivorcedWomen who gave birth in the past 12 months Now married:
0.0% (0)Unmarried:
100.0% (17)
Women who did not give birth in the past 12 months Now married:
8.4% (14)Unmarried:
91.6% (154)
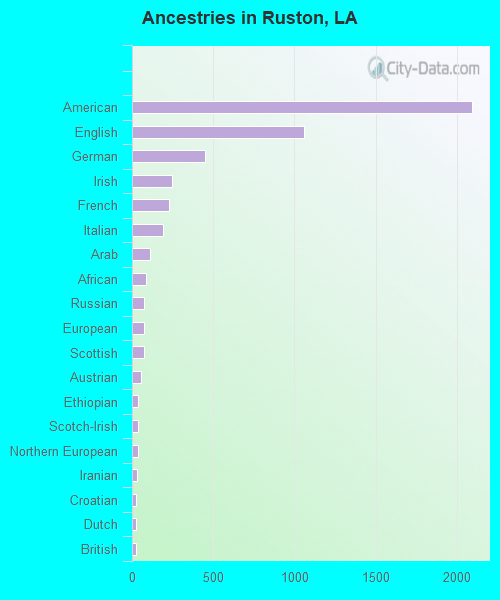
Ancestries in Ruston
2,094 15.1% American1,058 7.6% English448 3.2% German244 1.8% Irish228 1.6% French194 1.4% Italian113 0.8% Arab86 0.6% African73 0.5% Russian71 0.5% European71 0.5% Scottish54 0.4% Austrian40 0.3% Ethiopian38 0.3% Scotch-Irish36 0.3% Northern European32 0.2% Iranian26 0.2% Croatian26 0.2% Dutch22 0.2% British18 0.1% Eastern European17 0.1% Welsh10 0.07% Australian9 0.06% Swedish6 0.04% Egyptian6 0.04% Belgian2 0.01% Danish1 0.01% French Canadian
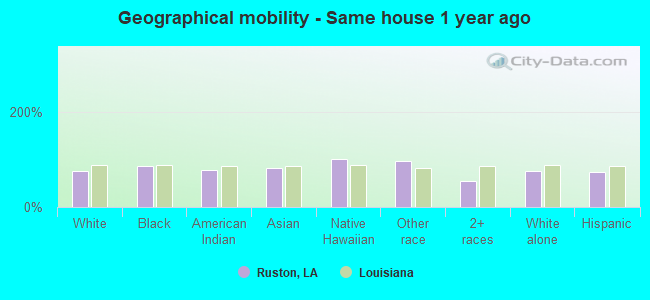
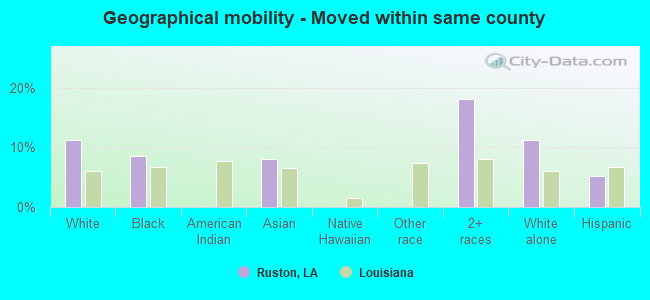
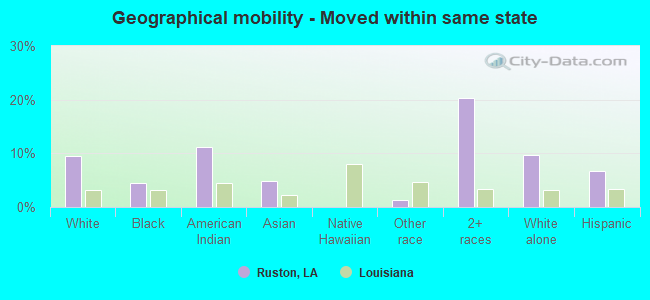
Geographical mobility in Ruston Same house 1 year ago 7,784 75.0% White (Caucasian)7,698 86.2% Black or African American193 78.0% American Indian / Alaska Native469 81.4% Asian33 100.0% Native Hawaiian / Pacific Islander287 95.7% Other race695 55.1% Two or more races7,765 75.5% White alone, not Hispanic / Latino491 73.0% Hispanic or LatinoMoved within same county 1,160 11.2% White / Caucasian757 8.5% Black or African American46 8.0% Asian228 18.1% Two or more races1,154 11.2% White alone, not Hispanic / Latino35 5.2% Hispanic or LatinoMoved within same state 986 9.5% White / Caucasian398 4.5% Black or African American28 11.2% American Indian / Alaska Native28 4.9% Asian4 1.2% Other race257 20.4% Two or more races999 9.7% White alone, not Hispanic / Latino45 6.7% Hispanic or LatinoMoved from different state 402 3.9% White / Caucasian26 0.3% Black or African American2 0.8% Other race26 2.0% Two or more races344 3.3% White alone, not Hispanic / Latino69 10.2% Hispanic or LatinoMoved from abroad 25 0.2% White19 7.7% American Indian / Alaska Native20 3.5% Asian72 5.7% Two or more races30 0.3% White alone, not Hispanic / Latino
Children Nativity (place of birth) in Ruston
Children under 6 years - Living with two parents Both parents native 551 100.0% NativeBoth parents foreign-born 34 100.0% NativeChildren under 6 years - Living with one parent Native parent 686 100.0% NativeForeign-born parent 111 100.0% NativeChildren 6 to 17 years - Living with two parents Both parents native 364 100.0% NativeBoth parents foreign-born 57 100.0% NativeChildren 6 to 17 years - Living with one parent Native parent 1,215 100.0% NativeForeign-born parent 46 50.6% Native45 49.4% Foreign-born
Grandparents responsible for own grandchildren in Ruston
Grandparents (30 to 59 years) Black or African American 98 100.0% Responsible for grandchildren
Grandparents (60 years and over) Black or African American 25 100.0% Not responsible for grandchildren