Races in Safford, Arizona (AZ) Detailed Stats
Data:
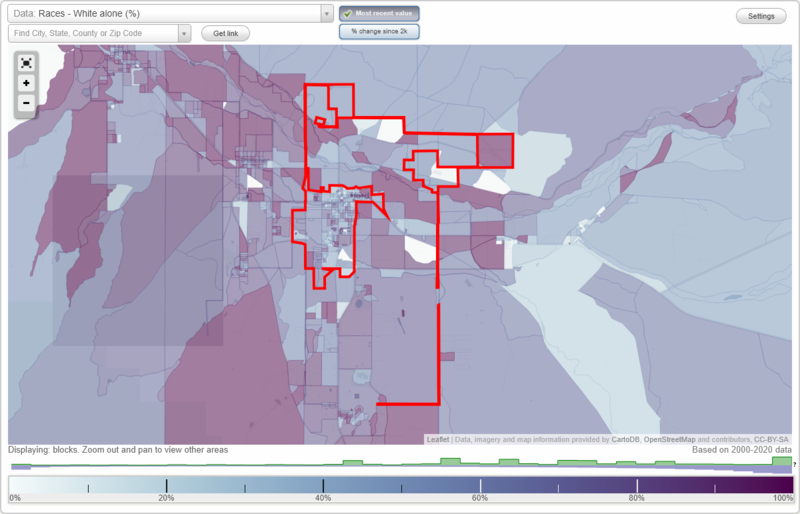
Races - White alone (%)
Races - White alone (% change since 2000)
Races - Black alone (%)
Races - Black alone (% change since 2000)
Races - American Indian alone (%)
Races - American Indian alone (% change since 2000)
Races - Asian alone (%)
Races - Asian alone (% change since 2000)
Races - Hispanic (%)
Races - Hispanic (% change since 2000)
Races - Native Hawaiian and Other Pacific Islander alone (%)
Races - Native Hawaiian and Other Pacific Islander alone (% change since 2000)
Races - Two or more races(%)
Races - Two or more races(% change since 2000)
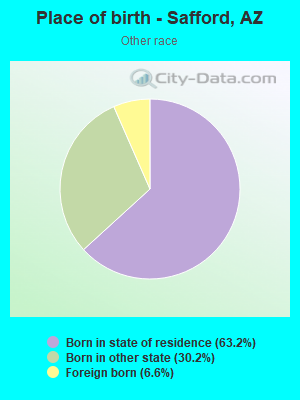
Races - Other race alone (%)
Races - Other race alone (% change since 2000)
Racial diversity
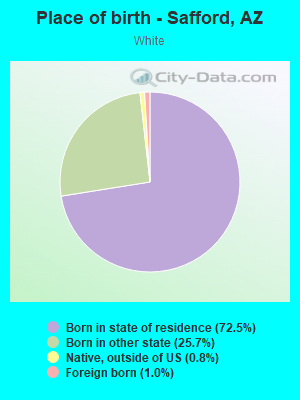
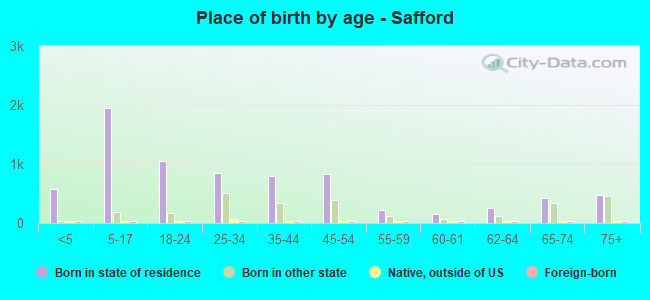
Place of birth - Born in state of residence (%)
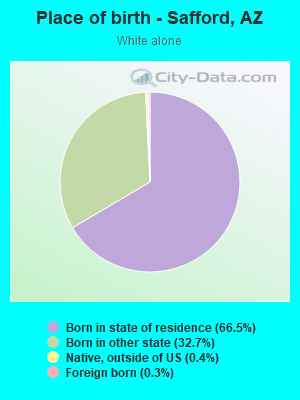
Place of birth - Born in state of residence (%) - White
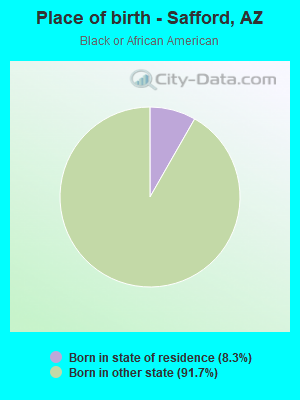
Place of birth - Born in state of residence (%) - Black or African American
Place of birth - Born in state of residence (%) - Asian
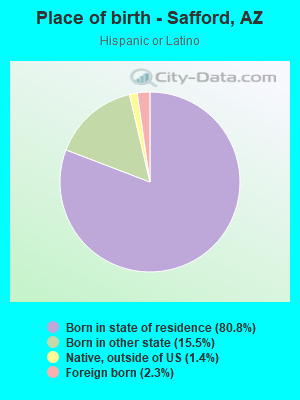
Place of birth - Born in state of residence (%) - Hispanic or Latino
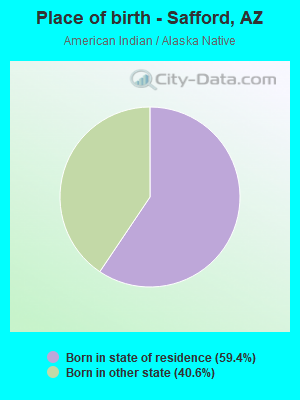
Place of birth - Born in state of residence (%) - American Indian and Alaska Native
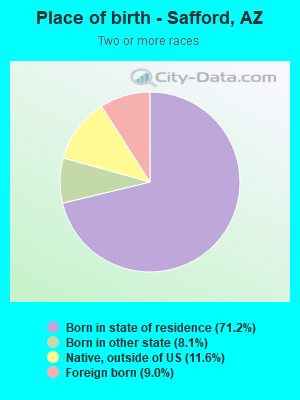
Place of birth - Born in state of residence (%) - Multirace
Place of birth - Born in state of residence (%) - Other Race
Place of birth - Born in other state (%)
Place of birth - Born in other state (%) - White
Place of birth - Born in other state (%) - Black or African American
Place of birth - Born in other state (%) - Asian
Place of birth - Born in other state (%) - Hispanic or Latino
Place of birth - Born in other state (%) - American Indian and Alaska Native
Place of birth - Born in other state (%) - Multirace
Place of birth - Born in other state (%) - Other Race
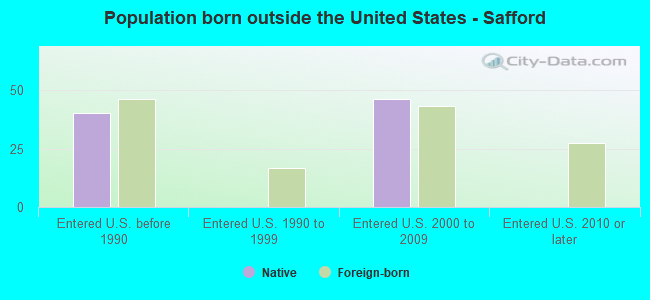
Place of birth - Native, outside of US (%)
Place of birth - Native, outside of US (%) - White
Place of birth - Native, outside of US (%) - Black or African American
Place of birth - Native, outside of US (%) - Asian
Place of birth - Native, outside of US (%) - Hispanic or Latino
Place of birth - Native, outside of US (%) - American Indian and Alaska Native
Place of birth - Native, outside of US (%) - Multirace
Place of birth - Native, outside of US (%) - Other Race
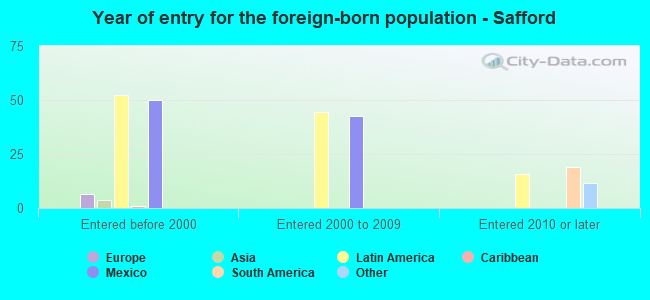
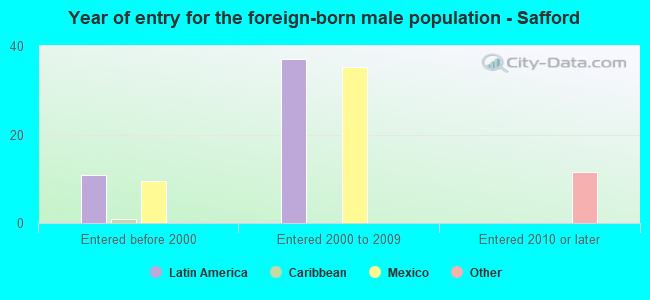
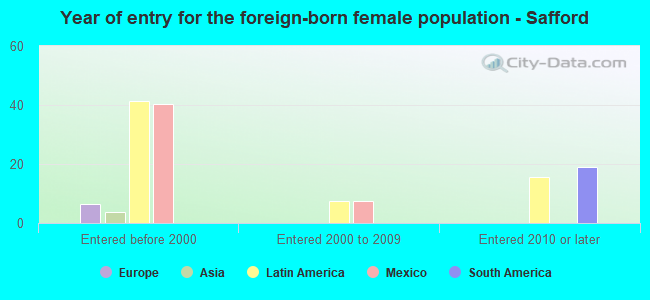
Place of birth - Foreign born (%)
Place of birth - Foreign born (%) - White
Place of birth - Foreign born (%) - Black or African American
Place of birth - Foreign born (%) - Asian
Place of birth - Foreign born (%) - Hispanic or Latino
Place of birth - Foreign born (%) - American Indian and Alaska Native
Place of birth - Foreign born (%) - Multirace
Place of birth - Foreign born (%) - Other Race
Residents speaking English at home (%)
Residents speaking English at home - Born in the United States (%)
Residents speaking English at home - Native, born elsewhere (%)
Residents speaking English at home - Foreign born (%)
Residents speaking Spanish at home (%)
Residents speaking Spanish at home - Born in the United States (%)
Residents speaking Spanish at home - Native, born elsewhere (%)
Residents speaking Spanish at home - Foreign born (%)
Residents speaking other language at home (%)
Residents speaking other language at home - Born in the United States (%)
Residents speaking other language at home - Native, born elsewhere (%)
Residents speaking other language at home - Foreign born (%)
Marital status - Never married (%)
Marital status - Now married (%)
Marital status - Separated (%)
Marital status - Widowed (%)
Marital status - Divorced (%)
Ancestries Reported - Arab (%)
Ancestries Reported - Czech (%)
Ancestries Reported - Danish (%)
Ancestries Reported - Dutch (%)
Ancestries Reported - English (%)
Ancestries Reported - French (%)
Ancestries Reported - French Canadian (%)
Ancestries Reported - German (%)
Ancestries Reported - Greek (%)
Ancestries Reported - Hungarian (%)
Ancestries Reported - Irish (%)
Ancestries Reported - Italian (%)
Ancestries Reported - Lithuanian (%)
Ancestries Reported - Norwegian (%)
Ancestries Reported - Polish (%)
Ancestries Reported - Portuguese (%)
Ancestries Reported - Russian (%)
Ancestries Reported - Scotch-Irish (%)
Ancestries Reported - Scottish (%)
Ancestries Reported - Slovak (%)
Ancestries Reported - Subsaharan African (%)
Ancestries Reported - Swedish (%)
Ancestries Reported - Swiss (%)
Ancestries Reported - Ukrainian (%)
Ancestries Reported - United States (%)
Ancestries Reported - Welsh (%)
Ancestries Reported - West Indian (%)
Ancestries Reported - Other (%)
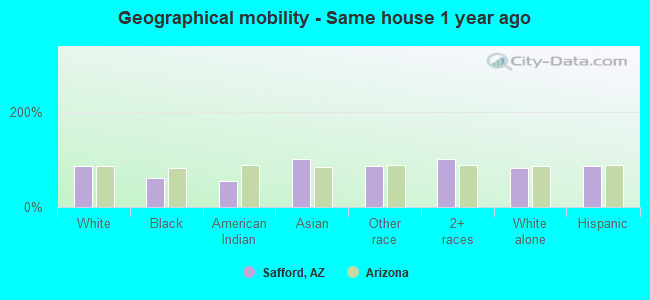
Geographical mobility - Same house 1 year ago (%)
Geographical mobility - Same house 1 year ago (%) - White
Geographical mobility - Same house 1 year ago (%) - Black or African American
Geographical mobility - Same house 1 year ago (%) - Asian
Geographical mobility - Same house 1 year ago (%) - Hispanic or Latino
Geographical mobility - Same house 1 year ago (%) - American Indian and Alaska Native
Geographical mobility - Same house 1 year ago (%) - Multirace
Geographical mobility - Same house 1 year ago (%) - Other Race
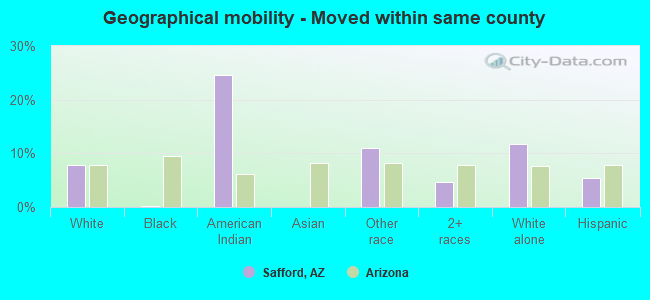
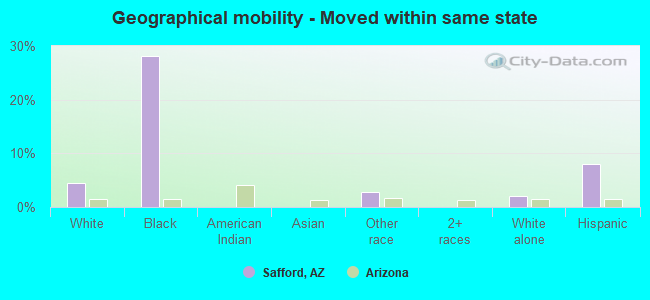
Geographical mobility - Moved within same county (%)
Geographical mobility - Moved within same county (%) - White
Geographical mobility - Moved within same county (%) - Black or African American
Geographical mobility - Moved within same county (%) - Asian
Geographical mobility - Moved within same county (%) - Hispanic or Latino
Geographical mobility - Moved within same county (%) - American Indian and Alaska Native
Geographical mobility - Moved within same county (%) - Multirace
Geographical mobility - Moved within same county (%) - Other Race
Geographical mobility - Moved from different county within same state (%)
Geographical mobility - Moved from different county within same state (%) - White
Geographical mobility - Moved from different county within same state (%) - Black or African American
Geographical mobility - Moved from different county within same state (%) - Asian
Geographical mobility - Moved from different county within same state (%) - Hispanic or Latino
Geographical mobility - Moved from different county within same state (%) - American Indian and Alaska Native
Geographical mobility - Moved from different county within same state (%) - Multirace
Geographical mobility - Moved from different county within same state (%) - Other Race
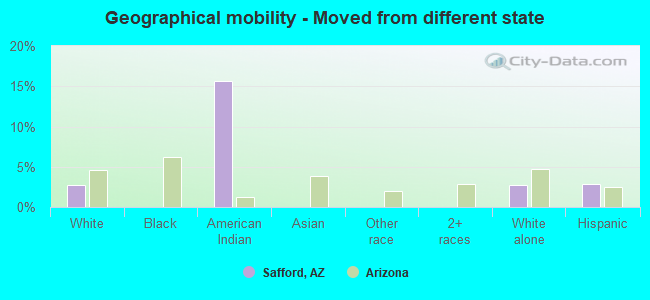
Geographical mobility - Moved from different state (%)
Geographical mobility - Moved from different state (%) - White
Geographical mobility - Moved from different state (%) - Black or African American
Geographical mobility - Moved from different state (%) - Asian
Geographical mobility - Moved from different state (%) - Hispanic or Latino
Geographical mobility - Moved from different state (%) - American Indian and Alaska Native
Geographical mobility - Moved from different state (%) - Multirace
Geographical mobility - Moved from different state (%) - Other Race
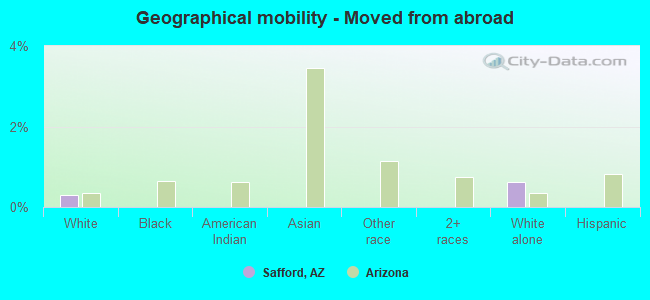
Geographical mobility - Moved from abroad (%)
Geographical mobility - Moved from abroad (%) - White
Geographical mobility - Moved from abroad (%) - Black or African American
Geographical mobility - Moved from abroad (%) - Asian
Geographical mobility - Moved from abroad (%) - Hispanic or Latino
Geographical mobility - Moved from abroad (%) - American Indian and Alaska Native
Geographical mobility - Moved from abroad (%) - Multirace
Geographical mobility - Moved from abroad (%) - Other Race
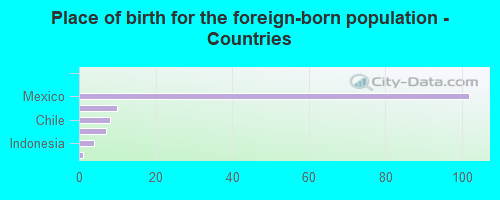
Place of birth for the foreign-born population - Ireland (%)
Place of birth for the foreign-born population - Denmark (%)
Place of birth for the foreign-born population - Norway (%)
Place of birth for the foreign-born population - Sweden (%)
Place of birth for the foreign-born population - United Kingdom (%)
Place of birth for the foreign-born population - England (%)
Place of birth for the foreign-born population - Scotland (%)
Place of birth for the foreign-born population - Other Northern Europe (%)
Place of birth for the foreign-born population - Austria (%)
Place of birth for the foreign-born population - Belgium (%)
Place of birth for the foreign-born population - France (%)
Place of birth for the foreign-born population - Germany (%)
Place of birth for the foreign-born population - Netherlands (%)
Place of birth for the foreign-born population - Switzerland (%)
Place of birth for the foreign-born population - Other Western Europe (%)
Place of birth for the foreign-born population - Greece (%)
Place of birth for the foreign-born population - Italy (%)
Place of birth for the foreign-born population - Portugal (%)
Place of birth for the foreign-born population - Spain (%)
Place of birth for the foreign-born population - Other Southern Europe (%)
Place of birth for the foreign-born population - Albania (%)
Place of birth for the foreign-born population - Belarus (%)
Place of birth for the foreign-born population - Bosnia and Herzegovina (%)
Place of birth for the foreign-born population - Bulgaria (%)
Place of birth for the foreign-born population - Croatia (%)
Place of birth for the foreign-born population - Czechoslovakia (%)
Place of birth for the foreign-born population - Hungary (%)
Place of birth for the foreign-born population - Latvia (%)
Place of birth for the foreign-born population - Lithuania (%)
Place of birth for the foreign-born population - North Macedonia (Macedonia) (%)
Place of birth for the foreign-born population - Moldova (%)
Place of birth for the foreign-born population - Poland (%)
Place of birth for the foreign-born population - Romania (%)
Place of birth for the foreign-born population - Russia (%)
Place of birth for the foreign-born population - Serbia (%)
Place of birth for the foreign-born population - Ukraine (%)
Place of birth for the foreign-born population - Other Eastern Europe (%)
Place of birth for the foreign-born population - China (%)
Place of birth for the foreign-born population - Hong Kong (%)
Place of birth for the foreign-born population - Taiwan (%)
Place of birth for the foreign-born population - Japan (%)
Place of birth for the foreign-born population - Korea (%)
Place of birth for the foreign-born population - Other Eastern Asia (%)
Place of birth for the foreign-born population - Afghanistan (%)
Place of birth for the foreign-born population - Bangladesh (%)
Place of birth for the foreign-born population - India (%)
Place of birth for the foreign-born population - Iran (%)
Place of birth for the foreign-born population - Kazakhstan (%)
Place of birth for the foreign-born population - Nepal (%)
Place of birth for the foreign-born population - Pakistan (%)
Place of birth for the foreign-born population - Sri Lanka (%)
Place of birth for the foreign-born population - Uzbekistan (%)
Place of birth for the foreign-born population - Other South Central Asia (%)
Place of birth for the foreign-born population - Burma (%)
Place of birth for the foreign-born population - Cambodia (%)
Place of birth for the foreign-born population - Indonesia (%)
Place of birth for the foreign-born population - Laos (%)
Place of birth for the foreign-born population - Malaysia (%)
Place of birth for the foreign-born population - Philippines (%)
Place of birth for the foreign-born population - Singapore (%)
Place of birth for the foreign-born population - Thailand (%)
Place of birth for the foreign-born population - Vietnam (%)
Place of birth for the foreign-born population - Other South Eastern Asia (%)
Place of birth for the foreign-born population - Armenia (%)
Place of birth for the foreign-born population - Iraq (%)
Place of birth for the foreign-born population - Israel (%)
Place of birth for the foreign-born population - Jordan (%)
Place of birth for the foreign-born population - Kuwait (%)
Place of birth for the foreign-born population - Lebanon (%)
Place of birth for the foreign-born population - Saudi Arabia (%)
Place of birth for the foreign-born population - Syria (%)
Place of birth for the foreign-born population - Turkey (%)
Place of birth for the foreign-born population - Yemen (%)
Place of birth for the foreign-born population - Other Western Asia (%)
Place of birth for the foreign-born population - Eritrea (%)
Place of birth for the foreign-born population - Ethiopia (%)
Place of birth for the foreign-born population - Kenya (%)
Place of birth for the foreign-born population - Somalia (%)
Place of birth for the foreign-born population - Uganda (%)
Place of birth for the foreign-born population - Zimbabwe (%)
Place of birth for the foreign-born population - Other Eastern Africa (%)
Place of birth for the foreign-born population - Cameroon (%)
Place of birth for the foreign-born population - Congo (%)
Place of birth for the foreign-born population - Democratic Republic of Congo (Zaire) (%)
Place of birth for the foreign-born population - Other Middle Africa (%)
Place of birth for the foreign-born population - Egypt (%)
Place of birth for the foreign-born population - Morocco (%)
Place of birth for the foreign-born population - Sudan (%)
Place of birth for the foreign-born population - Other Northern Africa (%)
Place of birth for the foreign-born population - South Africa (%)
Place of birth for the foreign-born population - Other Southern Africa (%)
Place of birth for the foreign-born population - Cabo Verde (%)
Place of birth for the foreign-born population - Ghana (%)
Place of birth for the foreign-born population - Liberia (%)
Place of birth for the foreign-born population - Nigeria (%)
Place of birth for the foreign-born population - Senegal (%)
Place of birth for the foreign-born population - Sierra Leone (%)
Place of birth for the foreign-born population - Other Western Africa (%)
Place of birth for the foreign-born population - Australia (%)
Place of birth for the foreign-born population - New Zealand (%)
Place of birth for the foreign-born population - Fiji (%)
Place of birth for the foreign-born population - Micronesia (%)
Place of birth for the foreign-born population - Bahamas (%)
Place of birth for the foreign-born population - Barbados (%)
Place of birth for the foreign-born population - Cuba (%)
Place of birth for the foreign-born population - Dominica (%)
Place of birth for the foreign-born population - Dominican Republic (%)
Place of birth for the foreign-born population - Grenada (%)
Place of birth for the foreign-born population - Haiti (%)
Place of birth for the foreign-born population - Jamaica (%)
Place of birth for the foreign-born population - St. Vincent and the Grenadines (%)
Place of birth for the foreign-born population - Trinidad and Tobago (%)
Place of birth for the foreign-born population - West Indies (%)
Place of birth for the foreign-born population - Other Caribbean (%)
Place of birth for the foreign-born population - Belize (%)
Place of birth for the foreign-born population - Costa Rica (%)
Place of birth for the foreign-born population - El Salvador (%)
Place of birth for the foreign-born population - Guatemala (%)
Place of birth for the foreign-born population - Honduras (%)
Place of birth for the foreign-born population - Mexico (%)
Place of birth for the foreign-born population - Nicaragua (%)
Place of birth for the foreign-born population - Panama (%)
Place of birth for the foreign-born population - Other Central America (%)
Place of birth for the foreign-born population - Argentina (%)
Place of birth for the foreign-born population - Bolivia (%)
Place of birth for the foreign-born population - Brazil (%)
Place of birth for the foreign-born population - Chile (%)
Place of birth for the foreign-born population - Colombia (%)
Place of birth for the foreign-born population - Ecuador (%)
Place of birth for the foreign-born population - Guyana (%)
Place of birth for the foreign-born population - Peru (%)
Place of birth for the foreign-born population - Uruguay (%)
Place of birth for the foreign-born population - Venezuela (%)
Place of birth for the foreign-born population - Other South America (%)
Place of birth for the foreign-born population - Canada (%)
Place of birth for the foreign-born population - Other Northern America (%)
Place of birth for the foreign-born population - Other (%)
Latest news about races in Safford, AZ collected exclusively by city-data.com from local newspapers, TV, and radio stations
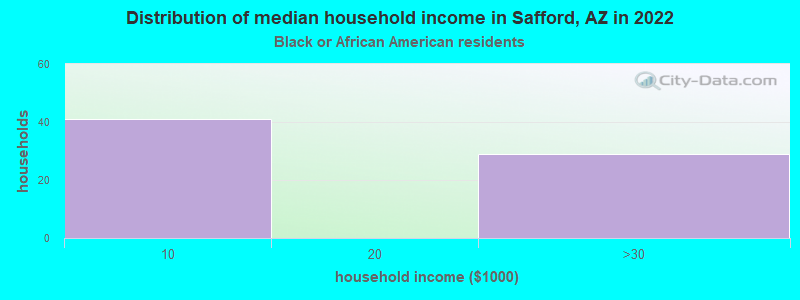
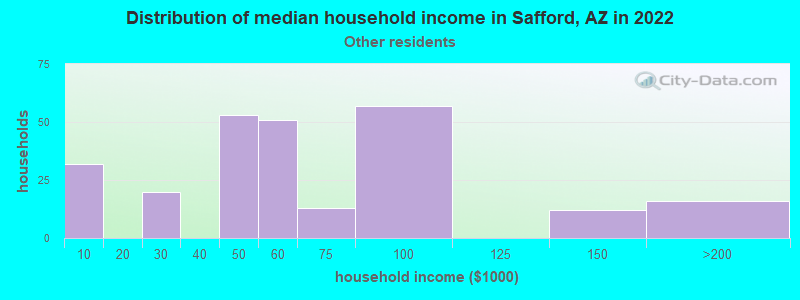
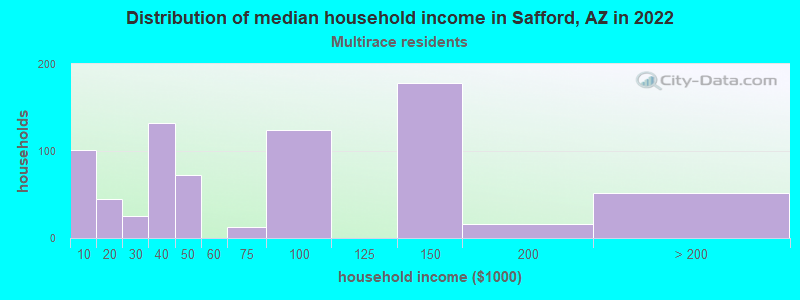
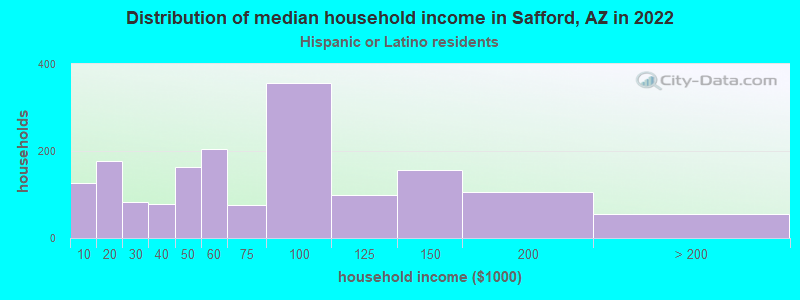
According to 2022 data, the most numerous races in Safford, AZ are White alone (4,766 residents), Hispanic (4,986 residents), and Black alone (372 residents). 85.1% of Safford residents speak English at home. 1.3% of Safford, AZ residents are foreign-born , which is 900.8% less than the foreign-born rate of 13.0% across the entire state of Arizona.
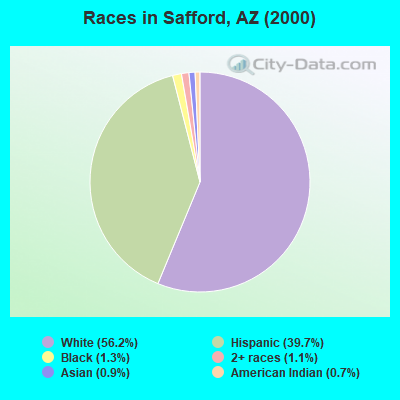
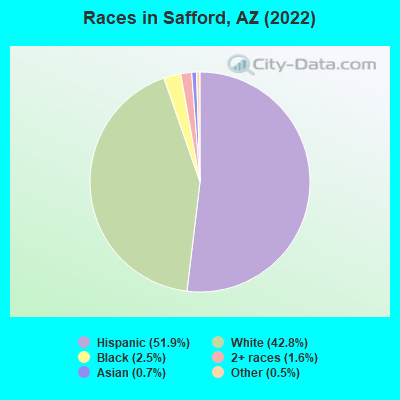
Race distribution in Safford
2000 2022
3,274,258 63.8% White alone 1,295,617 25.3% Hispanic 233,370 4.5% American Indian alone 149,941 2.9% Black alone 89,315 1.7% Asian alone 76,372 1.5% Two or more races 6,120 0.1% Other race alone 5,639 0.1% Native Hawaiian and Other
3,814,587 51.8% White alone 2,388,520 32.5% Hispanic 322,459 4.4% Black alone 284,994 3.9% Two or more races 257,020 3.5% Asian alone 241,688 3.3% American Indian alone 36,042 0.5% Other race alone 13,887 0.2% Native Hawaiian and Other
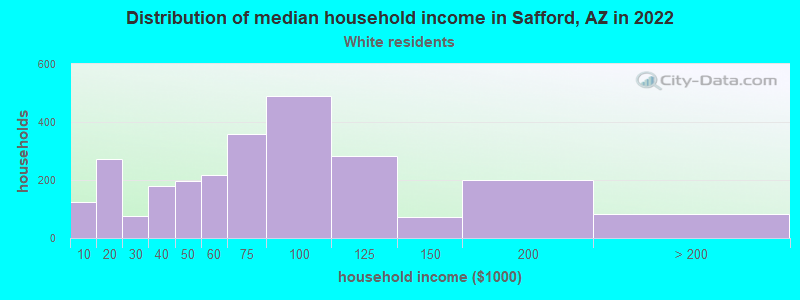
Income and house value in Safford Median household income in 2022 $76,772 White non-Hispanic householders$20,253 Black householders$24,245 American Indian and Alaska Native householders$64,324 Asian householders$86,407 Native Hawaiian and other Pacific Islander householders$77,245 Some other race householders$102,684 Two or more races householders$66,305 Hispanic or Latino race householdersMedian 2022 house value $324,743 White Non-Hispanic householders$396,908 Black or African American householders$276,142 Native Hawaiian and other Pacific Islander householders$282,401 Some other race householders$272,460 Two or more races householders$274,669 Hispanic or Latino householders
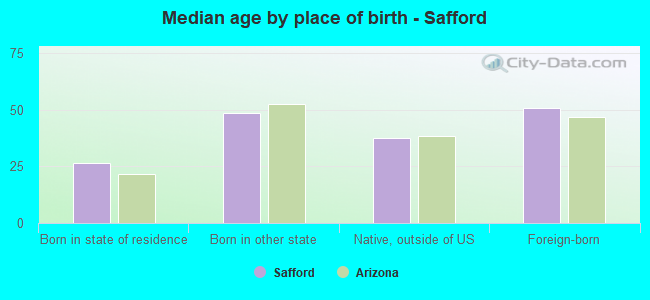
Median age by race in Safford
33.4 Median age for White residents30.3 37.4 51.8 Median age for Black or African American residents52.7 30.4 33.3 Median age for American Indian / Alaska Native residents42.0 33.8 2.8 Median age for Asian residents64.0 Median age for Other race residents64.8 38.1 49.6 Median age for Two or more races residents19.8 59.5 38.0 Median age for White alone residents29.6 44.8 30.2 Median age for Hispanic or Latino residents30.9 29.9
Owner/renter occupied households by race in Safford
House owners and renters - White residents 2,039 68.8% Owner occupied923 31.2% Renter occupiedHouse owners and renters - Black or African American residents 23 12.7% Owner occupied158 87.3% Renter occupiedHouse owners and renters - American Indian / Alaska Native residents 15 100.0% Owner occupiedHouse owners and renters - Other race residents 82 76.8% Owner occupied25 23.2% Renter occupiedHouse owners and renters - Two or more races residents 311 84.1% Owner occupied59 15.9% Renter occupiedHouse owners and renters - White alone residents 1,220 69.2% Owner occupied543 30.8% Renter occupiedHouse owners and renters - Hispanic or Latino residents 1,224 69.7% Owner occupied532 30.3% Renter occupied
Language usage in Safford
English speakers - Total 85.1% of residents of Safford speak English at home.
15.2% of residents speak Spanish at home 1,187 83.8% Speak English very well230 16.2% Speak English less than very well0.3% of residents speak other language at home 4 15.4% Speak English very well22 84.6% Speak English less than very well
English speakers - Born in the United States 85.5% of residents of Safford speak English at home.
14.2% of residents speak Spanish at home 296 80.0% Speak English very well74 20.0% Speak English less than very well0.3% of residents speak other language at home 9 100.0% Speak English less than very well
All residents speak only English at home
English speakers - Foreign-born 13.2% of residents of Safford speak English at home.
84.5% of residents speak Spanish at home 70 64.2% Speak English very well39 35.8% Speak English less than very well3.1% of residents speak other language at home 4 100.0% Speak English very well
White (Caucasian) - Speak only English Native:
89.8% (7,041)Foreign-born:
21.3% (17)
White (Caucasian) - Speak another language Native:
10.1% (791)Foreign-born:
77.3% (61)
Other race - Speak another language Native:
55.1% (135)Foreign-born:
95.2% (13)
Two or more races - Speak another language Native:
48.2% (203)Foreign-born:
100.0% (50)
White alone - Speak only English Native:
99.0% (4,441)Foreign-born:
97.9% (16)
Hispanic or Latino - Speak another language Native:
28.0% (1,314)Foreign-born:
96.7% (108)
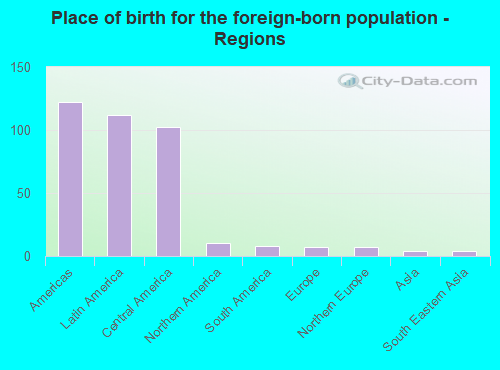
Foreign-born residents in Safford 133 residents are foreign born
This city:
1.3%Arizona:
100.0%
Marital status for residents in Safford Marital status - White (Caucasian) population 15 years and over
Males 44.4% Never married38.6% Now married1.5% Separated4.8% Widowed10.8% DivorcedFemales 30.4% Never married39.0% Now married1.3% Separated10.8% Widowed18.4% DivorcedWomen who gave birth in the past 12 months Now married:
71.0% (43)Unmarried:
29.0% (18)
Women who did not give birth in the past 12 months Now married:
35.2% (668)Unmarried:
64.8% (1,231)
Marital status - Black or African American population 15 years and over
Males 33.5% Never married25.4% Now married0.0% Separated7.1% Widowed33.9% DivorcedFemales 21.7% Never married21.7% Now married0.0% Separated0.0% Widowed56.6% DivorcedWomen who did not give birth in the past 12 months Now married:
0.0% (0)Unmarried:
100.0% (53)
Marital status - American Indian / Alaska Native population 15 years and over
Males 58.3% Never married0.0% Now married30.6% Separated11.1% Widowed0.0% DivorcedFemales 26.7% Never married0.0% Now married0.0% Separated30.0% Widowed43.3% DivorcedWomen who gave birth in the past 12 months Now married:
0.0% (0)Unmarried:
100.0% (8)
Women who did not give birth in the past 12 months Now married:
0.0% (0)Unmarried:
100.0% (13)
Marital status - Other race population 15 years and over
Males 48.1% Never married43.0% Now married0.0% Separated0.0% Widowed8.9% DivorcedFemales 20.4% Never married38.0% Now married0.0% Separated0.0% Widowed41.7% DivorcedWomen who did not give birth in the past 12 months Now married:
18.2% (9)Unmarried:
81.8% (42)
Marital status - Two or more races population 15 years and over
Males 70.6% Never married29.4% Now married0.0% Separated0.0% Widowed0.0% DivorcedFemales 0.0% Never married63.4% Now married0.0% Separated12.7% Widowed23.9% DivorcedWomen who did not give birth in the past 12 months Now married:
83.3% (175)Unmarried:
16.7% (35)
Marital status - White alone, not Hispanic / Latino population 15 years and over
Males 37.0% Never married46.3% Now married2.9% Separated1.8% Widowed12.0% DivorcedFemales 18.0% Never married44.3% Now married0.7% Separated13.4% Widowed23.6% DivorcedWomen who gave birth in the past 12 months Now married:
58.3% (27)Unmarried:
41.7% (19)
Women who did not give birth in the past 12 months Now married:
44.4% (463)Unmarried:
55.6% (579)
Marital status - Hispanic or Latino population 15 years and over
Males 52.6% Never married30.9% Now married0.0% Separated7.3% Widowed9.2% DivorcedFemales 43.1% Never married33.1% Now married1.8% Separated7.2% Widowed14.8% DivorcedWomen who gave birth in the past 12 months Now married:
100.0% (23)Unmarried:
0.0% (0)
Women who did not give birth in the past 12 months Now married:
26.2% (331)Unmarried:
73.8% (933)
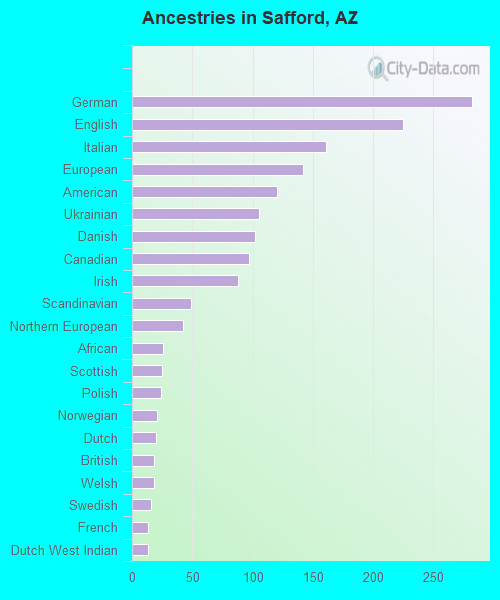
Ancestries in Safford
247 5.5% English194 4.3% European191 4.2% American107 2.4% Irish98 2.2% German89 2.0% Italian79 1.8% Celtic42 0.9% Northern European41 0.9% Scotch-Irish40 0.9% Polish35 0.8% Norwegian25 0.6% French21 0.5% West Indian13 0.3% British11 0.2% Scottish10 0.2% Danish8 0.2% Swedish5 0.1% Canadian4 0.09% Dutch West Indian3 0.07% Dutch
Children Nativity (place of birth) in Safford
Children under 6 years - Living with two parents Both parents native 295 100.0% NativeChildren under 6 years - Living with one parent Native parent 328 100.0% NativeChildren 6 to 17 years - Living with two parents Both parents native 808 100.0% NativeChildren 6 to 17 years - Living with one parent Native parent 850 100.0% NativeForeign-born parent 23 50.3% Native22 49.7% Foreign-born
Grandparents responsible for own grandchildren in Safford
Grandparents (30 to 59 years) White / Caucasian 32 27.9% Responsible for grandchildren83 72.1% Not responsible for grandchildrenWhite alone, not Hispanic / Latino 25 34.3% Responsible for grandchildren49 65.7% Not responsible for grandchildrenHispanic or Latino 12 20.2% Responsible for grandchildren46 79.8% Not responsible for grandchildrenGrandparents (60 years and over) White / Caucasian 31 30.7% Responsible for grandchildren70 69.3% Not responsible for grandchildrenWhite alone, not Hispanic / Latino 19 100.0% Not responsible for grandchildrenHispanic or Latino 37 33.6% Responsible for grandchildren74 66.4% Not responsible for grandchildren