Races in Saline, Michigan (MI) Detailed Stats
Ancestries, Foreign-born residents, place of birth
Settings
X


Recent posts about races in Saline, Michigan on our local forum with over 2,400,000 registered users:
 | Inequality in Washtenaw County (9 replies) |
| Which area I should look for apartments in Ann Arbor? (7 replies) |
| Is A2 right for our family? (13 replies) |
| Saline vs South Lyon for small town feel? (15 replies) |
| Colorado to Michigan (75 replies) |
| Moving to Ann Arbor Area from Colorado (23 replies) |
Latest news about races in Saline, MI collected exclusively by city-data.com from local newspapers, TV, and radio stations
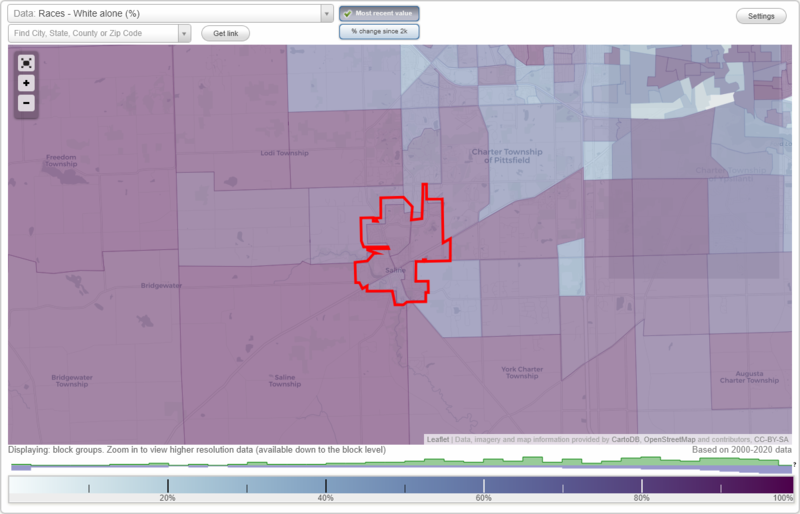
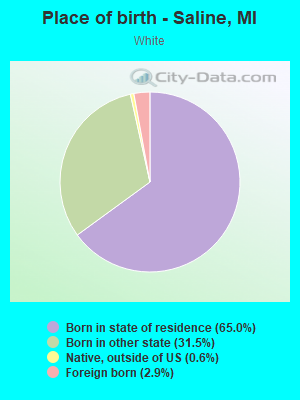
According to 2022 data, the most numerous races in Saline, MI are White alone (7,578 residents), Black alone (127 residents), and Hispanic (306 residents). 92.9% of Saline residents speak English at home. 6.2% of Saline, MI residents are foreign-born (2.8% born in Asia, 1.7% born in Europe, 1.3% born in Latin America), which is 3.3% greater than the foreign-born rate of 6.0% across the entire state of Michigan.
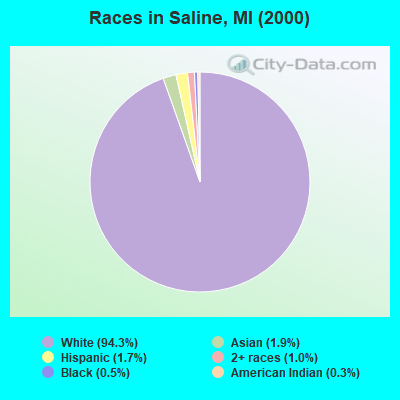
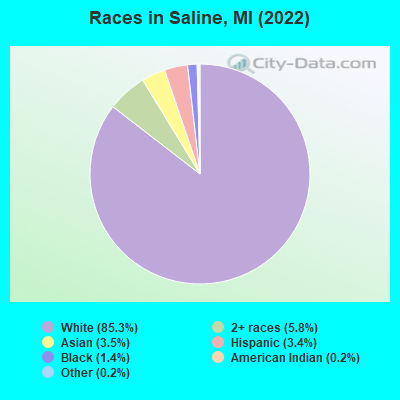
Race distribution in Saline
2000
2022

- 7,58094.3%White alone
- 1551.9%Asian alone
- 1391.7%Hispanic
- 801.0%Two or more races
- 440.5%Black alone
- 250.3%American Indian alone
- 70.09%Other race alone
- 40.05%Native Hawaiian and Other
Pacific Islander alone
-
- 7,57885.3%White alone
- 5195.8%Two or more races
- 3153.5%Asian alone
- 3063.4%Hispanic
- 1271.4%Black alone
- 220.2%Other race alone
- 220.2%American Indian alone
2000
2022
-
- 7,806,69178.6%White alone
- 1,402,04714.1%Black alone
- 323,8773.3%Hispanic
- 175,3111.8%Asian alone
- 163,4871.6%Two or more races
- 53,4210.5%American Indian alone
- 11,4650.1%Other race alone
- 2,1450.02%Native Hawaiian and Other
Pacific Islander alone

-
- 7,289,05172.6%White alone
- 1,310,46413.1%Black alone
- 572,4055.7%Hispanic
- 450,0314.5%Two or more races
- 335,7323.3%Asian alone
- 45,2170.5%Other race alone
- 29,0110.3%American Indian alone
- 2,2070.02%Native Hawaiian and Other
Pacific Islander alone

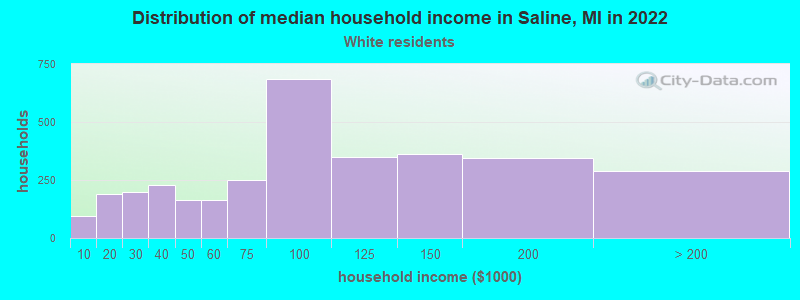
Income and house value in Saline
- Median household income in 2022
- $83,974White non-Hispanic householders
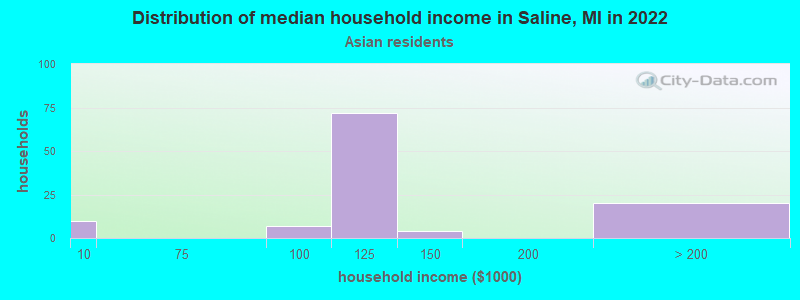
- $143,843Asian householders
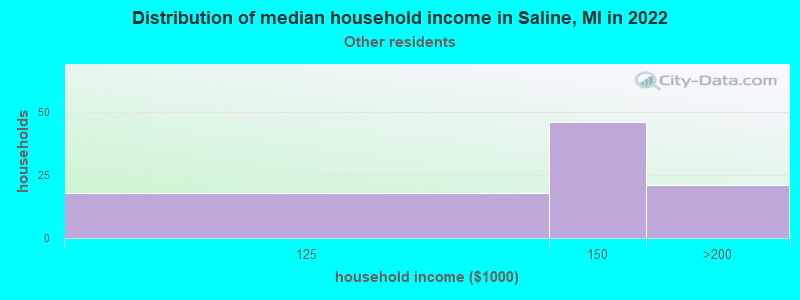
- $135,282Some other race householders
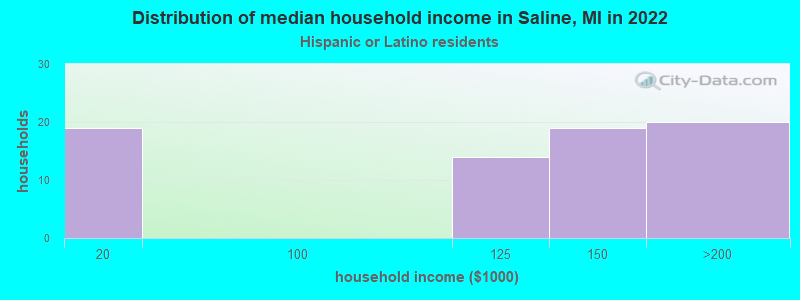
- $154,111Hispanic or Latino race householders
- Median 2022 house value
- $335,683White Non-Hispanic householders
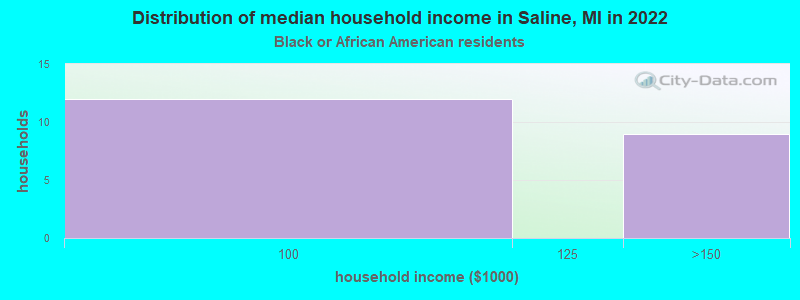
- $319,184Black or African American householders
- $166,957American Indian or Alaska Native householders
- $301,702Asian householders
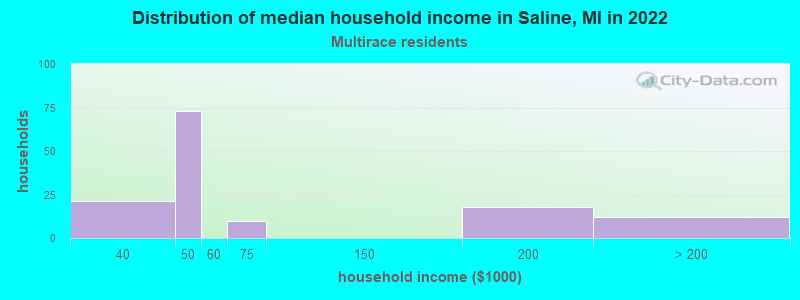
- $260,061Two or more races householders
- $248,865Hispanic or Latino householders
Household income for White non-Hispanic householders
Household income for Black householders
Household income for Asian householders
Household income for Some other race householders
Household income for Two or more races householders
Household income for Hispanic or Latino race householders
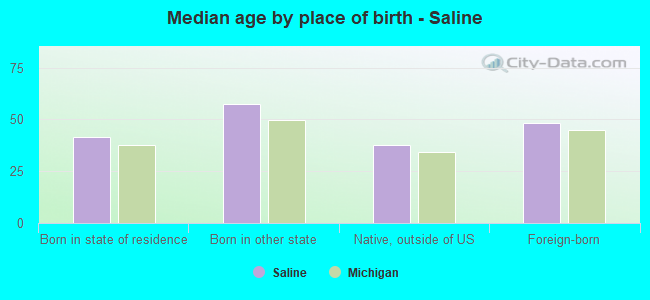
Median age by race in Saline
- 49.5Median age for White residents
- 47.0Males
- 51.2Females
- 40.5Median age for Black or African American residents
- 47.7Males
- 42.8Females
- 7.5Median age for American Indian / Alaska Native residents
- -797,507,787.4Males
- -711,442,785.4Females
- 40.8Median age for Asian residents
- 48.8Males
- 31.3Females
- -670,531,400.3Median age for Native Hawaiian / Pacific Islander residents
- -674,772,035.8Males
- -699,588,476.7Females
- 52.4Median age for Other race residents
- 60.3Males
- -704,704,704.0Females
- 13.9Median age for Two or more races residents
- 10.9Males
- 16.5Females
- 49.5Median age for White alone residents
- 47.5Males
- 51.3Females
- 30.4Median age for Hispanic or Latino residents
- 31.0Males
- 3.7Females
Owner/renter occupied households by race in Saline
- House owners and renters - White residents
- 2,44272.0%Owner occupied
- 94728.0%Renter occupied
- House owners and renters - Black or African American residents
- 1238.6%Owner occupied
- 1961.4%Renter occupied
- House owners and renters - American Indian / Alaska Native residents
- 21100.0%Owner occupied
- House owners and renters - Asian residents
- 9492.2%Owner occupied
- 87.8%Renter occupied
- House owners and renters - Other race residents
- 106100.0%Owner occupied
- House owners and renters - Two or more races residents
- 4833.3%Owner occupied
- 9566.7%Renter occupied
- House owners and renters - White alone residents
- 2,44371.6%Owner occupied
- 96928.4%Renter occupied
- House owners and renters - Hispanic or Latino residents
- 103100.0%Owner occupied
Language usage in Saline
- English speakers - Total
- 92.9% of residents of Saline speak English at home.
- 0.4% of residents speak Spanish at home
- 36100.0%Speak English very well
- 6.3% of residents speak other language at home
- 37571.7%Speak English very well
- 14828.3%Speak English less than very well
- English speakers - Born in the United States
- 98.3% of residents of Saline speak English at home.
- 0.7% of residents speak Spanish at home
- 19100.0%Speak English very well
- 0.8% of residents speak other language at home
- 628.6%Speak English very well
- 1571.4%Speak English less than very well
- English speakers - Native, born elsewhere
- 57.6% of residents of Saline speak English at home.
- 25.0% of residents speak other language at home
- 23100.0%Speak English very well
- English speakers - Foreign-born
- 27.6% of residents of Saline speak English at home.
- 2.3% of residents speak Spanish at home
- 12100.0%Speak English very well
- 67.0% of residents speak other language at home
- 21962.8%Speak English very well
- 13037.2%Speak English less than very well
White (Caucasian) - Speak only English
| Native: | 98.7% (6,856) |
| Foreign-born: | 45.5% (99) |
White (Caucasian) - Speak another language
| Native: | 1.4% (100) |
| Foreign-born: | 54.1% (118) |
Asian - Speak only English
| Native: | 38.0% (41) |
| Foreign-born: | 7.1% (13) |
Asian - Speak another language
| Native: | 63.5% (68) |
| Foreign-born: | 95.1% (168) |
Other race - Speak only English
| Native: | 100.0% (69) |
| Foreign-born: | 73.6% (37) |
Two or more races - Speak another language
| Native: | 6.1% (30) |
| Foreign-born: | 100.0% (88) |
White alone - Speak only English
| Native: | 98.3% (6,857) |
| Foreign-born: | 40.6% (94) |
White alone - Speak another language
| Native: | 1.6% (113) |
| Foreign-born: | 58.3% (136) |
Hispanic or Latino - Speak only English
| Native: | 97.2% (76) |
| Foreign-born: | 34.8% (36) |
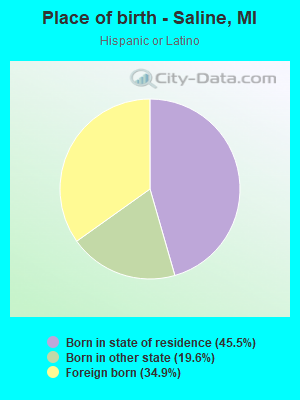
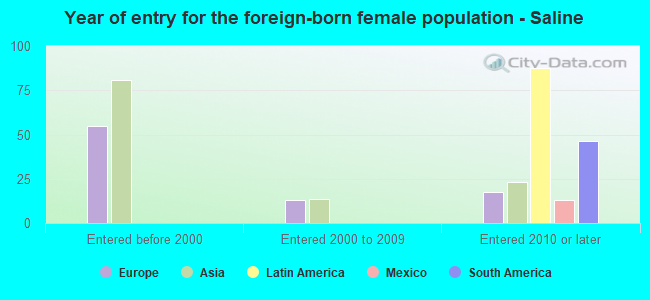
Foreign-born residents in Saline
551 residents are foreign born (2.8% Asia, 1.7% Europe, 1.3% Latin America).
| This city: | 6.2% |
| Michigan: | 6.9% |

Marital status for residents in Saline
Marital status - White (Caucasian) population 15 years and over
- Males
- 33.7%Never married
- 57.5%Now married
- 0.6%Separated
- 2.5%Widowed
- 5.7%Divorced
- Females
- 22.9%Never married
- 53.3%Now married
- 0.0%Separated
- 9.4%Widowed
- 14.3%Divorced
Women who gave birth in the past 12 months
| Now married: | 100.0% (71) |
| Unmarried: | 0.0% (0) |
Women who did not give birth in the past 12 months
| Now married: | 45.0% (609) |
| Unmarried: | 55.0% (744) |
Marital status - Black or African American population 15 years and over
- Males
- 54.0%Never married
- 38.1%Now married
- 7.9%Separated
- 0.0%Widowed
- 0.0%Divorced
- Females
- 37.5%Never married
- 20.8%Now married
- 0.0%Separated
- 11.1%Widowed
- 30.6%Divorced
Women who did not give birth in the past 12 months
| Now married: | 30.0% (14) |
| Unmarried: | 70.0% (32) |
Marital status - American Indian / Alaska Native population 15 years and over
- Males
- 0.0%Never married
- 100.0%Now married
- 0.0%Separated
- 0.0%Widowed
- 0.0%Divorced
- Females
- 0.0%Never married
- 100.0%Now married
- 0.0%Separated
- 0.0%Widowed
- 0.0%Divorced
Marital status - Asian population 15 years and over
- Males
- 19.2%Never married
- 80.8%Now married
- 0.0%Separated
- 0.0%Widowed
- 0.0%Divorced
- Females
- 35.4%Never married
- 64.6%Now married
- 0.0%Separated
- 0.0%Widowed
- 0.0%Divorced
Women who gave birth in the past 12 months
| Now married: | 100.0% (31) |
| Unmarried: | 0.0% (0) |
Women who did not give birth in the past 12 months
| Now married: | 36.4% (23) |
| Unmarried: | 63.6% (40) |
Marital status - Other race population 15 years and over
- Males
- 73.2%Never married
- 26.8%Now married
- 0.0%Separated
- 0.0%Widowed
- 0.0%Divorced
- Females
- 0.0%Never married
- 100.0%Now married
- 0.0%Separated
- 0.0%Widowed
- 0.0%Divorced
Women who did not give birth in the past 12 months
| Now married: | 100.0% (16) |
| Unmarried: | 0.0% (0) |
Marital status - Two or more races population 15 years and over
- Males
- 75.9%Never married
- 12.8%Now married
- 0.0%Separated
- 0.0%Widowed
- 11.3%Divorced
- Females
- 8.0%Never married
- 78.8%Now married
- 0.0%Separated
- 3.6%Widowed
- 9.5%Divorced
Women who gave birth in the past 12 months
| Now married: | 100.0% (49) |
| Unmarried: | 0.0% (0) |
Women who did not give birth in the past 12 months
| Now married: | 86.4% (91) |
| Unmarried: | 13.6% (14) |
Marital status - White alone, not Hispanic / Latino population 15 years and over
- Males
- 34.0%Never married
- 57.2%Now married
- 0.6%Separated
- 2.5%Widowed
- 5.7%Divorced
- Females
- 22.9%Never married
- 53.3%Now married
- 0.0%Separated
- 9.4%Widowed
- 14.3%Divorced
Women who gave birth in the past 12 months
| Now married: | 100.0% (72) |
| Unmarried: | 0.0% (0) |
Women who did not give birth in the past 12 months
| Now married: | 45.0% (616) |
| Unmarried: | 55.0% (754) |
Marital status - Hispanic or Latino population 15 years and over
- Males
- 57.1%Never married
- 42.9%Now married
- 0.0%Separated
- 0.0%Widowed
- 0.0%Divorced
- Females
- 0.0%Never married
- 100.0%Now married
- 0.0%Separated
- 0.0%Widowed
- 0.0%Divorced
Women who gave birth in the past 12 months
| Now married: | 100.0% (40) |
| Unmarried: | 0.0% (0) |
Women who did not give birth in the past 12 months
| Now married: | 100.0% (27) |
| Unmarried: | 0.0% (0) |
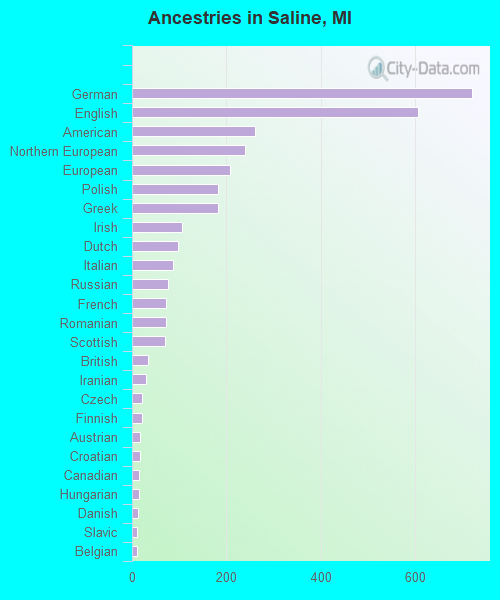
Ancestries in Saline

- 72119.6%German
- 60616.5%English
- 2617.1%American
- 2406.5%Northern European
- 2075.6%European
- 1835.0%Polish
- 1824.9%Greek
- 1062.9%Irish
- 972.6%Dutch
- 862.3%Italian
- 762.1%Russian
- 732.0%French
- 722.0%Romanian
- 711.9%Scottish
- 330.9%British
- 290.8%Iranian
- 210.6%Czech
- 210.6%Finnish
- 180.5%Austrian
- 160.4%Croatian
- 140.4%Canadian
- 140.4%Hungarian
- 130.4%Danish
- 110.3%Slavic
- 100.3%Belgian
- 100.3%Norwegian
- 80.2%Brazilian
- 80.2%Swedish
- 60.2%Scotch-Irish
- 50.1%Slovak
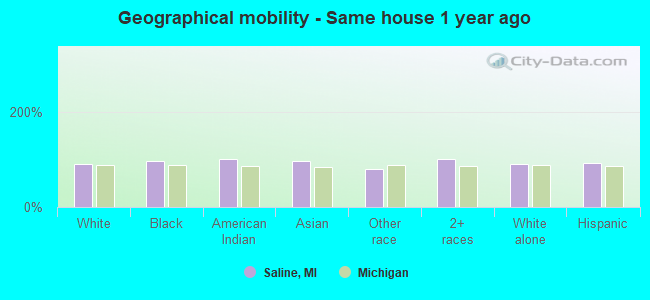
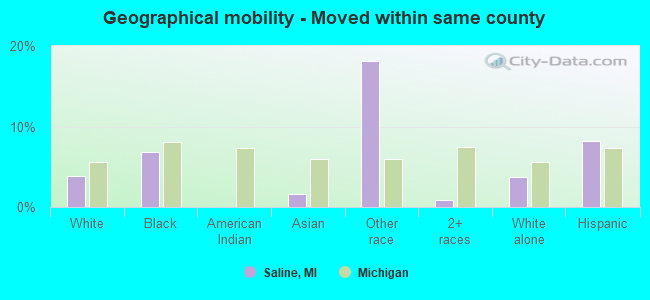
Geographical mobility in Saline

- Same house 1 year ago
- 6,74589.7%White (Caucasian)
- 12496.6%Black or African American
- 36100.0%American Indian / Alaska Native
- 30697.3%Asian
- 9480.4%Other race
- 70299.6%Two or more races
- 6,78789.8%White alone, not Hispanic / Latino
- 25392.0%Hispanic or Latino
-
- Moved within same county
- 2913.9%White / Caucasian
- 96.9%Black or African American
- 51.7%Asian
- 2118.2%Other race
- 60.8%Two or more races
- 2853.8%White alone, not Hispanic / Latino
- 228.2%Hispanic or Latino
-
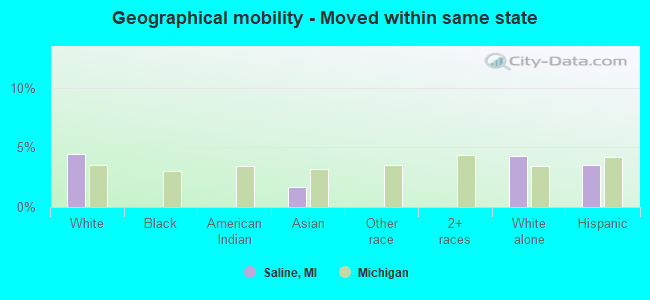
- Moved within same state
- 3364.5%White / Caucasian
- 51.7%Asian
- 3254.3%White alone, not Hispanic / Latino
- 103.5%Hispanic or Latino
-
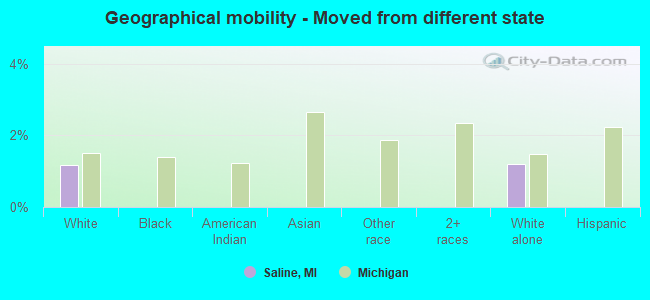
- Moved from different state
- 871.2%White / Caucasian
- 911.2%White alone, not Hispanic / Latino
-
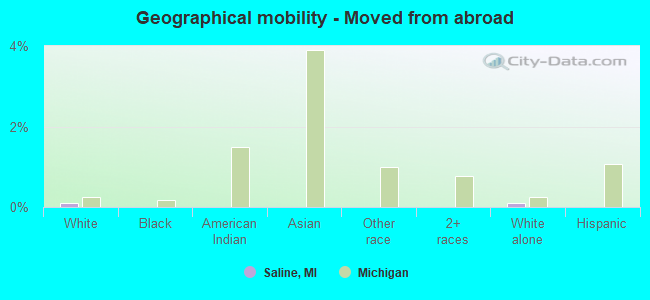
- Moved from abroad
- 80.1%White
- 80.1%White alone, not Hispanic / Latino
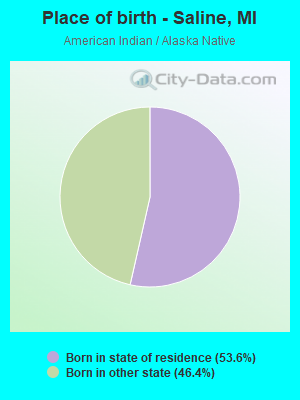
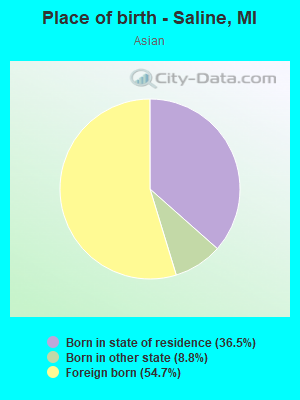
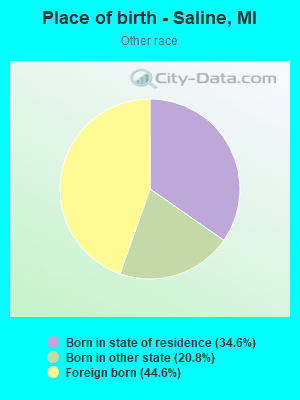
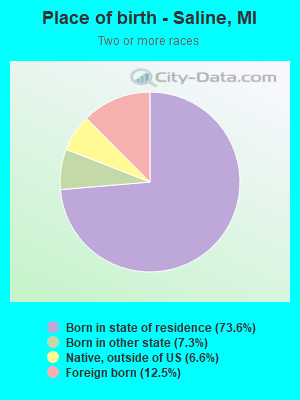
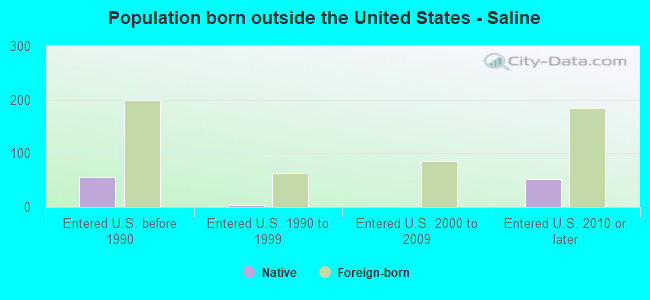
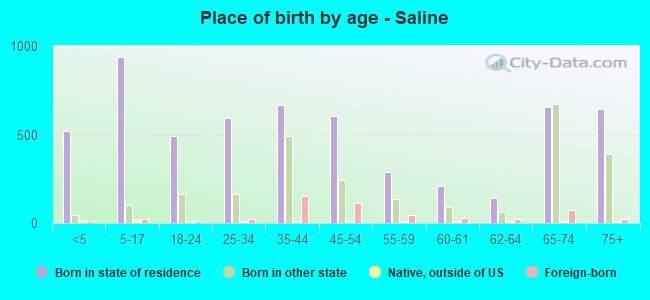
Children Nativity (place of birth) in Saline
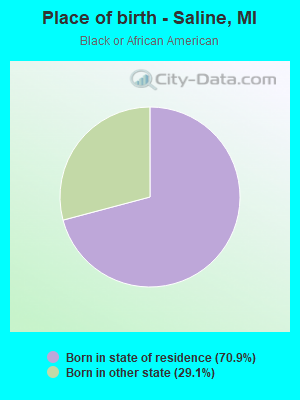
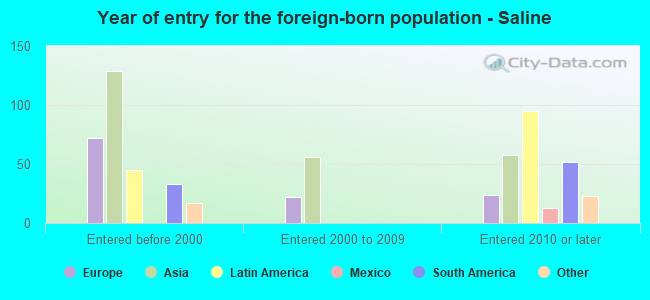
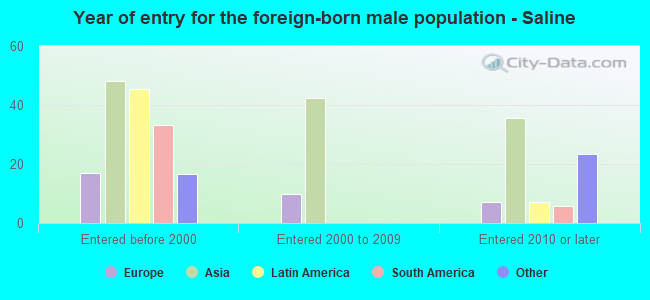
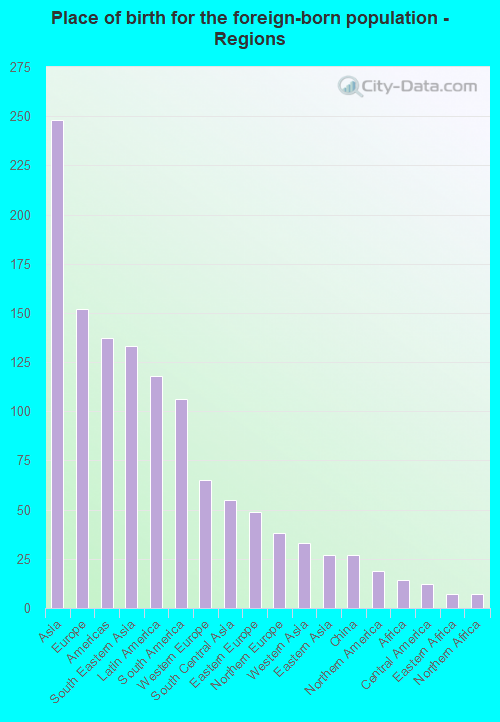
Place of birth for residents in Saline
![Place of birth for the foreign-born population - Regions]()
- 248Asia
- 152Europe
- 137Americas
- 133South Eastern Asia
- 118Latin America
- 106South America
- 65Western Europe
- 55South Central Asia
- 49Eastern Europe
- 38Northern Europe
- 33Western Asia
- 27Eastern Asia
- 27China
- 19Northern America
- 14Africa
- 12Central America
- 7Eastern Africa
- 7Northern Africa
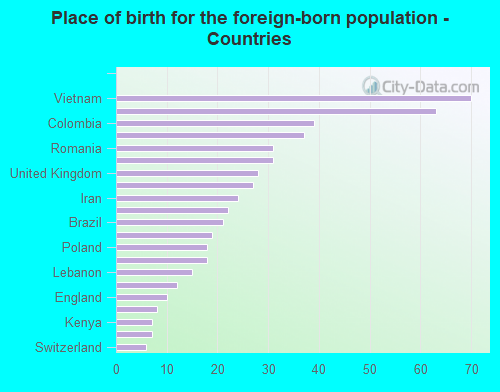
![Place of birth for the foreign-born population - Countries]()
- 70Vietnam
- 63Philippines
- 39Colombia
- 37Netherlands
- 31Romania
- 31India
- 28United Kingdom
- 27China
- 24Iran
- 22Germany
- 21Brazil
- 19Canada
- 18Poland
- 18Iraq
- 15Lebanon
- 12Mexico
- 10England
- 8Venezuela
- 7Kenya
- 7Algeria
- 6Switzerland
Zip codes: 48176.