Races in San Rafael, California (CA) Detailed Stats
Data:
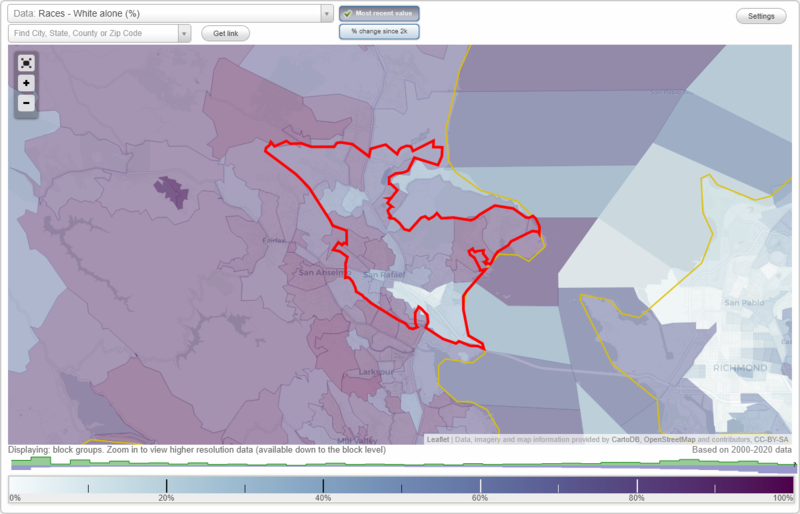
Races - White alone (%)
Races - White alone (% change since 2000)
Races - Black alone (%)
Races - Black alone (% change since 2000)
Races - American Indian alone (%)
Races - American Indian alone (% change since 2000)
Races - Asian alone (%)
Races - Asian alone (% change since 2000)
Races - Hispanic (%)
Races - Hispanic (% change since 2000)
Races - Native Hawaiian and Other Pacific Islander alone (%)
Races - Native Hawaiian and Other Pacific Islander alone (% change since 2000)
Races - Two or more races(%)
Races - Two or more races(% change since 2000)
Races - Other race alone (%)
Races - Other race alone (% change since 2000)
Racial diversity
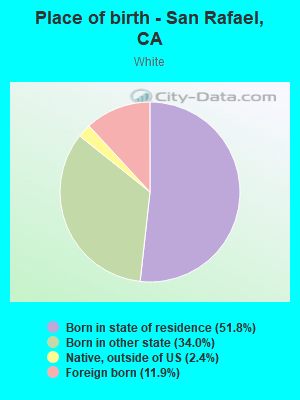
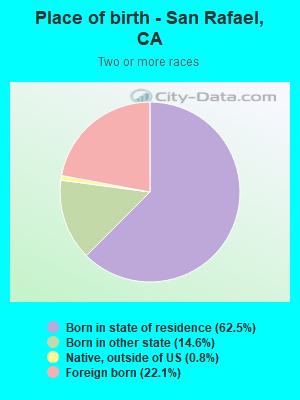
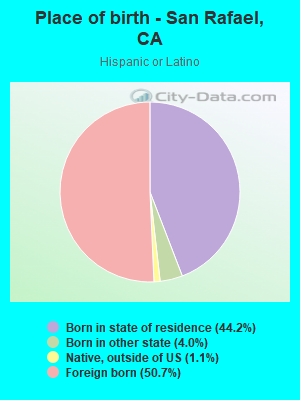
Place of birth - Born in state of residence (%)
Place of birth - Born in state of residence (%) - White
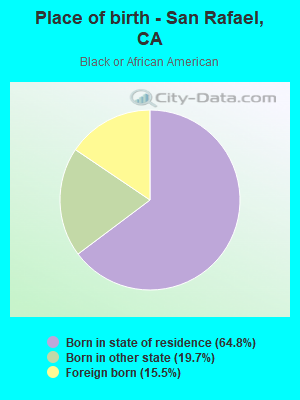
Place of birth - Born in state of residence (%) - Black or African American
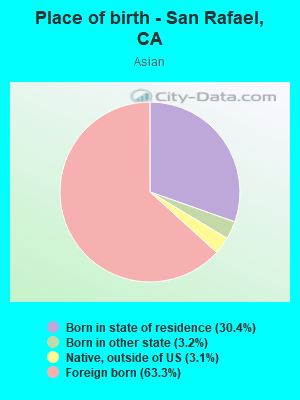
Place of birth - Born in state of residence (%) - Asian
Place of birth - Born in state of residence (%) - Hispanic or Latino
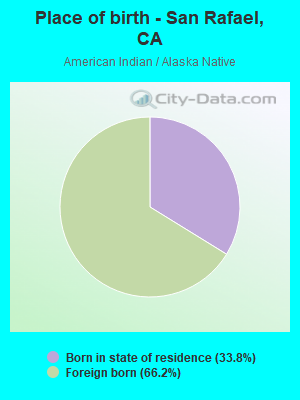
Place of birth - Born in state of residence (%) - American Indian and Alaska Native
Place of birth - Born in state of residence (%) - Multirace
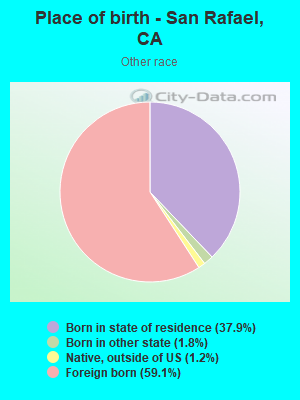
Place of birth - Born in state of residence (%) - Other Race
Place of birth - Born in other state (%)
Place of birth - Born in other state (%) - White
Place of birth - Born in other state (%) - Black or African American
Place of birth - Born in other state (%) - Asian
Place of birth - Born in other state (%) - Hispanic or Latino
Place of birth - Born in other state (%) - American Indian and Alaska Native
Place of birth - Born in other state (%) - Multirace
Place of birth - Born in other state (%) - Other Race
Place of birth - Native, outside of US (%)
Place of birth - Native, outside of US (%) - White
Place of birth - Native, outside of US (%) - Black or African American
Place of birth - Native, outside of US (%) - Asian
Place of birth - Native, outside of US (%) - Hispanic or Latino
Place of birth - Native, outside of US (%) - American Indian and Alaska Native
Place of birth - Native, outside of US (%) - Multirace
Place of birth - Native, outside of US (%) - Other Race
Place of birth - Foreign born (%)
Place of birth - Foreign born (%) - White
Place of birth - Foreign born (%) - Black or African American
Place of birth - Foreign born (%) - Asian
Place of birth - Foreign born (%) - Hispanic or Latino
Place of birth - Foreign born (%) - American Indian and Alaska Native
Place of birth - Foreign born (%) - Multirace
Place of birth - Foreign born (%) - Other Race
Residents speaking English at home (%)
Residents speaking English at home - Born in the United States (%)
Residents speaking English at home - Native, born elsewhere (%)
Residents speaking English at home - Foreign born (%)
Residents speaking Spanish at home (%)
Residents speaking Spanish at home - Born in the United States (%)
Residents speaking Spanish at home - Native, born elsewhere (%)
Residents speaking Spanish at home - Foreign born (%)
Residents speaking other language at home (%)
Residents speaking other language at home - Born in the United States (%)
Residents speaking other language at home - Native, born elsewhere (%)
Residents speaking other language at home - Foreign born (%)
Marital status - Never married (%)
Marital status - Now married (%)
Marital status - Separated (%)
Marital status - Widowed (%)
Marital status - Divorced (%)
Ancestries Reported - Arab (%)
Ancestries Reported - Czech (%)
Ancestries Reported - Danish (%)
Ancestries Reported - Dutch (%)
Ancestries Reported - English (%)
Ancestries Reported - French (%)
Ancestries Reported - French Canadian (%)
Ancestries Reported - German (%)
Ancestries Reported - Greek (%)
Ancestries Reported - Hungarian (%)
Ancestries Reported - Irish (%)
Ancestries Reported - Italian (%)
Ancestries Reported - Lithuanian (%)
Ancestries Reported - Norwegian (%)
Ancestries Reported - Polish (%)
Ancestries Reported - Portuguese (%)
Ancestries Reported - Russian (%)
Ancestries Reported - Scotch-Irish (%)
Ancestries Reported - Scottish (%)
Ancestries Reported - Slovak (%)
Ancestries Reported - Subsaharan African (%)
Ancestries Reported - Swedish (%)
Ancestries Reported - Swiss (%)
Ancestries Reported - Ukrainian (%)
Ancestries Reported - United States (%)
Ancestries Reported - Welsh (%)
Ancestries Reported - West Indian (%)
Ancestries Reported - Other (%)
Geographical mobility - Same house 1 year ago (%)
Geographical mobility - Same house 1 year ago (%) - White
Geographical mobility - Same house 1 year ago (%) - Black or African American
Geographical mobility - Same house 1 year ago (%) - Asian
Geographical mobility - Same house 1 year ago (%) - Hispanic or Latino
Geographical mobility - Same house 1 year ago (%) - American Indian and Alaska Native
Geographical mobility - Same house 1 year ago (%) - Multirace
Geographical mobility - Same house 1 year ago (%) - Other Race
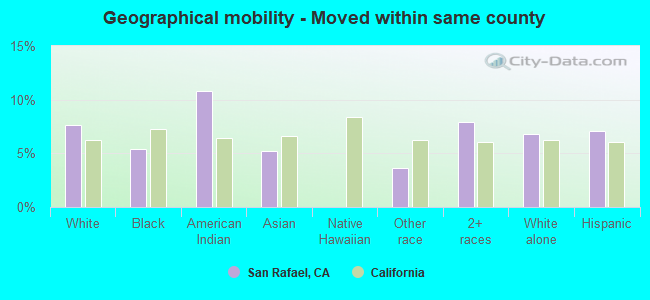
Geographical mobility - Moved within same county (%)
Geographical mobility - Moved within same county (%) - White
Geographical mobility - Moved within same county (%) - Black or African American
Geographical mobility - Moved within same county (%) - Asian
Geographical mobility - Moved within same county (%) - Hispanic or Latino
Geographical mobility - Moved within same county (%) - American Indian and Alaska Native
Geographical mobility - Moved within same county (%) - Multirace
Geographical mobility - Moved within same county (%) - Other Race
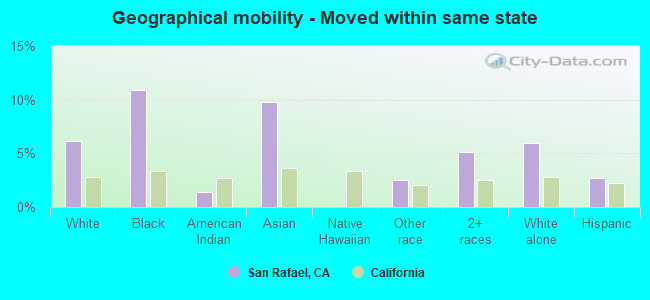
Geographical mobility - Moved from different county within same state (%)
Geographical mobility - Moved from different county within same state (%) - White
Geographical mobility - Moved from different county within same state (%) - Black or African American
Geographical mobility - Moved from different county within same state (%) - Asian
Geographical mobility - Moved from different county within same state (%) - Hispanic or Latino
Geographical mobility - Moved from different county within same state (%) - American Indian and Alaska Native
Geographical mobility - Moved from different county within same state (%) - Multirace
Geographical mobility - Moved from different county within same state (%) - Other Race
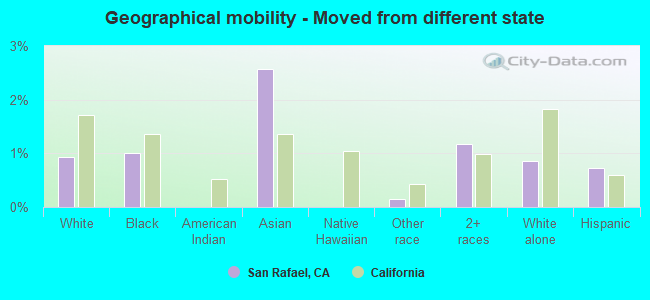
Geographical mobility - Moved from different state (%)
Geographical mobility - Moved from different state (%) - White
Geographical mobility - Moved from different state (%) - Black or African American
Geographical mobility - Moved from different state (%) - Asian
Geographical mobility - Moved from different state (%) - Hispanic or Latino
Geographical mobility - Moved from different state (%) - American Indian and Alaska Native
Geographical mobility - Moved from different state (%) - Multirace
Geographical mobility - Moved from different state (%) - Other Race
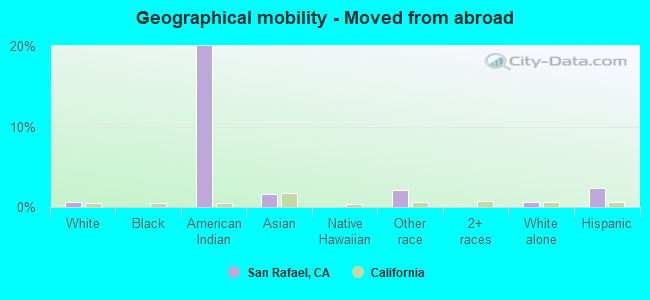
Geographical mobility - Moved from abroad (%)
Geographical mobility - Moved from abroad (%) - White
Geographical mobility - Moved from abroad (%) - Black or African American
Geographical mobility - Moved from abroad (%) - Asian
Geographical mobility - Moved from abroad (%) - Hispanic or Latino
Geographical mobility - Moved from abroad (%) - American Indian and Alaska Native
Geographical mobility - Moved from abroad (%) - Multirace
Geographical mobility - Moved from abroad (%) - Other Race
Place of birth for the foreign-born population - Ireland (%)
Place of birth for the foreign-born population - Denmark (%)
Place of birth for the foreign-born population - Norway (%)
Place of birth for the foreign-born population - Sweden (%)
Place of birth for the foreign-born population - United Kingdom (%)
Place of birth for the foreign-born population - England (%)
Place of birth for the foreign-born population - Scotland (%)
Place of birth for the foreign-born population - Other Northern Europe (%)
Place of birth for the foreign-born population - Austria (%)
Place of birth for the foreign-born population - Belgium (%)
Place of birth for the foreign-born population - France (%)
Place of birth for the foreign-born population - Germany (%)
Place of birth for the foreign-born population - Netherlands (%)
Place of birth for the foreign-born population - Switzerland (%)
Place of birth for the foreign-born population - Other Western Europe (%)
Place of birth for the foreign-born population - Greece (%)
Place of birth for the foreign-born population - Italy (%)
Place of birth for the foreign-born population - Portugal (%)
Place of birth for the foreign-born population - Spain (%)
Place of birth for the foreign-born population - Other Southern Europe (%)
Place of birth for the foreign-born population - Albania (%)
Place of birth for the foreign-born population - Belarus (%)
Place of birth for the foreign-born population - Bosnia and Herzegovina (%)
Place of birth for the foreign-born population - Bulgaria (%)
Place of birth for the foreign-born population - Croatia (%)
Place of birth for the foreign-born population - Czechoslovakia (%)
Place of birth for the foreign-born population - Hungary (%)
Place of birth for the foreign-born population - Latvia (%)
Place of birth for the foreign-born population - Lithuania (%)
Place of birth for the foreign-born population - North Macedonia (Macedonia) (%)
Place of birth for the foreign-born population - Moldova (%)
Place of birth for the foreign-born population - Poland (%)
Place of birth for the foreign-born population - Romania (%)
Place of birth for the foreign-born population - Russia (%)
Place of birth for the foreign-born population - Serbia (%)
Place of birth for the foreign-born population - Ukraine (%)
Place of birth for the foreign-born population - Other Eastern Europe (%)
Place of birth for the foreign-born population - China (%)
Place of birth for the foreign-born population - Hong Kong (%)
Place of birth for the foreign-born population - Taiwan (%)
Place of birth for the foreign-born population - Japan (%)
Place of birth for the foreign-born population - Korea (%)
Place of birth for the foreign-born population - Other Eastern Asia (%)
Place of birth for the foreign-born population - Afghanistan (%)
Place of birth for the foreign-born population - Bangladesh (%)
Place of birth for the foreign-born population - India (%)
Place of birth for the foreign-born population - Iran (%)
Place of birth for the foreign-born population - Kazakhstan (%)
Place of birth for the foreign-born population - Nepal (%)
Place of birth for the foreign-born population - Pakistan (%)
Place of birth for the foreign-born population - Sri Lanka (%)
Place of birth for the foreign-born population - Uzbekistan (%)
Place of birth for the foreign-born population - Other South Central Asia (%)
Place of birth for the foreign-born population - Burma (%)
Place of birth for the foreign-born population - Cambodia (%)
Place of birth for the foreign-born population - Indonesia (%)
Place of birth for the foreign-born population - Laos (%)
Place of birth for the foreign-born population - Malaysia (%)
Place of birth for the foreign-born population - Philippines (%)
Place of birth for the foreign-born population - Singapore (%)
Place of birth for the foreign-born population - Thailand (%)
Place of birth for the foreign-born population - Vietnam (%)
Place of birth for the foreign-born population - Other South Eastern Asia (%)
Place of birth for the foreign-born population - Armenia (%)
Place of birth for the foreign-born population - Iraq (%)
Place of birth for the foreign-born population - Israel (%)
Place of birth for the foreign-born population - Jordan (%)
Place of birth for the foreign-born population - Kuwait (%)
Place of birth for the foreign-born population - Lebanon (%)
Place of birth for the foreign-born population - Saudi Arabia (%)
Place of birth for the foreign-born population - Syria (%)
Place of birth for the foreign-born population - Turkey (%)
Place of birth for the foreign-born population - Yemen (%)
Place of birth for the foreign-born population - Other Western Asia (%)
Place of birth for the foreign-born population - Eritrea (%)
Place of birth for the foreign-born population - Ethiopia (%)
Place of birth for the foreign-born population - Kenya (%)
Place of birth for the foreign-born population - Somalia (%)
Place of birth for the foreign-born population - Uganda (%)
Place of birth for the foreign-born population - Zimbabwe (%)
Place of birth for the foreign-born population - Other Eastern Africa (%)
Place of birth for the foreign-born population - Cameroon (%)
Place of birth for the foreign-born population - Congo (%)
Place of birth for the foreign-born population - Democratic Republic of Congo (Zaire) (%)
Place of birth for the foreign-born population - Other Middle Africa (%)
Place of birth for the foreign-born population - Egypt (%)
Place of birth for the foreign-born population - Morocco (%)
Place of birth for the foreign-born population - Sudan (%)
Place of birth for the foreign-born population - Other Northern Africa (%)
Place of birth for the foreign-born population - South Africa (%)
Place of birth for the foreign-born population - Other Southern Africa (%)
Place of birth for the foreign-born population - Cabo Verde (%)
Place of birth for the foreign-born population - Ghana (%)
Place of birth for the foreign-born population - Liberia (%)
Place of birth for the foreign-born population - Nigeria (%)
Place of birth for the foreign-born population - Senegal (%)
Place of birth for the foreign-born population - Sierra Leone (%)
Place of birth for the foreign-born population - Other Western Africa (%)
Place of birth for the foreign-born population - Australia (%)
Place of birth for the foreign-born population - New Zealand (%)
Place of birth for the foreign-born population - Fiji (%)
Place of birth for the foreign-born population - Micronesia (%)
Place of birth for the foreign-born population - Bahamas (%)
Place of birth for the foreign-born population - Barbados (%)
Place of birth for the foreign-born population - Cuba (%)
Place of birth for the foreign-born population - Dominica (%)
Place of birth for the foreign-born population - Dominican Republic (%)
Place of birth for the foreign-born population - Grenada (%)
Place of birth for the foreign-born population - Haiti (%)
Place of birth for the foreign-born population - Jamaica (%)
Place of birth for the foreign-born population - St. Vincent and the Grenadines (%)
Place of birth for the foreign-born population - Trinidad and Tobago (%)
Place of birth for the foreign-born population - West Indies (%)
Place of birth for the foreign-born population - Other Caribbean (%)
Place of birth for the foreign-born population - Belize (%)
Place of birth for the foreign-born population - Costa Rica (%)
Place of birth for the foreign-born population - El Salvador (%)
Place of birth for the foreign-born population - Guatemala (%)
Place of birth for the foreign-born population - Honduras (%)
Place of birth for the foreign-born population - Mexico (%)
Place of birth for the foreign-born population - Nicaragua (%)
Place of birth for the foreign-born population - Panama (%)
Place of birth for the foreign-born population - Other Central America (%)
Place of birth for the foreign-born population - Argentina (%)
Place of birth for the foreign-born population - Bolivia (%)
Place of birth for the foreign-born population - Brazil (%)
Place of birth for the foreign-born population - Chile (%)
Place of birth for the foreign-born population - Colombia (%)
Place of birth for the foreign-born population - Ecuador (%)
Place of birth for the foreign-born population - Guyana (%)
Place of birth for the foreign-born population - Peru (%)
Place of birth for the foreign-born population - Uruguay (%)
Place of birth for the foreign-born population - Venezuela (%)
Place of birth for the foreign-born population - Other South America (%)
Place of birth for the foreign-born population - Canada (%)
Place of birth for the foreign-born population - Other Northern America (%)
Place of birth for the foreign-born population - Other (%)
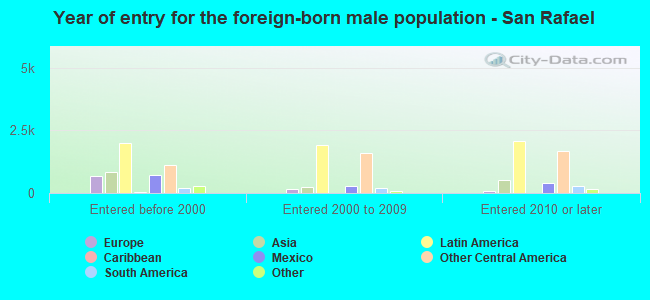
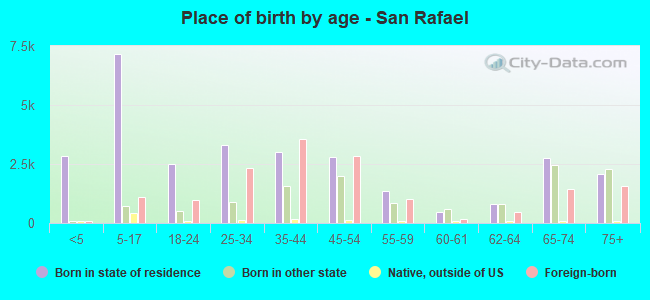
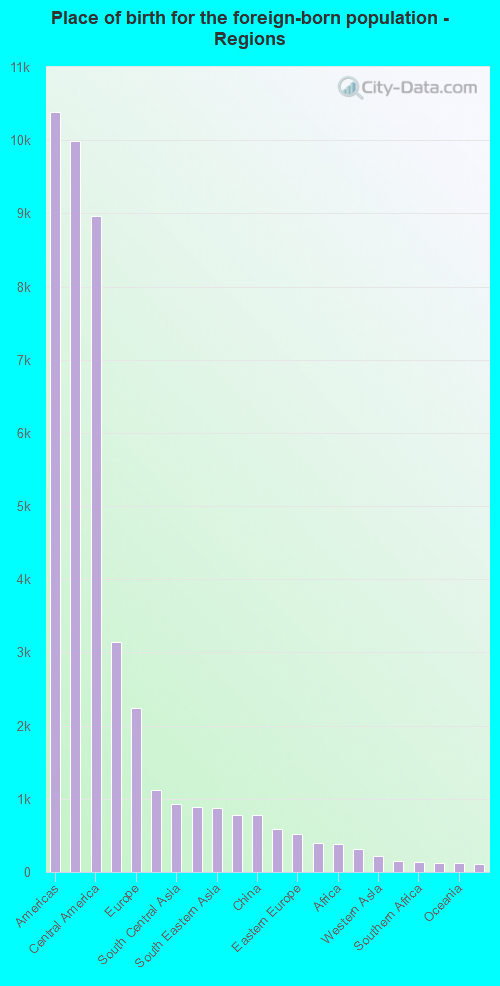
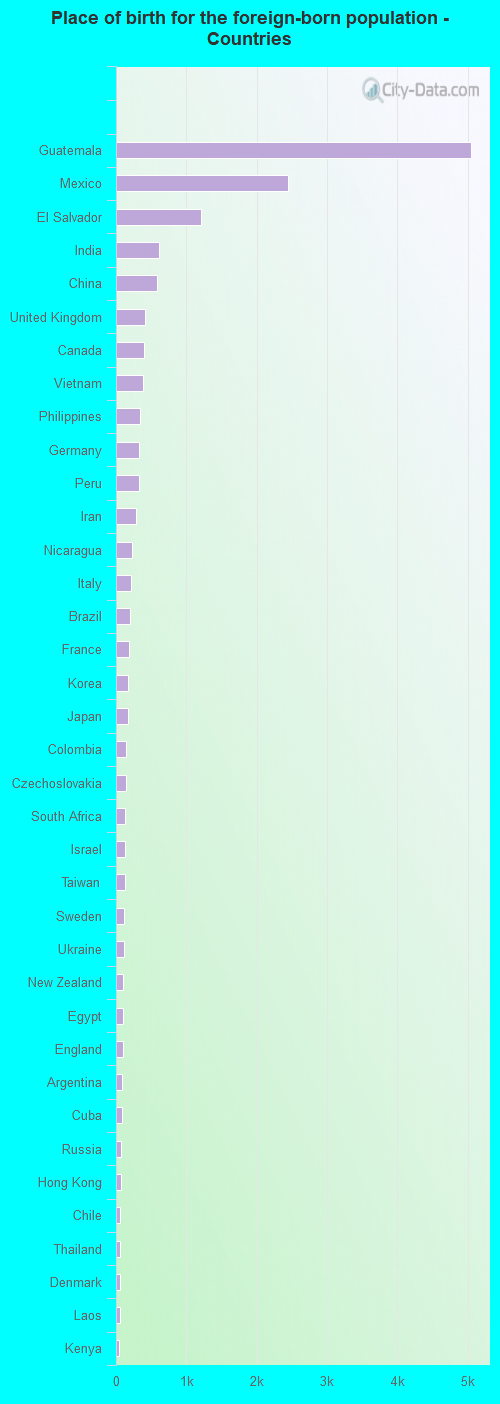
According to 2022 data, the most numerous races in San Rafael, CA are Hispanic (18,887 residents), White alone (31,229 residents), and Asian alone (4,215 residents). 64.3% of San Rafael residents speak English at home. 27.8% of San Rafael, CA residents are foreign-born (16.8% born in Latin America, 5.3% born in Asia, 3.8% born in Europe), which is 6.4% greater than the foreign-born rate of 26.0% across the entire state of California.
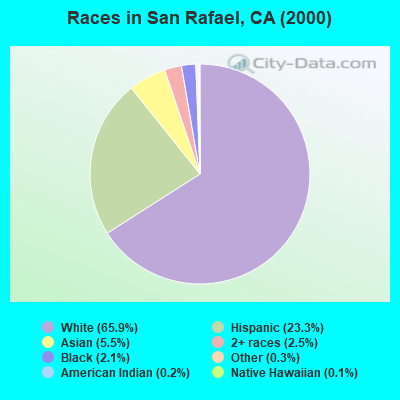
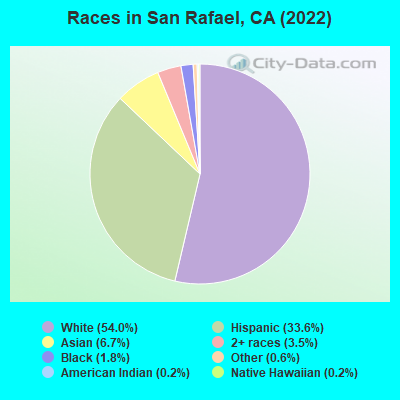
Race distribution in San Rafael
2000 2022
15,816,790 46.7% White alone 10,966,556 32.4% Hispanic 3,648,860 10.8% Asian alone 2,181,926 6.4% Black alone 903,115 2.7% Two or more races 178,984 0.5% American Indian alone 103,736 0.3% Native Hawaiian and Other 71,681 0.2% Other race alone
15,732,184 40.3% Hispanic 13,160,426 33.7% White alone 5,957,867 15.3% Asian alone 2,025,218 5.2% Black alone 1,663,222 4.3% Two or more races 251,618 0.6% Other race alone 135,777 0.3% Native Hawaiian and Other 103,030 0.3% American Indian alone
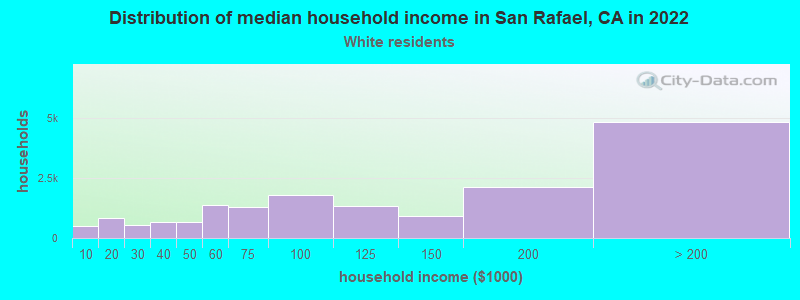
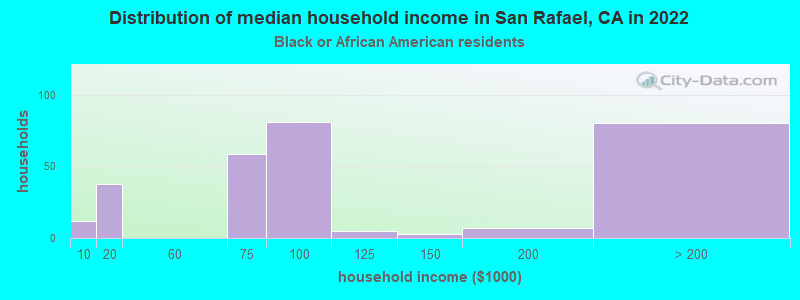
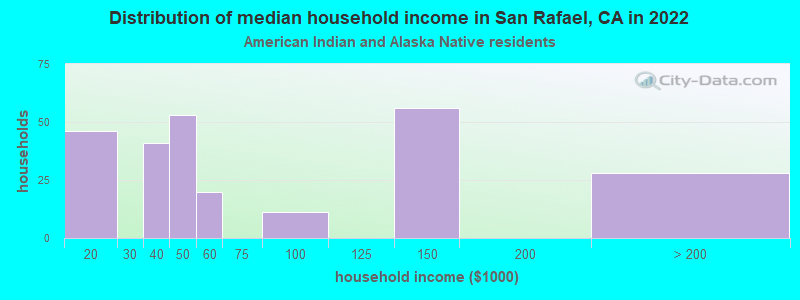
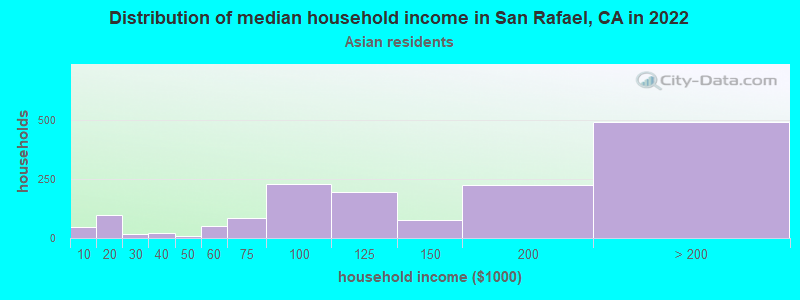
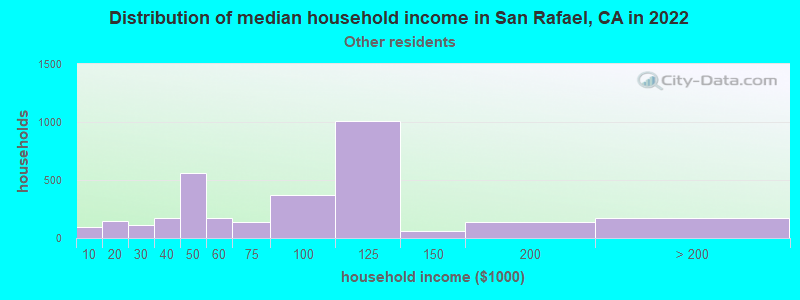
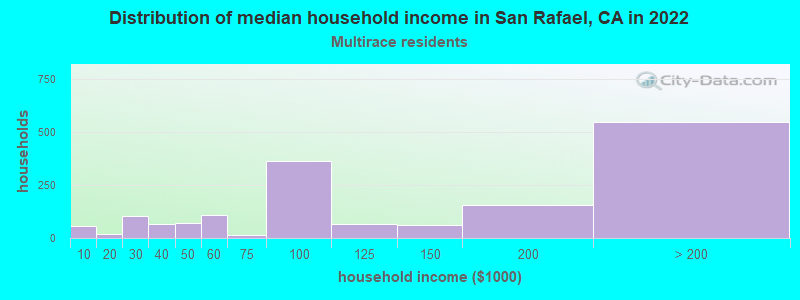
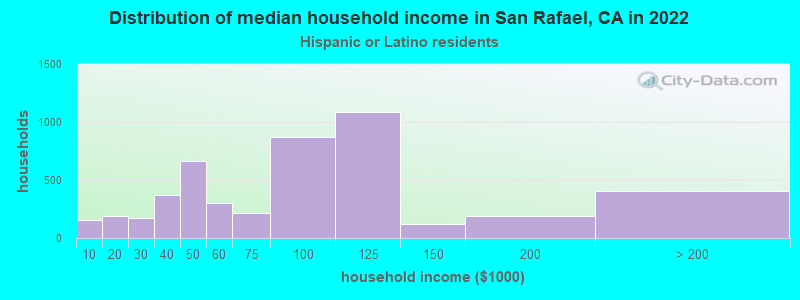
Income and house value in San Rafael Median household income in 2022 $136,200 White non-Hispanic householders$52,947 Black householders$56,940 American Indian and Alaska Native householders$116,430 Asian householders$107,067 Native Hawaiian and other Pacific Islander householders$73,621 Some other race householders$146,881 Two or more races householders$70,462 Hispanic or Latino race householdersMedian 2022 house value over $1,000,000 White Non-Hispanic householdersover $1,000,000 Black or African American householders$989,806 American Indian or Alaska Native householders over $1,000,000 Asian householdersover $1,000,000 Some other race householdersover $1,000,000 Two or more races householdersover $1,000,000 Hispanic or Latino householders
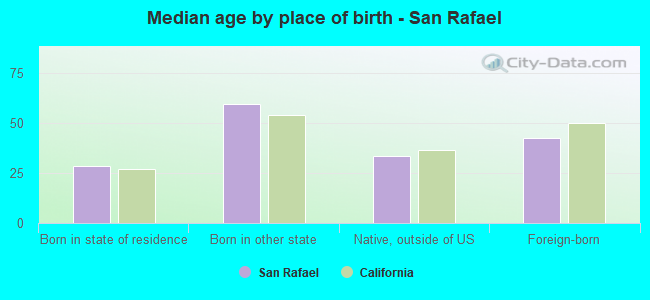
Median age by race in San Rafael
51.4 Median age for White residents49.1 53.6 30.6 Median age for Black or African American residents31.8 33.3 27.1 Median age for American Indian / Alaska Native residents18.5 47.5 42.4 Median age for Asian residents37.7 44.7 82.2 Median age for Native Hawaiian / Pacific Islander residents24.5 Median age for Other race residents27.4 25.9 42.3 Median age for Two or more races residents60.3 19.8 52.1 Median age for White alone residents50.3 53.8 28.4 Median age for Hispanic or Latino residents28.0 28.8
Owner/renter occupied households by race in San Rafael
House owners and renters - White residents 9,209 58.7% Owner occupied6,477 41.3% Renter occupiedHouse owners and renters - Black or African American residents 53 14.7% Owner occupied307 85.3% Renter occupiedHouse owners and renters - American Indian / Alaska Native residents 97 40.4% Owner occupied143 59.6% Renter occupiedHouse owners and renters - Asian residents 1,024 52.9% Owner occupied912 47.1% Renter occupiedHouse owners and renters - Other race residents 83 3.0% Owner occupied2,690 97.0% Renter occupiedHouse owners and renters - Two or more races residents 610 37.4% Owner occupied1,021 62.6% Renter occupiedHouse owners and renters - White alone residents 9,541 59.4% Owner occupied6,515 40.6% Renter occupiedHouse owners and renters - Hispanic or Latino residents 557 12.4% Owner occupied3,937 87.6% Renter occupied
Language usage in San Rafael
English speakers - Total 64.3% of residents of San Rafael speak English at home.
24.6% of residents speak Spanish at home 5,722 41.6% Speak English very well8,023 58.4% Speak English less than very well10.9% of residents speak other language at home 4,116 67.7% Speak English very well1,965 32.3% Speak English less than very well
English speakers - Born in the United States 94.4% of residents of San Rafael speak English at home.
3.1% of residents speak Spanish at home 356 87.7% Speak English very well50 12.3% Speak English less than very well2.3% of residents speak other language at home 275 91.7% Speak English very well25 8.3% Speak English less than very well
English speakers - Native, born elsewhere 75.8% of residents of San Rafael speak English at home.
11.6% of residents speak Spanish at home 85 65.4% Speak English very well45 34.6% Speak English less than very well12.6% of residents speak other language at home 93 66.0% Speak English very well48 34.0% Speak English less than very well
English speakers - Foreign-born 17.8% of residents of San Rafael speak English at home.
54.6% of residents speak Spanish at home 1,832 21.2% Speak English very well6,827 78.8% Speak English less than very well27.4% of residents speak other language at home 2,538 58.5% Speak English very well1,802 41.5% Speak English less than very well
White (Caucasian) - Speak only English Native:
97.9% (26,625)Foreign-born:
39.4% (1,516)
White (Caucasian) - Speak another language Native:
5.8% (1,580)Foreign-born:
66.7% (2,569)
Black or African American - Speak only English Native:
95.3% (640)Foreign-born:
67.4% (83)
Black or African American - Speak another language Native:
4.8% (32)Foreign-born:
28.0% (35)
American Indian / Alaska Native - Speak only English Native:
9.0% (21)Foreign-born:
6.9% (40)
American Indian / Alaska Native - Speak another language Native:
100.0% (231)Foreign-born:
93.1% (538)
Asian - Speak only English Native:
62.2% (1,031)Foreign-born:
20.9% (586)
Asian - Speak another language Native:
40.2% (667)Foreign-born:
80.2% (2,245)
Other race - Speak only English Native:
17.9% (739)Foreign-born:
4.1% (305)
Other race - Speak another language Native:
80.0% (3,308)Foreign-born:
95.5% (7,167)
Two or more races - Speak only English Native:
63.2% (3,629)Foreign-born:
16.5% (296)
Two or more races - Speak another language Native:
38.4% (2,203)Foreign-born:
77.3% (1,386)
White alone - Speak only English Native:
96.6% (26,566)Foreign-born:
45.1% (1,438)
White alone - Speak another language Native:
3.3% (920)Foreign-born:
53.3% (1,699)
Hispanic or Latino - Speak only English Native:
39.1% (2,781)Foreign-born:
10.1% (990)
Hispanic or Latino - Speak another language Native:
57.6% (4,089)Foreign-born:
87.9% (8,593)
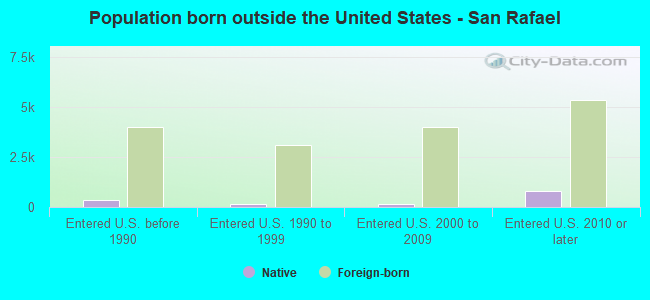
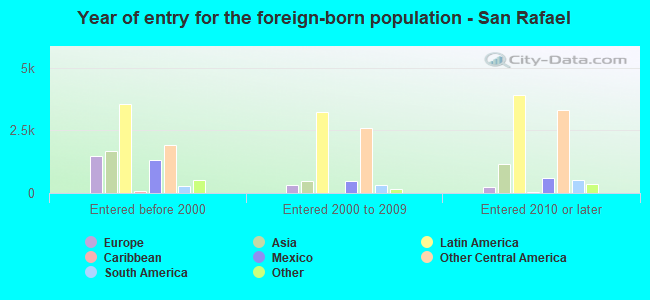
Foreign-born residents in San Rafael 16,279 residents are foreign born (16.8% Latin America , 5.3% Asia , 3.8% Europe ).
This city:
27.8%California:
100.0%
Marital status for residents in San Rafael Marital status - White (Caucasian) population 15 years and over
Males 30.1% Never married55.7% Now married2.0% Separated2.5% Widowed9.8% DivorcedFemales 26.5% Never married46.3% Now married1.1% Separated9.8% Widowed16.3% DivorcedWomen who gave birth in the past 12 months Now married:
83.4% (225)Unmarried:
16.6% (45)
Women who did not give birth in the past 12 months Now married:
46.7% (2,687)Unmarried:
53.3% (3,062)
Marital status - Black or African American population 15 years and over
Males 61.8% Never married13.7% Now married13.3% Separated0.0% Widowed11.1% DivorcedFemales 39.4% Never married45.6% Now married0.0% Separated8.0% Widowed6.9% DivorcedWomen who did not give birth in the past 12 months Now married:
33.3% (50)Unmarried:
66.7% (100)
Marital status - American Indian / Alaska Native population 15 years and over
Males 60.3% Never married18.5% Now married10.1% Separated0.0% Widowed11.1% DivorcedFemales 0.0% Never married54.7% Now married11.3% Separated0.0% Widowed34.0% DivorcedWomen who did not give birth in the past 12 months Now married:
45.7% (62)Unmarried:
54.3% (74)
Marital status - Asian population 15 years and over
Males 35.7% Never married55.2% Now married1.0% Separated1.3% Widowed6.8% DivorcedFemales 26.9% Never married52.6% Now married4.6% Separated8.8% Widowed7.2% DivorcedWomen who did not give birth in the past 12 months Now married:
53.4% (647)Unmarried:
46.6% (564)
Marital status - Other race population 15 years and over
Males 52.9% Never married36.9% Now married1.0% Separated0.0% Widowed9.2% DivorcedFemales 42.3% Never married45.0% Now married2.8% Separated1.8% Widowed8.1% DivorcedWomen who gave birth in the past 12 months Now married:
57.4% (192)Unmarried:
42.6% (143)
Women who did not give birth in the past 12 months Now married:
44.3% (1,147)Unmarried:
55.7% (1,445)
Marital status - Two or more races population 15 years and over
Males 39.8% Never married42.1% Now married1.3% Separated0.0% Widowed16.8% DivorcedFemales 57.6% Never married30.3% Now married0.0% Separated0.0% Widowed12.0% DivorcedWomen who did not give birth in the past 12 months Now married:
22.8% (349)Unmarried:
77.2% (1,181)
Marital status - White alone, not Hispanic / Latino population 15 years and over
Males 27.9% Never married58.1% Now married1.4% Separated2.7% Widowed10.0% DivorcedFemales 24.6% Never married46.2% Now married1.3% Separated10.8% Widowed17.1% DivorcedWomen who gave birth in the past 12 months Now married:
97.0% (239)Unmarried:
3.0% (7)
Women who did not give birth in the past 12 months Now married:
46.6% (2,589)Unmarried:
53.4% (2,972)
Marital status - Hispanic or Latino population 15 years and over
Males 50.4% Never married37.5% Now married2.7% Separated0.4% Widowed8.9% DivorcedFemales 41.9% Never married45.0% Now married2.0% Separated1.7% Widowed9.4% DivorcedWomen who gave birth in the past 12 months Now married:
53.4% (222)Unmarried:
46.6% (194)
Women who did not give birth in the past 12 months Now married:
44.4% (1,884)Unmarried:
55.6% (2,359)
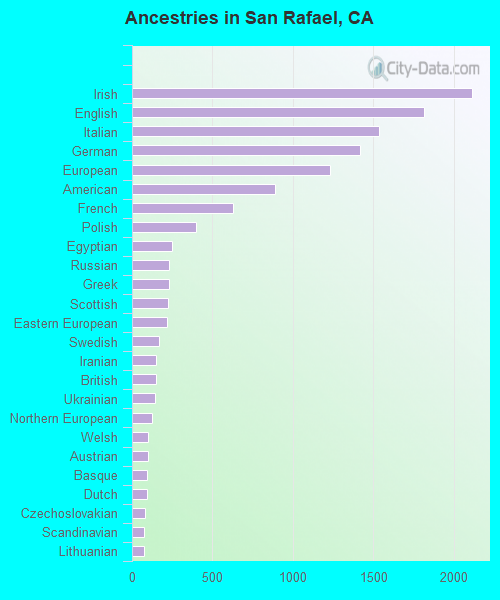
Ancestries in San Rafael
1,564 5.3% English1,487 5.0% European1,225 4.1% Italian1,093 3.7% Irish863 2.9% German610 2.1% American500 1.7% Eastern European331 1.1% Northern European324 1.1% Egyptian311 1.1% Iranian276 0.9% Russian267 0.9% British226 0.8% Polish219 0.7% French202 0.7% Swedish191 0.6% Scottish174 0.6% Dutch138 0.5% Norwegian121 0.4% Brazilian120 0.4% Ukrainian114 0.4% African112 0.4% Portuguese111 0.4% Armenian105 0.4% Scotch-Irish103 0.3% Danish102 0.3% Hungarian102 0.3% Greek87 0.3% Scandinavian80 0.3% Nigerian80 0.3% French Canadian59 0.2% Slavic56 0.2% Croatian47 0.2% Lithuanian47 0.2% Canadian44 0.1% Lebanese40 0.1% Romanian36 0.1% Turkish36 0.1% Slovak36 0.1% Finnish34 0.1% Israeli28 0.09% Czech27 0.09% New Zealander26 0.09% Basque25 0.08% Swiss21 0.07% Maltese21 0.07% Afghan18 0.06% Guyanese13 0.04% Palestinian13 0.04% Moroccan12 0.04% Austrian11 0.04% Barbadian9 0.03% Welsh8 0.03% Slovene8 0.03% Ethiopian8 0.03% Haitian7 0.02% Australian6 0.02% Belgian
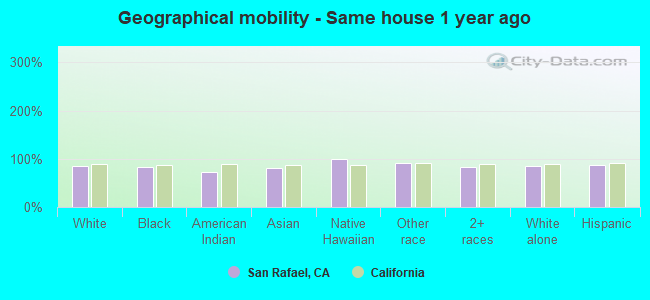
Geographical mobility in San Rafael Same house 1 year ago 27,013 84.8% White (Caucasian)657 83.6% Black or African American496 71.9% American Indian / Alaska Native3,516 81.2% Asian4 100.0% Native Hawaiian / Pacific Islander11,845 92.1% Other race6,583 83.8% Two or more races27,200 86.0% White alone, not Hispanic / Latino15,831 86.7% Hispanic or LatinoMoved within same county 2,432 7.6% White / Caucasian43 5.4% Black or African American74 10.8% American Indian / Alaska Native225 5.2% Asian464 3.6% Other race625 8.0% Two or more races2,136 6.8% White alone, not Hispanic / Latino1,294 7.1% Hispanic or LatinoMoved within same state 1,958 6.1% White / Caucasian85 10.9% Black or African American10 1.4% American Indian / Alaska Native425 9.8% Asian321 2.5% Other race403 5.1% Two or more races1,875 5.9% White alone, not Hispanic / Latino494 2.7% Hispanic or LatinoMoved from different state 296 0.9% White / Caucasian8 1.0% Black or African American111 2.6% Asian19 0.1% Other race93 1.2% Two or more races269 0.8% White alone, not Hispanic / Latino132 0.7% Hispanic or LatinoMoved from abroad 185 0.6% White138 19.9% American Indian / Alaska Native71 1.6% Asian277 2.1% Other race182 0.6% White alone, not Hispanic / Latino440 2.4% Hispanic or Latino
Children Nativity (place of birth) in San Rafael
Children under 6 years - Living with two parents Both parents native 1,211 100.0% NativeBoth parents foreign-born 909 96.1% Native37 3.9% Foreign-bornOne native, one foreign-born parent 478 93.6% Native33 6.4% Foreign-bornChildren under 6 years - Living with one parent Native parent 263 99.9% Native0 0.1% Foreign-bornForeign-born parent 538 92.4% Native44 7.6% Foreign-bornChildren 6 to 17 years - Living with two parents Both parents native 2,302 98.8% Native28 1.2% Foreign-bornBoth parents foreign-born 1,287 77.5% Native374 22.5% Foreign-bornOne native, one foreign-born parent 910 88.2% Native122 11.8% Foreign-bornChildren 6 to 17 years - Living with one parent Native parent 735 100.0% NativeForeign-born parent 2,092 55.2% Native1,699 44.8% Foreign-born
Grandparents responsible for own grandchildren in San Rafael
Grandparents (30 to 59 years) White / Caucasian 8 28.1% Responsible for grandchildren20 71.9% Not responsible for grandchildrenOther race 14 12.3% Responsible for grandchildren100 87.7% Not responsible for grandchildrenWhite alone, not Hispanic / Latino 23 100.0% Not responsible for grandchildrenHispanic or Latino 24 20.9% Responsible for grandchildren90 79.1% Not responsible for grandchildrenGrandparents (60 years and over) White / Caucasian 49 34.9% Responsible for grandchildren91 65.1% Not responsible for grandchildrenOther race 22 18.6% Responsible for grandchildren97 81.4% Not responsible for grandchildrenWhite alone, not Hispanic / Latino 12 10.7% Responsible for grandchildren98 89.3% Not responsible for grandchildrenHispanic or Latino 72 40.3% Responsible for grandchildren107 59.7% Not responsible for grandchildren