Races in Sandown, New Hampshire (NH) Detailed Stats
Ancestries, Foreign-born residents, place of birth

Recent posts about races in Sandown, New Hampshire on our local forum with over 2,400,000 registered users:
 | Life in Sandown nh (4 replies) |
| Where to find period, old homes for sale? (20 replies) |
| Boston commuter looking into southern NH (42 replies) |
| Moving to Nashua, NH (56 replies) |
| Family with 2 children considering a move to Danville NH. (1 reply) |
| Memrorial day (2 replies) |
3.1% of Sandown, NH residents are foreign-born (1.8% born in North America, 1.0% born in Europe), which is 59.7% less than the foreign-born rate of 5.0% across the entire state of New Hampshire.
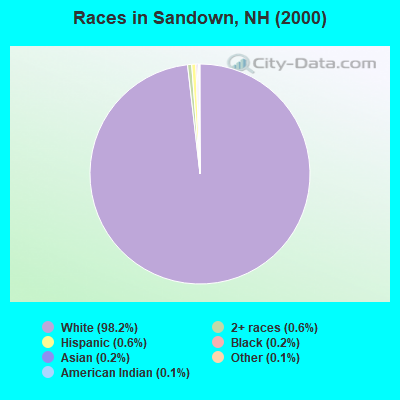
Race distribution in Sandown

- 5,04998.2%White alone
- 290.6%Hispanic
- 330.6%Two or more races
- 80.2%Asian alone
- 110.2%Black alone
- 60.1%Other race alone
- 60.1%American Indian alone
- 10.02%Native Hawaiian and Other
Pacific Islander alone
2000
2022
-
- 1,175,25295.1%White alone
- 20,4891.7%Hispanic
- 15,8031.3%Asian alone
- 11,6060.9%Two or more races
- 8,3540.7%Black alone
- 2,6980.2%American Indian alone
- 1,2540.1%Other race alone
- 3300.03%Native Hawaiian and Other
Pacific Islander alone

-
- 1,208,10186.6%White alone
- 63,4794.5%Hispanic
- 60,7244.4%Two or more races
- 36,5192.6%Asian alone
- 17,9311.3%Black alone
- 6,6150.5%Other race alone
- 1,0140.07%American Indian alone
- 8480.06%Native Hawaiian and Other
Pacific Islander alone

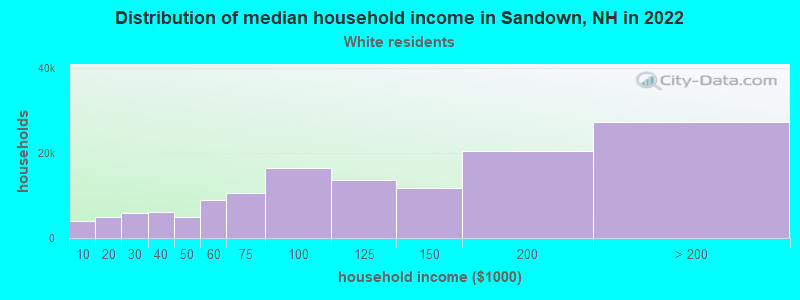
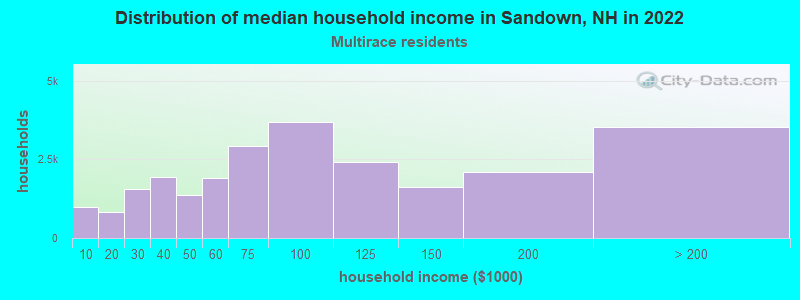
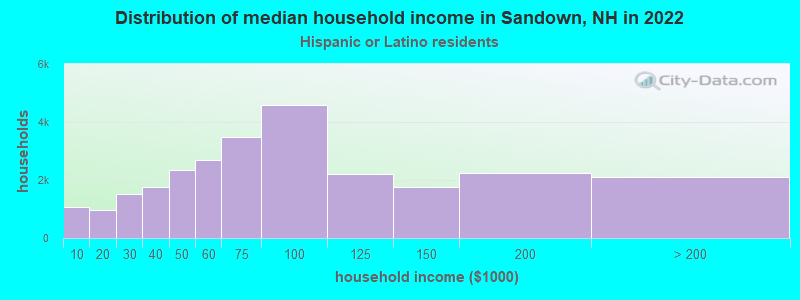
Income and house value in Sandown
- Median household income in 2022
- $125,421White non-Hispanic householders
- $178,118Two or more races householders
- $109,261Hispanic or Latino race householders
- Median 2022 house value
- $441,227White Non-Hispanic householders
- $420,143Two or more races householders
- $343,753Hispanic or Latino householders
Household income for White non-Hispanic householders
Household income for Two or more races householders
Household income for Hispanic or Latino race householders
Foreign-born residents in Sandown
161 residents are foreign born (1.8% North America, 1.0% Europe).
| This city: | 3.1% |
| New Hampshire: | 4.4% |
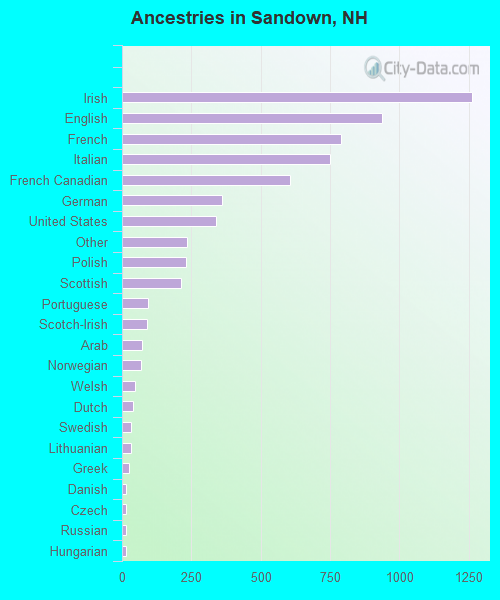
Ancestries in Sandown

- 1,26020.0%Irish
- 93614.9%English
- 79012.6%French
- 74911.9%Italian
- 6059.6%French Canadian
- 3595.7%German
- 3385.4%United States
- 2343.7%Other
- 2323.7%Polish
- 2143.4%Scottish
- 921.5%Portuguese
- 911.4%Scotch-Irish
- 731.2%Arab
- 671.1%Norwegian
- 470.7%Welsh
- 410.7%Dutch
- 330.5%Swedish
- 320.5%Lithuanian
- 250.4%Greek
- 150.2%Danish
- 140.2%Czech
- 140.2%Russian
- 130.2%Hungarian
- 70.1%Ukrainian
- 60.10%Swiss
Zip codes: 03873.