Races in Saratoga Springs, Utah (UT) Detailed Stats
Data:
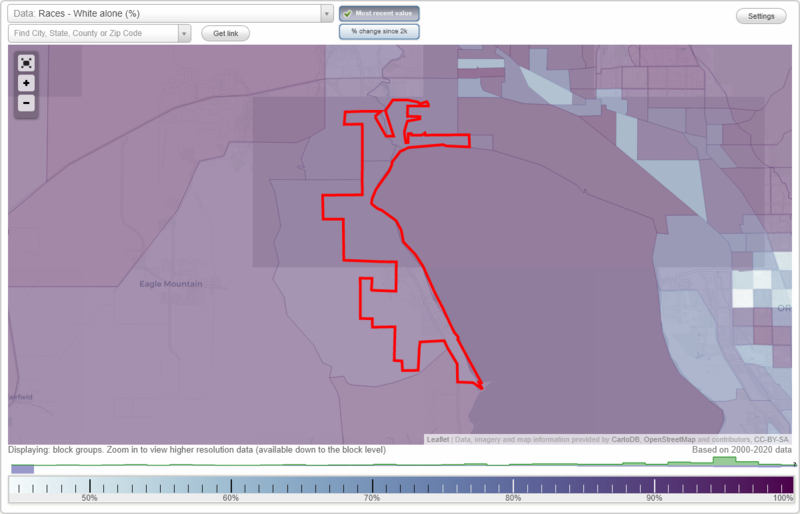
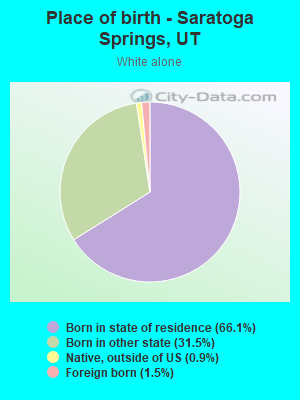
Races - White alone (%)
Races - White alone (% change since 2000)
Races - Black alone (%)
Races - Black alone (% change since 2000)
Races - American Indian alone (%)
Races - American Indian alone (% change since 2000)
Races - Asian alone (%)
Races - Asian alone (% change since 2000)
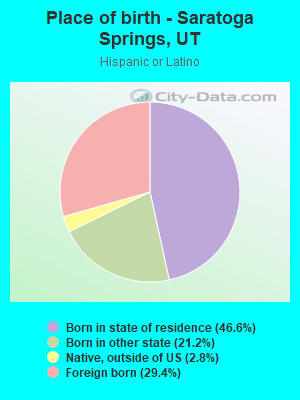
Races - Hispanic (%)
Races - Hispanic (% change since 2000)
Races - Native Hawaiian and Other Pacific Islander alone (%)
Races - Native Hawaiian and Other Pacific Islander alone (% change since 2000)
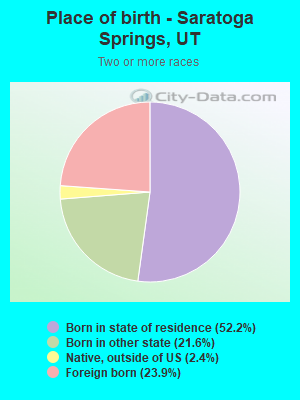
Races - Two or more races(%)
Races - Two or more races(% change since 2000)
Races - Other race alone (%)
Races - Other race alone (% change since 2000)
Racial diversity
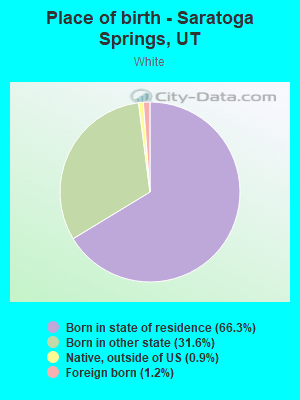
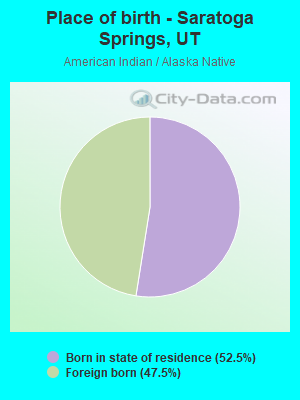
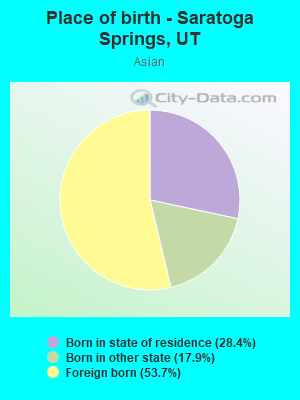
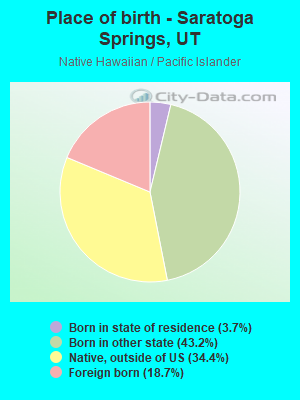
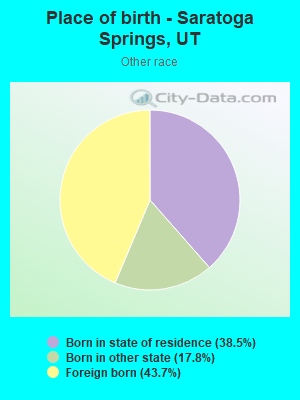
Place of birth - Born in state of residence (%)
Place of birth - Born in state of residence (%) - White
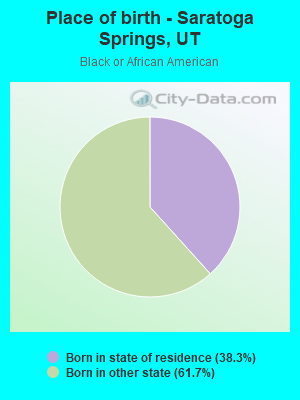
Place of birth - Born in state of residence (%) - Black or African American
Place of birth - Born in state of residence (%) - Asian
Place of birth - Born in state of residence (%) - Hispanic or Latino
Place of birth - Born in state of residence (%) - American Indian and Alaska Native
Place of birth - Born in state of residence (%) - Multirace
Place of birth - Born in state of residence (%) - Other Race
Place of birth - Born in other state (%)
Place of birth - Born in other state (%) - White
Place of birth - Born in other state (%) - Black or African American
Place of birth - Born in other state (%) - Asian
Place of birth - Born in other state (%) - Hispanic or Latino
Place of birth - Born in other state (%) - American Indian and Alaska Native
Place of birth - Born in other state (%) - Multirace
Place of birth - Born in other state (%) - Other Race
Place of birth - Native, outside of US (%)
Place of birth - Native, outside of US (%) - White
Place of birth - Native, outside of US (%) - Black or African American
Place of birth - Native, outside of US (%) - Asian
Place of birth - Native, outside of US (%) - Hispanic or Latino
Place of birth - Native, outside of US (%) - American Indian and Alaska Native
Place of birth - Native, outside of US (%) - Multirace
Place of birth - Native, outside of US (%) - Other Race
Place of birth - Foreign born (%)
Place of birth - Foreign born (%) - White
Place of birth - Foreign born (%) - Black or African American
Place of birth - Foreign born (%) - Asian
Place of birth - Foreign born (%) - Hispanic or Latino
Place of birth - Foreign born (%) - American Indian and Alaska Native
Place of birth - Foreign born (%) - Multirace
Place of birth - Foreign born (%) - Other Race
Residents speaking English at home (%)
Residents speaking English at home - Born in the United States (%)
Residents speaking English at home - Native, born elsewhere (%)
Residents speaking English at home - Foreign born (%)
Residents speaking Spanish at home (%)
Residents speaking Spanish at home - Born in the United States (%)
Residents speaking Spanish at home - Native, born elsewhere (%)
Residents speaking Spanish at home - Foreign born (%)
Residents speaking other language at home (%)
Residents speaking other language at home - Born in the United States (%)
Residents speaking other language at home - Native, born elsewhere (%)
Residents speaking other language at home - Foreign born (%)
Marital status - Never married (%)
Marital status - Now married (%)
Marital status - Separated (%)
Marital status - Widowed (%)
Marital status - Divorced (%)
Ancestries Reported - Arab (%)
Ancestries Reported - Czech (%)
Ancestries Reported - Danish (%)
Ancestries Reported - Dutch (%)
Ancestries Reported - English (%)
Ancestries Reported - French (%)
Ancestries Reported - French Canadian (%)
Ancestries Reported - German (%)
Ancestries Reported - Greek (%)
Ancestries Reported - Hungarian (%)
Ancestries Reported - Irish (%)
Ancestries Reported - Italian (%)
Ancestries Reported - Lithuanian (%)
Ancestries Reported - Norwegian (%)
Ancestries Reported - Polish (%)
Ancestries Reported - Portuguese (%)
Ancestries Reported - Russian (%)
Ancestries Reported - Scotch-Irish (%)
Ancestries Reported - Scottish (%)
Ancestries Reported - Slovak (%)
Ancestries Reported - Subsaharan African (%)
Ancestries Reported - Swedish (%)
Ancestries Reported - Swiss (%)
Ancestries Reported - Ukrainian (%)
Ancestries Reported - United States (%)
Ancestries Reported - Welsh (%)
Ancestries Reported - West Indian (%)
Ancestries Reported - Other (%)
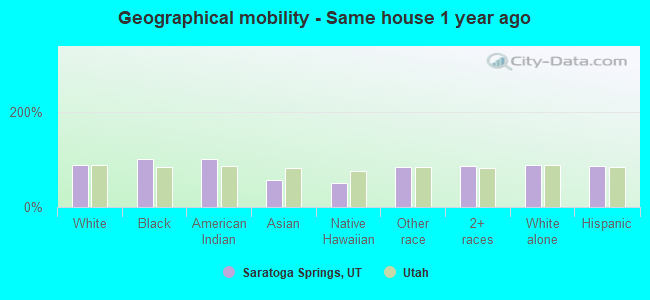
Geographical mobility - Same house 1 year ago (%)
Geographical mobility - Same house 1 year ago (%) - White
Geographical mobility - Same house 1 year ago (%) - Black or African American
Geographical mobility - Same house 1 year ago (%) - Asian
Geographical mobility - Same house 1 year ago (%) - Hispanic or Latino
Geographical mobility - Same house 1 year ago (%) - American Indian and Alaska Native
Geographical mobility - Same house 1 year ago (%) - Multirace
Geographical mobility - Same house 1 year ago (%) - Other Race
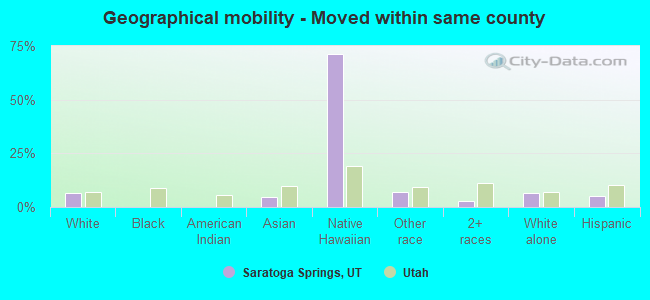
Geographical mobility - Moved within same county (%)
Geographical mobility - Moved within same county (%) - White
Geographical mobility - Moved within same county (%) - Black or African American
Geographical mobility - Moved within same county (%) - Asian
Geographical mobility - Moved within same county (%) - Hispanic or Latino
Geographical mobility - Moved within same county (%) - American Indian and Alaska Native
Geographical mobility - Moved within same county (%) - Multirace
Geographical mobility - Moved within same county (%) - Other Race
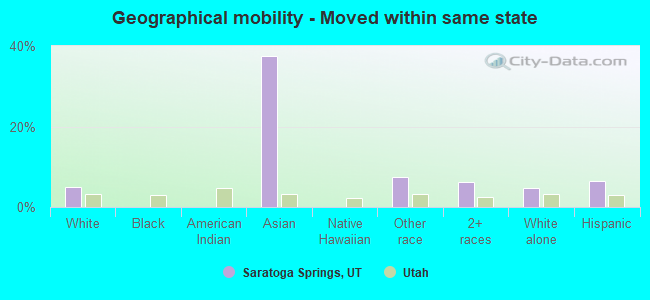
Geographical mobility - Moved from different county within same state (%)
Geographical mobility - Moved from different county within same state (%) - White
Geographical mobility - Moved from different county within same state (%) - Black or African American
Geographical mobility - Moved from different county within same state (%) - Asian
Geographical mobility - Moved from different county within same state (%) - Hispanic or Latino
Geographical mobility - Moved from different county within same state (%) - American Indian and Alaska Native
Geographical mobility - Moved from different county within same state (%) - Multirace
Geographical mobility - Moved from different county within same state (%) - Other Race
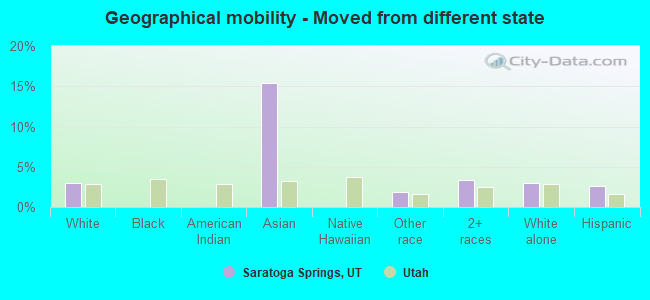
Geographical mobility - Moved from different state (%)
Geographical mobility - Moved from different state (%) - White
Geographical mobility - Moved from different state (%) - Black or African American
Geographical mobility - Moved from different state (%) - Asian
Geographical mobility - Moved from different state (%) - Hispanic or Latino
Geographical mobility - Moved from different state (%) - American Indian and Alaska Native
Geographical mobility - Moved from different state (%) - Multirace
Geographical mobility - Moved from different state (%) - Other Race
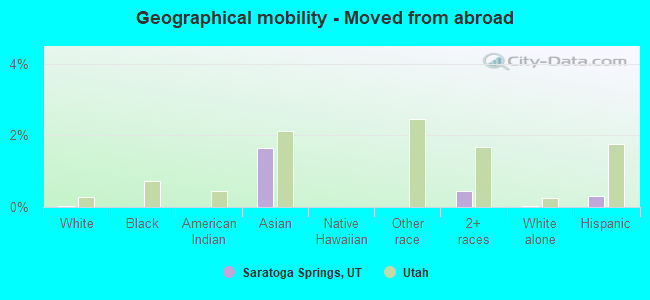
Geographical mobility - Moved from abroad (%)
Geographical mobility - Moved from abroad (%) - White
Geographical mobility - Moved from abroad (%) - Black or African American
Geographical mobility - Moved from abroad (%) - Asian
Geographical mobility - Moved from abroad (%) - Hispanic or Latino
Geographical mobility - Moved from abroad (%) - American Indian and Alaska Native
Geographical mobility - Moved from abroad (%) - Multirace
Geographical mobility - Moved from abroad (%) - Other Race
Place of birth for the foreign-born population - Ireland (%)
Place of birth for the foreign-born population - Denmark (%)
Place of birth for the foreign-born population - Norway (%)
Place of birth for the foreign-born population - Sweden (%)
Place of birth for the foreign-born population - United Kingdom (%)
Place of birth for the foreign-born population - England (%)
Place of birth for the foreign-born population - Scotland (%)
Place of birth for the foreign-born population - Other Northern Europe (%)
Place of birth for the foreign-born population - Austria (%)
Place of birth for the foreign-born population - Belgium (%)
Place of birth for the foreign-born population - France (%)
Place of birth for the foreign-born population - Germany (%)
Place of birth for the foreign-born population - Netherlands (%)
Place of birth for the foreign-born population - Switzerland (%)
Place of birth for the foreign-born population - Other Western Europe (%)
Place of birth for the foreign-born population - Greece (%)
Place of birth for the foreign-born population - Italy (%)
Place of birth for the foreign-born population - Portugal (%)
Place of birth for the foreign-born population - Spain (%)
Place of birth for the foreign-born population - Other Southern Europe (%)
Place of birth for the foreign-born population - Albania (%)
Place of birth for the foreign-born population - Belarus (%)
Place of birth for the foreign-born population - Bosnia and Herzegovina (%)
Place of birth for the foreign-born population - Bulgaria (%)
Place of birth for the foreign-born population - Croatia (%)
Place of birth for the foreign-born population - Czechoslovakia (%)
Place of birth for the foreign-born population - Hungary (%)
Place of birth for the foreign-born population - Latvia (%)
Place of birth for the foreign-born population - Lithuania (%)
Place of birth for the foreign-born population - North Macedonia (Macedonia) (%)
Place of birth for the foreign-born population - Moldova (%)
Place of birth for the foreign-born population - Poland (%)
Place of birth for the foreign-born population - Romania (%)
Place of birth for the foreign-born population - Russia (%)
Place of birth for the foreign-born population - Serbia (%)
Place of birth for the foreign-born population - Ukraine (%)
Place of birth for the foreign-born population - Other Eastern Europe (%)
Place of birth for the foreign-born population - China (%)
Place of birth for the foreign-born population - Hong Kong (%)
Place of birth for the foreign-born population - Taiwan (%)
Place of birth for the foreign-born population - Japan (%)
Place of birth for the foreign-born population - Korea (%)
Place of birth for the foreign-born population - Other Eastern Asia (%)
Place of birth for the foreign-born population - Afghanistan (%)
Place of birth for the foreign-born population - Bangladesh (%)
Place of birth for the foreign-born population - India (%)
Place of birth for the foreign-born population - Iran (%)
Place of birth for the foreign-born population - Kazakhstan (%)
Place of birth for the foreign-born population - Nepal (%)
Place of birth for the foreign-born population - Pakistan (%)
Place of birth for the foreign-born population - Sri Lanka (%)
Place of birth for the foreign-born population - Uzbekistan (%)
Place of birth for the foreign-born population - Other South Central Asia (%)
Place of birth for the foreign-born population - Burma (%)
Place of birth for the foreign-born population - Cambodia (%)
Place of birth for the foreign-born population - Indonesia (%)
Place of birth for the foreign-born population - Laos (%)
Place of birth for the foreign-born population - Malaysia (%)
Place of birth for the foreign-born population - Philippines (%)
Place of birth for the foreign-born population - Singapore (%)
Place of birth for the foreign-born population - Thailand (%)
Place of birth for the foreign-born population - Vietnam (%)
Place of birth for the foreign-born population - Other South Eastern Asia (%)
Place of birth for the foreign-born population - Armenia (%)
Place of birth for the foreign-born population - Iraq (%)
Place of birth for the foreign-born population - Israel (%)
Place of birth for the foreign-born population - Jordan (%)
Place of birth for the foreign-born population - Kuwait (%)
Place of birth for the foreign-born population - Lebanon (%)
Place of birth for the foreign-born population - Saudi Arabia (%)
Place of birth for the foreign-born population - Syria (%)
Place of birth for the foreign-born population - Turkey (%)
Place of birth for the foreign-born population - Yemen (%)
Place of birth for the foreign-born population - Other Western Asia (%)
Place of birth for the foreign-born population - Eritrea (%)
Place of birth for the foreign-born population - Ethiopia (%)
Place of birth for the foreign-born population - Kenya (%)
Place of birth for the foreign-born population - Somalia (%)
Place of birth for the foreign-born population - Uganda (%)
Place of birth for the foreign-born population - Zimbabwe (%)
Place of birth for the foreign-born population - Other Eastern Africa (%)
Place of birth for the foreign-born population - Cameroon (%)
Place of birth for the foreign-born population - Congo (%)
Place of birth for the foreign-born population - Democratic Republic of Congo (Zaire) (%)
Place of birth for the foreign-born population - Other Middle Africa (%)
Place of birth for the foreign-born population - Egypt (%)
Place of birth for the foreign-born population - Morocco (%)
Place of birth for the foreign-born population - Sudan (%)
Place of birth for the foreign-born population - Other Northern Africa (%)
Place of birth for the foreign-born population - South Africa (%)
Place of birth for the foreign-born population - Other Southern Africa (%)
Place of birth for the foreign-born population - Cabo Verde (%)
Place of birth for the foreign-born population - Ghana (%)
Place of birth for the foreign-born population - Liberia (%)
Place of birth for the foreign-born population - Nigeria (%)
Place of birth for the foreign-born population - Senegal (%)
Place of birth for the foreign-born population - Sierra Leone (%)
Place of birth for the foreign-born population - Other Western Africa (%)
Place of birth for the foreign-born population - Australia (%)
Place of birth for the foreign-born population - New Zealand (%)
Place of birth for the foreign-born population - Fiji (%)
Place of birth for the foreign-born population - Micronesia (%)
Place of birth for the foreign-born population - Bahamas (%)
Place of birth for the foreign-born population - Barbados (%)
Place of birth for the foreign-born population - Cuba (%)
Place of birth for the foreign-born population - Dominica (%)
Place of birth for the foreign-born population - Dominican Republic (%)
Place of birth for the foreign-born population - Grenada (%)
Place of birth for the foreign-born population - Haiti (%)
Place of birth for the foreign-born population - Jamaica (%)
Place of birth for the foreign-born population - St. Vincent and the Grenadines (%)
Place of birth for the foreign-born population - Trinidad and Tobago (%)
Place of birth for the foreign-born population - West Indies (%)
Place of birth for the foreign-born population - Other Caribbean (%)
Place of birth for the foreign-born population - Belize (%)
Place of birth for the foreign-born population - Costa Rica (%)
Place of birth for the foreign-born population - El Salvador (%)
Place of birth for the foreign-born population - Guatemala (%)
Place of birth for the foreign-born population - Honduras (%)
Place of birth for the foreign-born population - Mexico (%)
Place of birth for the foreign-born population - Nicaragua (%)
Place of birth for the foreign-born population - Panama (%)
Place of birth for the foreign-born population - Other Central America (%)
Place of birth for the foreign-born population - Argentina (%)
Place of birth for the foreign-born population - Bolivia (%)
Place of birth for the foreign-born population - Brazil (%)
Place of birth for the foreign-born population - Chile (%)
Place of birth for the foreign-born population - Colombia (%)
Place of birth for the foreign-born population - Ecuador (%)
Place of birth for the foreign-born population - Guyana (%)
Place of birth for the foreign-born population - Peru (%)
Place of birth for the foreign-born population - Uruguay (%)
Place of birth for the foreign-born population - Venezuela (%)
Place of birth for the foreign-born population - Other South America (%)
Place of birth for the foreign-born population - Canada (%)
Place of birth for the foreign-born population - Other Northern America (%)
Place of birth for the foreign-born population - Other (%)
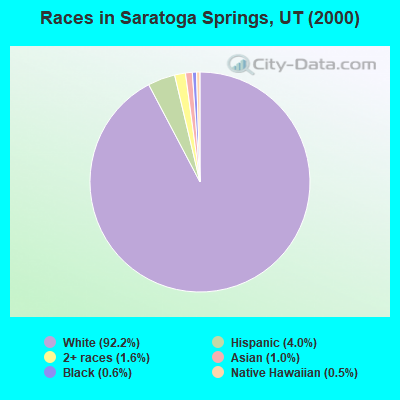
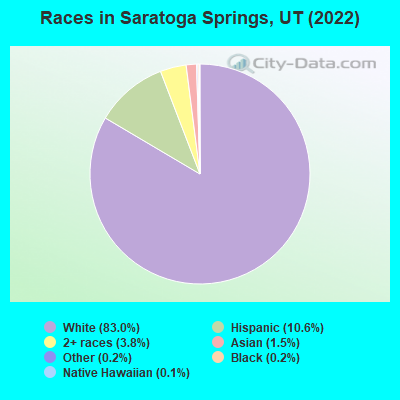
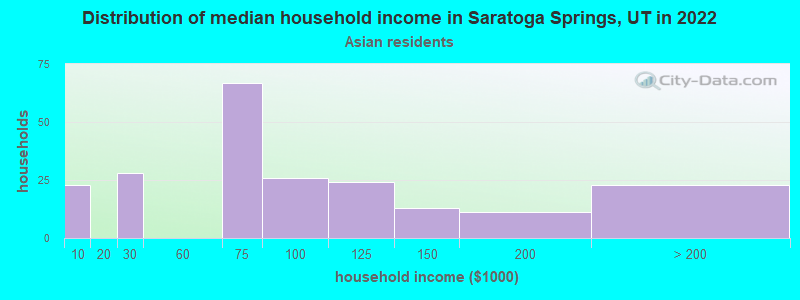
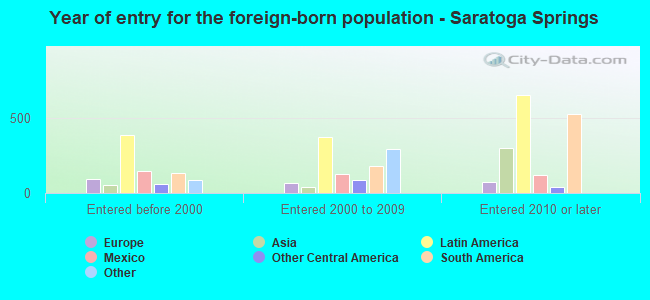
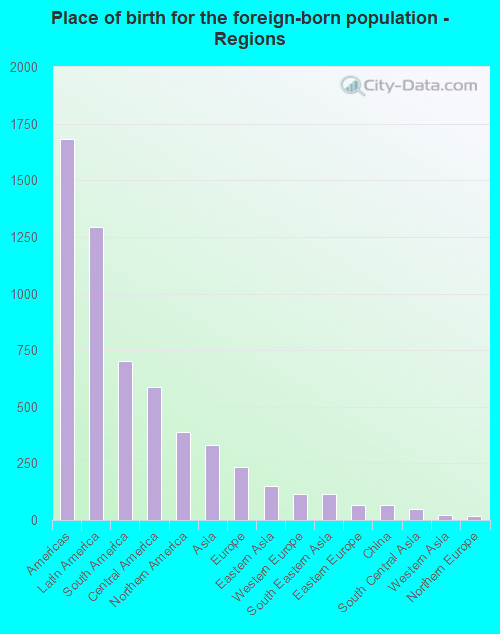
According to 2022 data, the most numerous races in Saratoga Springs, UT are White alone (35,337 residents), Hispanic (4,528 residents), and Two or more races (1,607 residents). 88.6% of Saratoga Springs residents speak English at home. 5.3% of Saratoga Springs, UT residents are foreign-born (3.0% born in Latin America, 0.9% born in North America, 0.8% born in Asia, 0.5% born in Europe), which is 51.1% less than the foreign-born rate of 8.0% across the entire state of Utah.
Race distribution in Saratoga Springs
2000 2022
1,904,265 85.3% White alone 201,559 9.0% Hispanic 36,483 1.6% Asian alone 31,308 1.4% Two or more races 26,663 1.2% American Indian alone 14,806 0.7% Native Hawaiian and Other 16,137 0.7% Black alone 1,948 0.09% Other race alone
2,557,466 75.6% White alone 512,086 15.1% Hispanic 119,308 3.5% Two or more races 82,388 2.4% Asian alone 36,978 1.1% Native Hawaiian and Other 34,873 1.0% Black alone 22,803 0.7% American Indian alone 14,898 0.4% Other race alone
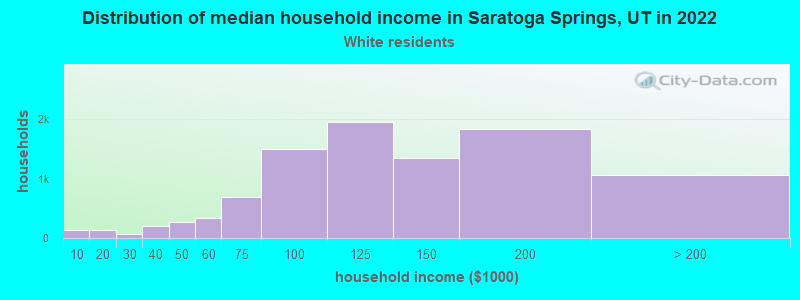
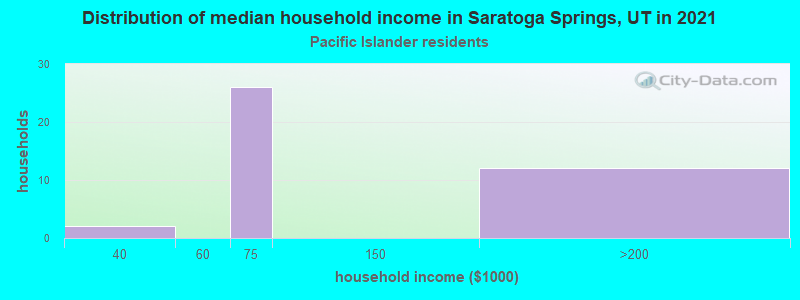
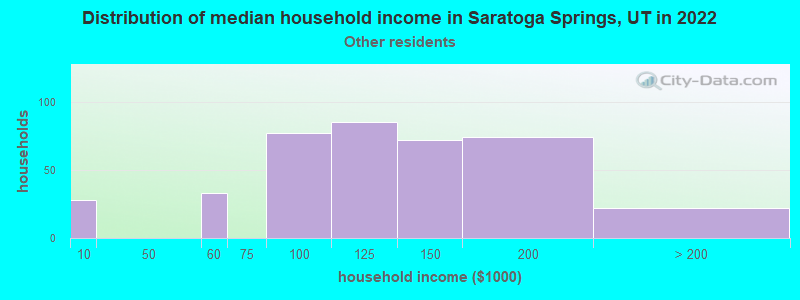
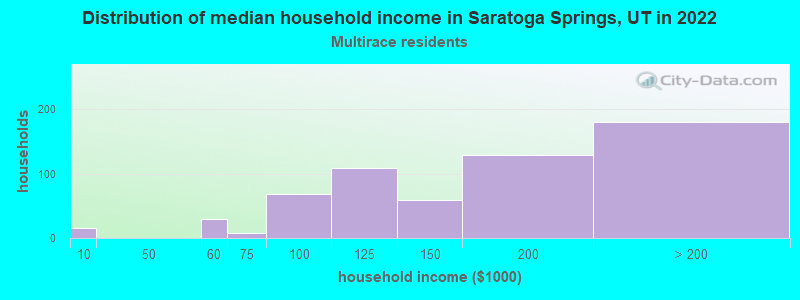
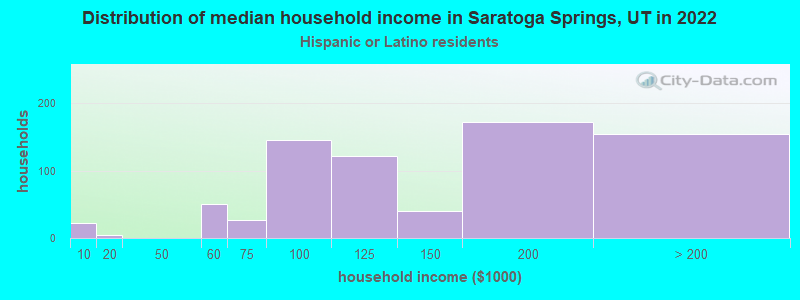
Income and house value in Saratoga Springs Median household income in 2022 $121,786 White non-Hispanic householders$98,777 Asian householders$104,094 Some other race householders$138,269 Two or more races householders$107,753 Hispanic or Latino race householdersMedian 2022 house value $603,622 White Non-Hispanic householders$926,835 Native Hawaiian and other Pacific Islander householders$631,933 Some other race householders$463,417 Two or more races householders$463,417 Hispanic or Latino householders
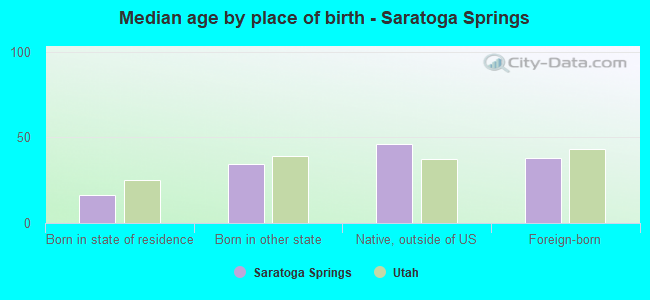
Median age by race in Saratoga Springs
23.1 Median age for White residents22.8 24.0 13.7 Median age for Black or African American residents39.5 -640,650,405.9 31.7 Median age for American Indian / Alaska Native residents-649,572,648.9 -706,192,357.7 30.7 Median age for Asian residents32.0 30.0 61.2 Median age for Native Hawaiian / Pacific Islander residents-749,999,999.2 59.9 28.9 Median age for Other race residents21.0 39.4 15.6 Median age for Two or more races residents15.6 15.7 23.2 Median age for White alone residents23.0 23.8 20.8 Median age for Hispanic or Latino residents18.4 27.1
Owner/renter occupied households by race in Saratoga Springs
House owners and renters - White residents 7,829 83.7% Owner occupied1,526 16.3% Renter occupiedHouse owners and renters - American Indian / Alaska Native residents 7 100.0% Owner occupiedHouse owners and renters - Asian residents 205 90.6% Owner occupied21 9.4% Renter occupiedHouse owners and renters - Native Hawaiian / Pacific Islander residents 39 100.0% Owner occupiedHouse owners and renters - Other race residents 375 95.7% Owner occupied17 4.3% Renter occupiedHouse owners and renters - Two or more races residents 472 81.8% Owner occupied105 18.2% Renter occupiedHouse owners and renters - White alone residents 7,854 83.8% Owner occupied1,524 16.2% Renter occupiedHouse owners and renters - Hispanic or Latino residents 517 76.7% Owner occupied157 23.3% Renter occupied
Language usage in Saratoga Springs
English speakers - Total 88.6% of residents of Saratoga Springs speak English at home.
7.3% of residents speak Spanish at home 1,918 69.4% Speak English very well846 30.6% Speak English less than very well3.7% of residents speak other language at home 1,295 93.4% Speak English very well91 6.6% Speak English less than very well
English speakers - Born in the United States 93.0% of residents of Saratoga Springs speak English at home.
4.3% of residents speak Spanish at home 453 87.5% Speak English very well65 12.5% Speak English less than very well2.7% of residents speak other language at home 312 96.3% Speak English very well12 3.7% Speak English less than very well
English speakers - Native, born elsewhere 62.8% of residents of Saratoga Springs speak English at home.
31.2% of residents speak Spanish at home 154 100.0% Speak English very well
English speakers - Foreign-born 30.7% of residents of Saratoga Springs speak English at home.
45.8% of residents speak Spanish at home 457 41.6% Speak English very well641 58.4% Speak English less than very well22.3% of residents speak other language at home 459 85.8% Speak English very well76 14.2% Speak English less than very well
White (Caucasian) - Speak only English Native:
96.8% (30,566)Foreign-born:
100.0% (413)
White (Caucasian) - Speak another language Native:
3.7% (1,159)Foreign-born:
33.0% (136)
American Indian / Alaska Native - Speak another language Native:
100.0% (16)Foreign-born:
96.1% (19)
Asian - Speak only English Native:
33.0% (87)Foreign-born:
17.8% (61)
Asian - Speak another language Native:
71.6% (189)Foreign-born:
80.6% (277)
Other race - Speak only English Native:
19.8% (177)Foreign-born:
13.2% (103)
Other race - Speak another language Native:
83.9% (749)Foreign-born:
80.4% (625)
Two or more races - Speak only English Native:
72.1% (1,680)Foreign-born:
2.6% (25)
Two or more races - Speak another language Native:
27.6% (643)Foreign-born:
97.6% (936)
White alone - Speak only English Native:
96.3% (29,913)Foreign-born:
91.3% (479)
White alone - Speak another language Native:
3.7% (1,146)Foreign-born:
16.2% (85)
Hispanic or Latino - Speak only English Native:
55.3% (1,440)Foreign-born:
5.3% (69)
Hispanic or Latino - Speak another language Native:
44.8% (1,165)Foreign-born:
93.5% (1,215)
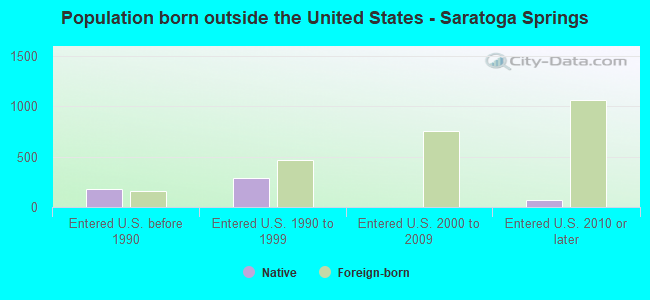
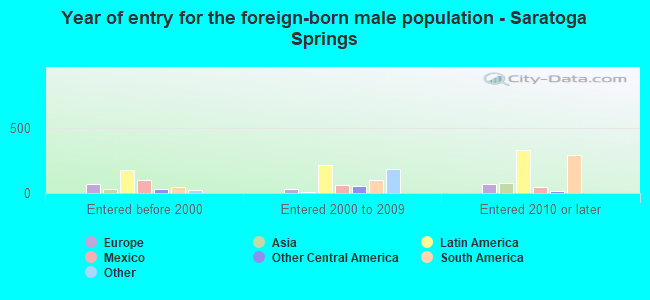
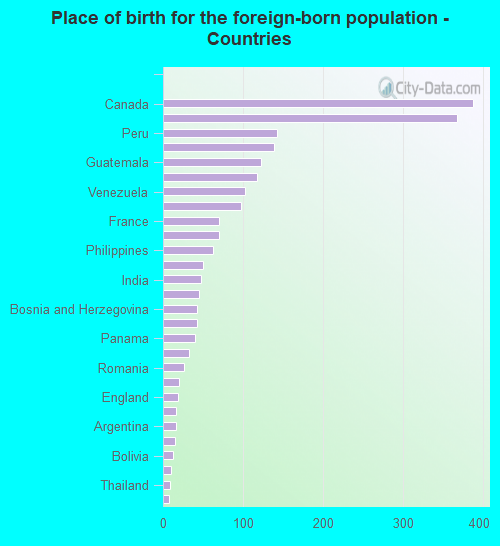
Foreign-born residents in Saratoga Springs 2,256 residents are foreign born (3.0% Latin America , 0.9% North America , 0.8% Asia , 0.5% Europe ).
Marital status for residents in Saratoga Springs Marital status - White (Caucasian) population 15 years and over
Males 29.3% Never married66.0% Now married0.3% Separated0.4% Widowed4.0% DivorcedFemales 24.5% Never married66.5% Now married0.8% Separated3.3% Widowed4.9% DivorcedWomen who gave birth in the past 12 months Now married:
97.3% (592)Unmarried:
2.7% (16)
Women who did not give birth in the past 12 months Now married:
62.1% (5,153)Unmarried:
37.9% (3,139)
Marital status - American Indian / Alaska Native population 15 years and over
Males 100.0% Never married0.0% Now married0.0% Separated0.0% Widowed0.0% DivorcedFemales 0.0% Never married100.0% Now married0.0% Separated0.0% Widowed0.0% DivorcedWomen who did not give birth in the past 12 months Now married:
100.0% (25)Unmarried:
0.0% (0)
Marital status - Asian population 15 years and over
Males 20.4% Never married74.8% Now married0.0% Separated0.0% Widowed4.8% DivorcedFemales 6.7% Never married93.3% Now married0.0% Separated0.0% Widowed0.0% DivorcedWomen who gave birth in the past 12 months Now married:
100.0% (22)Unmarried:
0.0% (0)
Women who did not give birth in the past 12 months Now married:
91.3% (196)Unmarried:
8.7% (19)
Marital status - Native Hawaiian / Pacific Islander population 15 years and over
Males 100.0% Never married0.0% Now married0.0% Separated0.0% Widowed0.0% DivorcedFemales 5.3% Never married0.0% Now married0.0% Separated94.7% Widowed0.0% DivorcedWomen who did not give birth in the past 12 months Now married:
0.0% (0)Unmarried:
100.0% (2)
Marital status - Other race population 15 years and over
Males 30.9% Never married62.5% Now married0.0% Separated0.0% Widowed6.6% DivorcedFemales 2.4% Never married79.6% Now married0.0% Separated14.2% Widowed3.8% DivorcedWomen who did not give birth in the past 12 months Now married:
96.8% (396)Unmarried:
3.2% (13)
Marital status - Two or more races population 15 years and over
Males 40.9% Never married57.4% Now married0.9% Separated0.5% Widowed0.3% DivorcedFemales 26.4% Never married61.4% Now married4.8% Separated3.9% Widowed3.5% DivorcedWomen who did not give birth in the past 12 months Now married:
67.2% (514)Unmarried:
32.8% (251)
Marital status - White alone, not Hispanic / Latino population 15 years and over
Males 29.2% Never married65.8% Now married0.3% Separated0.5% Widowed4.2% DivorcedFemales 24.8% Never married66.2% Now married0.6% Separated3.4% Widowed5.0% DivorcedWomen who gave birth in the past 12 months Now married:
97.3% (603)Unmarried:
2.7% (17)
Women who did not give birth in the past 12 months Now married:
61.6% (5,073)Unmarried:
38.4% (3,168)
Marital status - Hispanic or Latino population 15 years and over
Males 41.3% Never married56.4% Now married0.6% Separated0.4% Widowed1.3% DivorcedFemales 16.4% Never married69.9% Now married4.0% Separated6.6% Widowed3.1% DivorcedWomen who gave birth in the past 12 months Now married:
100.0% (8)Unmarried:
0.0% (0)
Women who did not give birth in the past 12 months Now married:
76.8% (783)Unmarried:
23.2% (236)
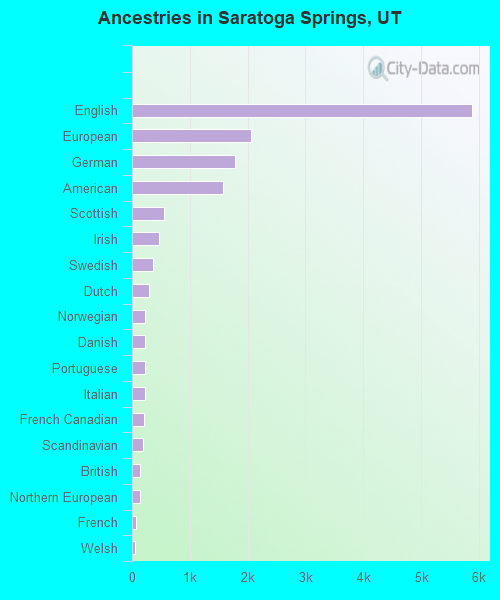
Ancestries in Saratoga Springs
5,882 31.2% English2,067 11.0% European1,776 9.4% German1,570 8.3% American561 3.0% Scottish473 2.5% Irish362 1.9% Swedish296 1.6% Dutch228 1.2% Norwegian228 1.2% Danish226 1.2% Portuguese220 1.2% Italian209 1.1% French Canadian193 1.0% Scandinavian137 0.7% British131 0.7% Northern European63 0.3% French59 0.3% Welsh45 0.2% Yugoslavian44 0.2% Brazilian43 0.2% Polish35 0.2% New Zealander26 0.1% Russian21 0.1% South African21 0.1% Greek19 0.1% Czechoslovakian17 0.09% Hungarian15 0.08% Australian12 0.06% Scotch-Irish10 0.05% Swiss8 0.04% Canadian6 0.03% Icelander4 0.02% Croatian
Geographical mobility in Saratoga Springs Same house 1 year ago 30,417 86.9% White (Caucasian)78 100.0% Black or African American33 100.0% American Indian / Alaska Native380 56.6% Asian21 50.3% Native Hawaiian / Pacific Islander1,509 83.9% Other race3,595 85.7% Two or more races30,231 86.9% White alone, not Hispanic / Latino3,831 85.6% Hispanic or LatinoMoved within same county 2,259 6.5% White / Caucasian33 4.9% Asian30 71.1% Native Hawaiian / Pacific Islander125 7.0% Other race114 2.7% Two or more races2,280 6.6% White alone, not Hispanic / Latino236 5.3% Hispanic or LatinoMoved within same state 1,751 5.0% White / Caucasian252 37.6% Asian132 7.4% Other race264 6.3% Two or more races1,630 4.7% White alone, not Hispanic / Latino289 6.5% Hispanic or LatinoMoved from different state 1,022 2.9% White / Caucasian103 15.4% Asian34 1.9% Other race140 3.3% Two or more races1,032 3.0% White alone, not Hispanic / Latino117 2.6% Hispanic or LatinoMoved from abroad 11 0.0% White11 1.6% Asian19 0.5% Two or more races10 0.0% White alone, not Hispanic / Latino14 0.3% Hispanic or Latino
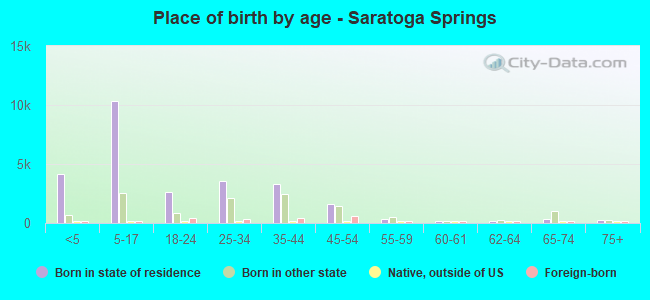
Children Nativity (place of birth) in Saratoga Springs
Children under 6 years - Living with two parents Both parents native 4,949 100.0% NativeBoth parents foreign-born 77 100.0% NativeOne native, one foreign-born parent 527 94.5% Native31 5.5% Foreign-bornChildren under 6 years - Living with one parent Native parent 365 100.0% NativeForeign-born parent 7 100.0% NativeChildren 6 to 17 years - Living with two parents Both parents native 9,711 99.6% Native37 0.4% Foreign-bornBoth parents foreign-born 371 74.3% Native128 25.7% Foreign-bornOne native, one foreign-born parent 471 100.0% NativeChildren 6 to 17 years - Living with one parent Native parent 1,173 100.0% NativeForeign-born parent 38 49.5% Native39 50.5% Foreign-born
Grandparents responsible for own grandchildren in Saratoga Springs
Grandparents (30 to 59 years) White / Caucasian 273 100.0% Not responsible for grandchildrenOther race 11 100.0% Responsible for grandchildrenTwo or more races 18 45.4% Responsible for grandchildren22 54.6% Not responsible for grandchildrenWhite alone, not Hispanic / Latino 283 100.0% Not responsible for grandchildrenHispanic or Latino 10 21.3% Responsible for grandchildren35 78.7% Not responsible for grandchildrenGrandparents (60 years and over) White / Caucasian 30 7.0% Responsible for grandchildren399 93.0% Not responsible for grandchildrenOther race 106 100.0% Not responsible for grandchildrenTwo or more races 32 100.0% Not responsible for grandchildrenWhite alone, not Hispanic / Latino 31 6.8% Responsible for grandchildren423 93.2% Not responsible for grandchildrenHispanic or Latino 106 100.0% Not responsible for grandchildren