Races in Schofield Barracks, Hawaii (HI) Detailed Stats
Data:
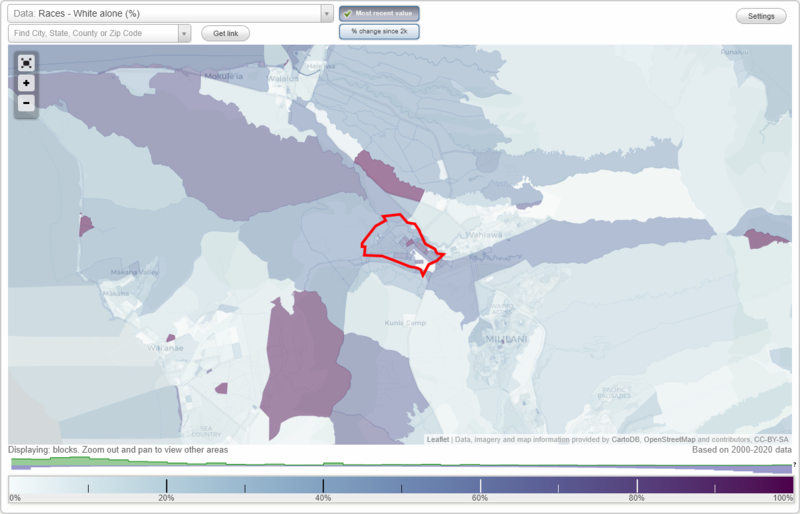
Races - White alone (%)
Races - White alone (% change since 2000)
Races - Black alone (%)
Races - Black alone (% change since 2000)
Races - American Indian alone (%)
Races - American Indian alone (% change since 2000)
Races - Asian alone (%)
Races - Asian alone (% change since 2000)
Races - Hispanic (%)
Races - Hispanic (% change since 2000)
Races - Native Hawaiian and Other Pacific Islander alone (%)
Races - Native Hawaiian and Other Pacific Islander alone (% change since 2000)
Races - Two or more races(%)
Races - Two or more races(% change since 2000)
Races - Other race alone (%)
Races - Other race alone (% change since 2000)
Racial diversity
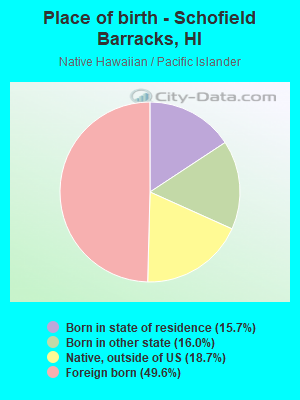
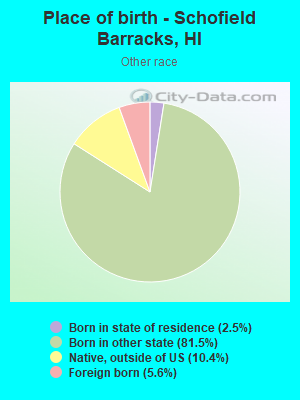
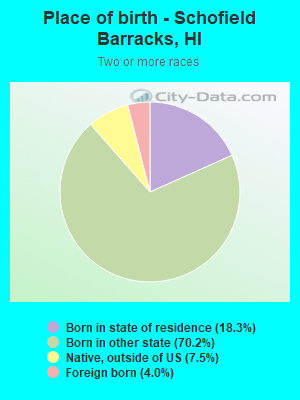
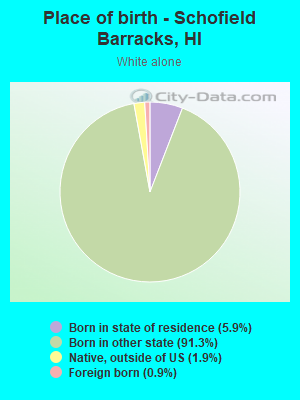
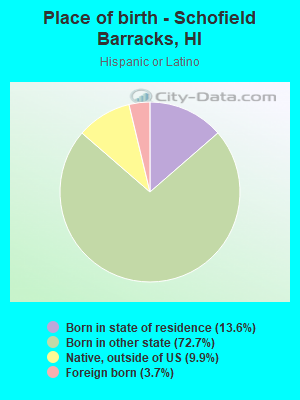
Place of birth - Born in state of residence (%)
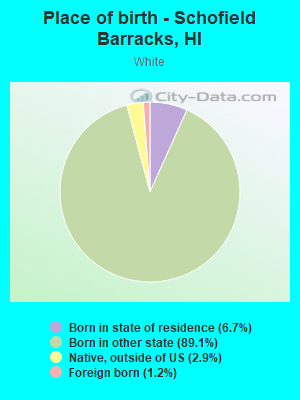
Place of birth - Born in state of residence (%) - White
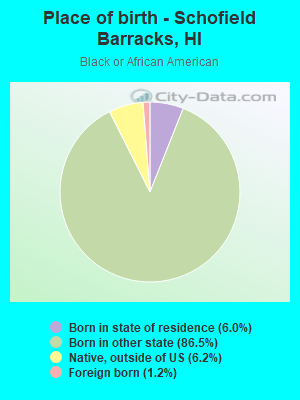
Place of birth - Born in state of residence (%) - Black or African American
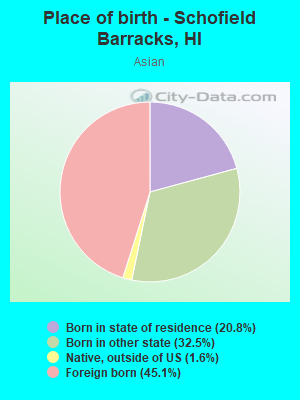
Place of birth - Born in state of residence (%) - Asian
Place of birth - Born in state of residence (%) - Hispanic or Latino
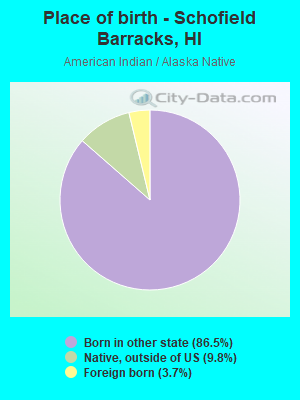
Place of birth - Born in state of residence (%) - American Indian and Alaska Native
Place of birth - Born in state of residence (%) - Multirace
Place of birth - Born in state of residence (%) - Other Race
Place of birth - Born in other state (%)
Place of birth - Born in other state (%) - White
Place of birth - Born in other state (%) - Black or African American
Place of birth - Born in other state (%) - Asian
Place of birth - Born in other state (%) - Hispanic or Latino
Place of birth - Born in other state (%) - American Indian and Alaska Native
Place of birth - Born in other state (%) - Multirace
Place of birth - Born in other state (%) - Other Race
Place of birth - Native, outside of US (%)
Place of birth - Native, outside of US (%) - White
Place of birth - Native, outside of US (%) - Black or African American
Place of birth - Native, outside of US (%) - Asian
Place of birth - Native, outside of US (%) - Hispanic or Latino
Place of birth - Native, outside of US (%) - American Indian and Alaska Native
Place of birth - Native, outside of US (%) - Multirace
Place of birth - Native, outside of US (%) - Other Race
Place of birth - Foreign born (%)
Place of birth - Foreign born (%) - White
Place of birth - Foreign born (%) - Black or African American
Place of birth - Foreign born (%) - Asian
Place of birth - Foreign born (%) - Hispanic or Latino
Place of birth - Foreign born (%) - American Indian and Alaska Native
Place of birth - Foreign born (%) - Multirace
Place of birth - Foreign born (%) - Other Race
Residents speaking English at home (%)
Residents speaking English at home - Born in the United States (%)
Residents speaking English at home - Native, born elsewhere (%)
Residents speaking English at home - Foreign born (%)
Residents speaking Spanish at home (%)
Residents speaking Spanish at home - Born in the United States (%)
Residents speaking Spanish at home - Native, born elsewhere (%)
Residents speaking Spanish at home - Foreign born (%)
Residents speaking other language at home (%)
Residents speaking other language at home - Born in the United States (%)
Residents speaking other language at home - Native, born elsewhere (%)
Residents speaking other language at home - Foreign born (%)
Marital status - Never married (%)
Marital status - Now married (%)
Marital status - Separated (%)
Marital status - Widowed (%)
Marital status - Divorced (%)
Ancestries Reported - Arab (%)
Ancestries Reported - Czech (%)
Ancestries Reported - Danish (%)
Ancestries Reported - Dutch (%)
Ancestries Reported - English (%)
Ancestries Reported - French (%)
Ancestries Reported - French Canadian (%)
Ancestries Reported - German (%)
Ancestries Reported - Greek (%)
Ancestries Reported - Hungarian (%)
Ancestries Reported - Irish (%)
Ancestries Reported - Italian (%)
Ancestries Reported - Lithuanian (%)
Ancestries Reported - Norwegian (%)
Ancestries Reported - Polish (%)
Ancestries Reported - Portuguese (%)
Ancestries Reported - Russian (%)
Ancestries Reported - Scotch-Irish (%)
Ancestries Reported - Scottish (%)
Ancestries Reported - Slovak (%)
Ancestries Reported - Subsaharan African (%)
Ancestries Reported - Swedish (%)
Ancestries Reported - Swiss (%)
Ancestries Reported - Ukrainian (%)
Ancestries Reported - United States (%)
Ancestries Reported - Welsh (%)
Ancestries Reported - West Indian (%)
Ancestries Reported - Other (%)
Geographical mobility - Same house 1 year ago (%)
Geographical mobility - Same house 1 year ago (%) - White
Geographical mobility - Same house 1 year ago (%) - Black or African American
Geographical mobility - Same house 1 year ago (%) - Asian
Geographical mobility - Same house 1 year ago (%) - Hispanic or Latino
Geographical mobility - Same house 1 year ago (%) - American Indian and Alaska Native
Geographical mobility - Same house 1 year ago (%) - Multirace
Geographical mobility - Same house 1 year ago (%) - Other Race
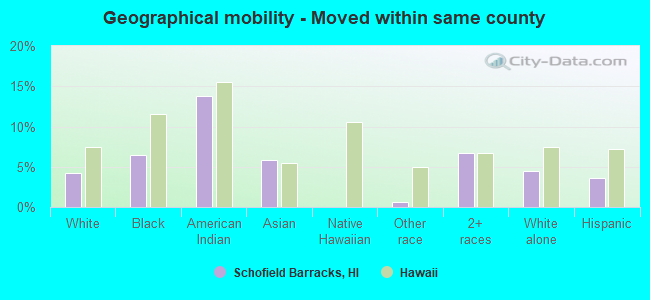
Geographical mobility - Moved within same county (%)
Geographical mobility - Moved within same county (%) - White
Geographical mobility - Moved within same county (%) - Black or African American
Geographical mobility - Moved within same county (%) - Asian
Geographical mobility - Moved within same county (%) - Hispanic or Latino
Geographical mobility - Moved within same county (%) - American Indian and Alaska Native
Geographical mobility - Moved within same county (%) - Multirace
Geographical mobility - Moved within same county (%) - Other Race
Geographical mobility - Moved from different county within same state (%)
Geographical mobility - Moved from different county within same state (%) - White
Geographical mobility - Moved from different county within same state (%) - Black or African American
Geographical mobility - Moved from different county within same state (%) - Asian
Geographical mobility - Moved from different county within same state (%) - Hispanic or Latino
Geographical mobility - Moved from different county within same state (%) - American Indian and Alaska Native
Geographical mobility - Moved from different county within same state (%) - Multirace
Geographical mobility - Moved from different county within same state (%) - Other Race
Geographical mobility - Moved from different state (%)
Geographical mobility - Moved from different state (%) - White
Geographical mobility - Moved from different state (%) - Black or African American
Geographical mobility - Moved from different state (%) - Asian
Geographical mobility - Moved from different state (%) - Hispanic or Latino
Geographical mobility - Moved from different state (%) - American Indian and Alaska Native
Geographical mobility - Moved from different state (%) - Multirace
Geographical mobility - Moved from different state (%) - Other Race
Geographical mobility - Moved from abroad (%)
Geographical mobility - Moved from abroad (%) - White
Geographical mobility - Moved from abroad (%) - Black or African American
Geographical mobility - Moved from abroad (%) - Asian
Geographical mobility - Moved from abroad (%) - Hispanic or Latino
Geographical mobility - Moved from abroad (%) - American Indian and Alaska Native
Geographical mobility - Moved from abroad (%) - Multirace
Geographical mobility - Moved from abroad (%) - Other Race
Place of birth for the foreign-born population - Ireland (%)
Place of birth for the foreign-born population - Denmark (%)
Place of birth for the foreign-born population - Norway (%)
Place of birth for the foreign-born population - Sweden (%)
Place of birth for the foreign-born population - United Kingdom (%)
Place of birth for the foreign-born population - England (%)
Place of birth for the foreign-born population - Scotland (%)
Place of birth for the foreign-born population - Other Northern Europe (%)
Place of birth for the foreign-born population - Austria (%)
Place of birth for the foreign-born population - Belgium (%)
Place of birth for the foreign-born population - France (%)
Place of birth for the foreign-born population - Germany (%)
Place of birth for the foreign-born population - Netherlands (%)
Place of birth for the foreign-born population - Switzerland (%)
Place of birth for the foreign-born population - Other Western Europe (%)
Place of birth for the foreign-born population - Greece (%)
Place of birth for the foreign-born population - Italy (%)
Place of birth for the foreign-born population - Portugal (%)
Place of birth for the foreign-born population - Spain (%)
Place of birth for the foreign-born population - Other Southern Europe (%)
Place of birth for the foreign-born population - Albania (%)
Place of birth for the foreign-born population - Belarus (%)
Place of birth for the foreign-born population - Bosnia and Herzegovina (%)
Place of birth for the foreign-born population - Bulgaria (%)
Place of birth for the foreign-born population - Croatia (%)
Place of birth for the foreign-born population - Czechoslovakia (%)
Place of birth for the foreign-born population - Hungary (%)
Place of birth for the foreign-born population - Latvia (%)
Place of birth for the foreign-born population - Lithuania (%)
Place of birth for the foreign-born population - North Macedonia (Macedonia) (%)
Place of birth for the foreign-born population - Moldova (%)
Place of birth for the foreign-born population - Poland (%)
Place of birth for the foreign-born population - Romania (%)
Place of birth for the foreign-born population - Russia (%)
Place of birth for the foreign-born population - Serbia (%)
Place of birth for the foreign-born population - Ukraine (%)
Place of birth for the foreign-born population - Other Eastern Europe (%)
Place of birth for the foreign-born population - China (%)
Place of birth for the foreign-born population - Hong Kong (%)
Place of birth for the foreign-born population - Taiwan (%)
Place of birth for the foreign-born population - Japan (%)
Place of birth for the foreign-born population - Korea (%)
Place of birth for the foreign-born population - Other Eastern Asia (%)
Place of birth for the foreign-born population - Afghanistan (%)
Place of birth for the foreign-born population - Bangladesh (%)
Place of birth for the foreign-born population - India (%)
Place of birth for the foreign-born population - Iran (%)
Place of birth for the foreign-born population - Kazakhstan (%)
Place of birth for the foreign-born population - Nepal (%)
Place of birth for the foreign-born population - Pakistan (%)
Place of birth for the foreign-born population - Sri Lanka (%)
Place of birth for the foreign-born population - Uzbekistan (%)
Place of birth for the foreign-born population - Other South Central Asia (%)
Place of birth for the foreign-born population - Burma (%)
Place of birth for the foreign-born population - Cambodia (%)
Place of birth for the foreign-born population - Indonesia (%)
Place of birth for the foreign-born population - Laos (%)
Place of birth for the foreign-born population - Malaysia (%)
Place of birth for the foreign-born population - Philippines (%)
Place of birth for the foreign-born population - Singapore (%)
Place of birth for the foreign-born population - Thailand (%)
Place of birth for the foreign-born population - Vietnam (%)
Place of birth for the foreign-born population - Other South Eastern Asia (%)
Place of birth for the foreign-born population - Armenia (%)
Place of birth for the foreign-born population - Iraq (%)
Place of birth for the foreign-born population - Israel (%)
Place of birth for the foreign-born population - Jordan (%)
Place of birth for the foreign-born population - Kuwait (%)
Place of birth for the foreign-born population - Lebanon (%)
Place of birth for the foreign-born population - Saudi Arabia (%)
Place of birth for the foreign-born population - Syria (%)
Place of birth for the foreign-born population - Turkey (%)
Place of birth for the foreign-born population - Yemen (%)
Place of birth for the foreign-born population - Other Western Asia (%)
Place of birth for the foreign-born population - Eritrea (%)
Place of birth for the foreign-born population - Ethiopia (%)
Place of birth for the foreign-born population - Kenya (%)
Place of birth for the foreign-born population - Somalia (%)
Place of birth for the foreign-born population - Uganda (%)
Place of birth for the foreign-born population - Zimbabwe (%)
Place of birth for the foreign-born population - Other Eastern Africa (%)
Place of birth for the foreign-born population - Cameroon (%)
Place of birth for the foreign-born population - Congo (%)
Place of birth for the foreign-born population - Democratic Republic of Congo (Zaire) (%)
Place of birth for the foreign-born population - Other Middle Africa (%)
Place of birth for the foreign-born population - Egypt (%)
Place of birth for the foreign-born population - Morocco (%)
Place of birth for the foreign-born population - Sudan (%)
Place of birth for the foreign-born population - Other Northern Africa (%)
Place of birth for the foreign-born population - South Africa (%)
Place of birth for the foreign-born population - Other Southern Africa (%)
Place of birth for the foreign-born population - Cabo Verde (%)
Place of birth for the foreign-born population - Ghana (%)
Place of birth for the foreign-born population - Liberia (%)
Place of birth for the foreign-born population - Nigeria (%)
Place of birth for the foreign-born population - Senegal (%)
Place of birth for the foreign-born population - Sierra Leone (%)
Place of birth for the foreign-born population - Other Western Africa (%)
Place of birth for the foreign-born population - Australia (%)
Place of birth for the foreign-born population - New Zealand (%)
Place of birth for the foreign-born population - Fiji (%)
Place of birth for the foreign-born population - Micronesia (%)
Place of birth for the foreign-born population - Bahamas (%)
Place of birth for the foreign-born population - Barbados (%)
Place of birth for the foreign-born population - Cuba (%)
Place of birth for the foreign-born population - Dominica (%)
Place of birth for the foreign-born population - Dominican Republic (%)
Place of birth for the foreign-born population - Grenada (%)
Place of birth for the foreign-born population - Haiti (%)
Place of birth for the foreign-born population - Jamaica (%)
Place of birth for the foreign-born population - St. Vincent and the Grenadines (%)
Place of birth for the foreign-born population - Trinidad and Tobago (%)
Place of birth for the foreign-born population - West Indies (%)
Place of birth for the foreign-born population - Other Caribbean (%)
Place of birth for the foreign-born population - Belize (%)
Place of birth for the foreign-born population - Costa Rica (%)
Place of birth for the foreign-born population - El Salvador (%)
Place of birth for the foreign-born population - Guatemala (%)
Place of birth for the foreign-born population - Honduras (%)
Place of birth for the foreign-born population - Mexico (%)
Place of birth for the foreign-born population - Nicaragua (%)
Place of birth for the foreign-born population - Panama (%)
Place of birth for the foreign-born population - Other Central America (%)
Place of birth for the foreign-born population - Argentina (%)
Place of birth for the foreign-born population - Bolivia (%)
Place of birth for the foreign-born population - Brazil (%)
Place of birth for the foreign-born population - Chile (%)
Place of birth for the foreign-born population - Colombia (%)
Place of birth for the foreign-born population - Ecuador (%)
Place of birth for the foreign-born population - Guyana (%)
Place of birth for the foreign-born population - Peru (%)
Place of birth for the foreign-born population - Uruguay (%)
Place of birth for the foreign-born population - Venezuela (%)
Place of birth for the foreign-born population - Other South America (%)
Place of birth for the foreign-born population - Canada (%)
Place of birth for the foreign-born population - Other Northern America (%)
Place of birth for the foreign-born population - Other (%)
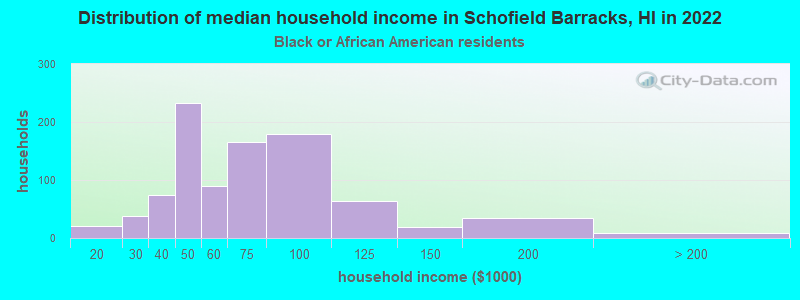
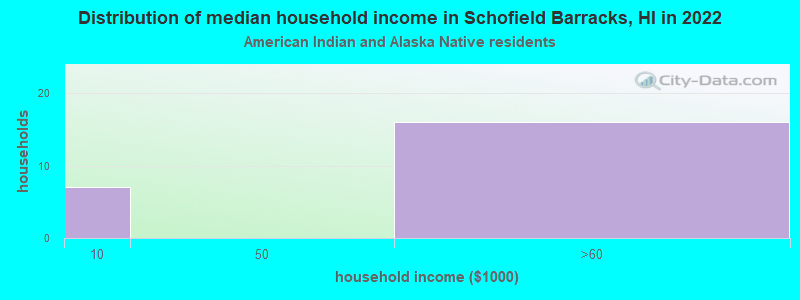
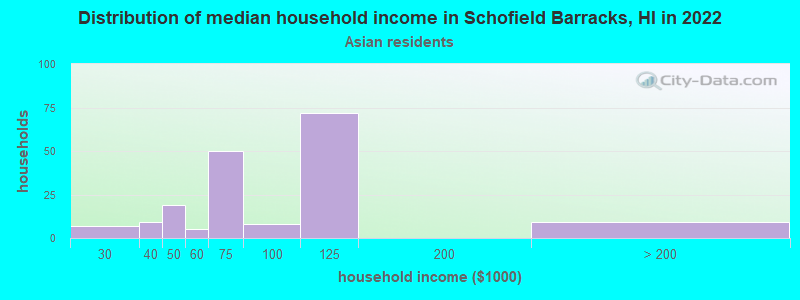
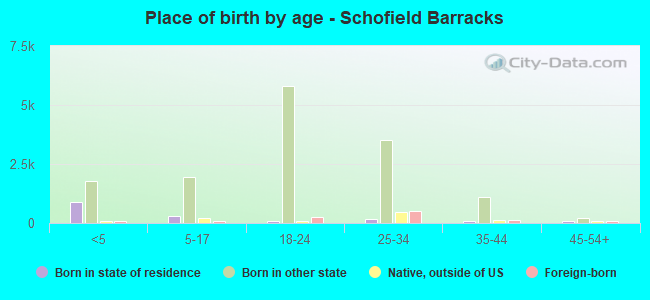
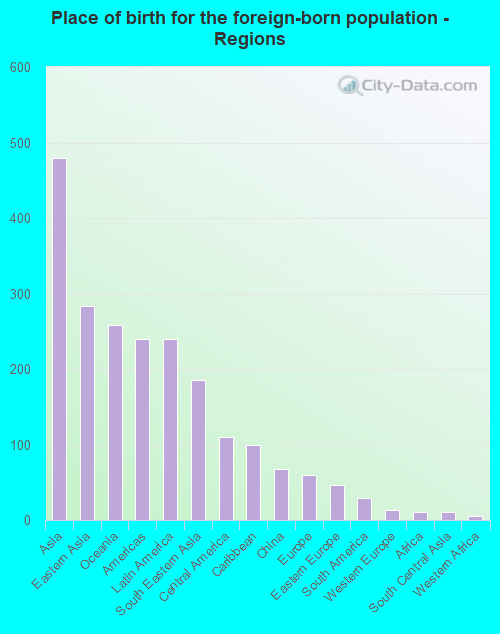
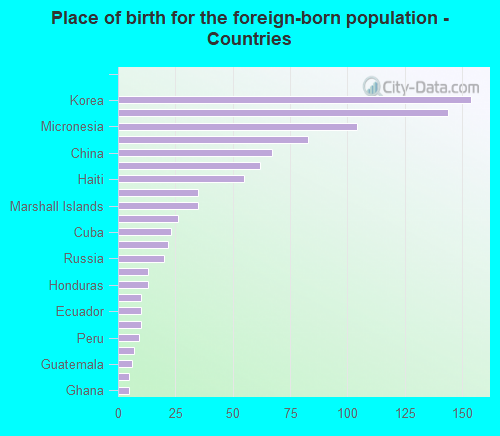
According to 2022 data, the most numerous races in Schofield Barracks, HI are Asian alone (826 residents), Two or more races (1,153 residents), and White alone (8,426 residents). 83.2% of Schofield Barracks residents speak English at home. 5.9% of Schofield Barracks, HI residents are foreign-born (2.6% born in Asia, 1.4% born in Oceania, 1.3% born in Latin America), which is 206.7% less than the foreign-born rate of 18.0% across the entire state of Hawaii.
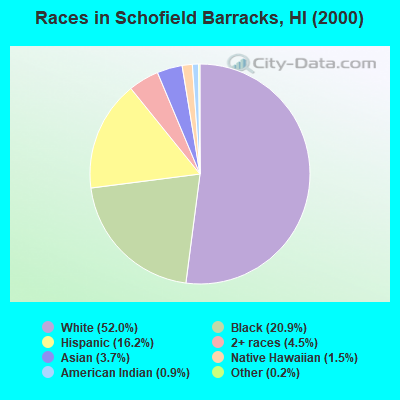
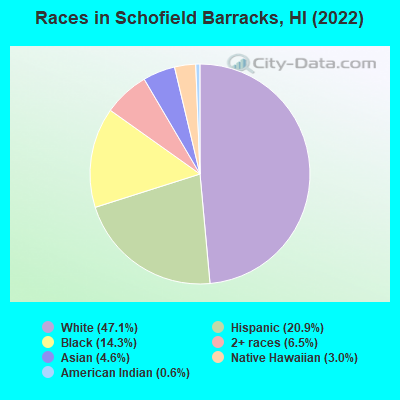
Race distribution in Schofield Barracks
2000 2022
494,149 40.8% Asian alone 277,091 22.9% White alone 218,700 18.1% Two or more races 108,441 9.0% Native Hawaiian and Other 87,699 7.2% Hispanic 20,829 1.7% Black alone 2,089 0.2% Other race alone 2,539 0.2% American Indian alone
498,125 34.6% Asian alone 318,574 22.1% Two or more races 297,937 20.7% White alone 160,103 11.1% Hispanic 134,567 9.3% Native Hawaiian and Other 23,682 1.6% Black alone 5,378 0.4% Other race alone 1,830 0.1% American Indian alone
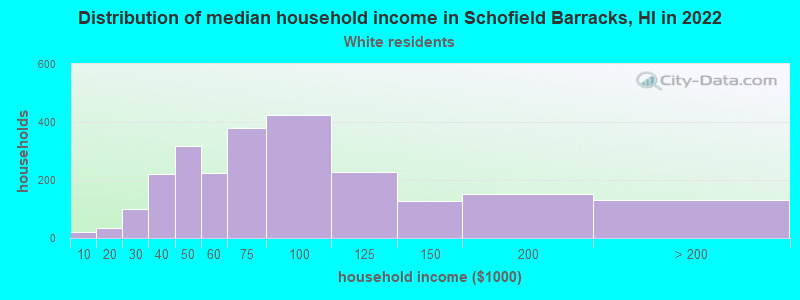
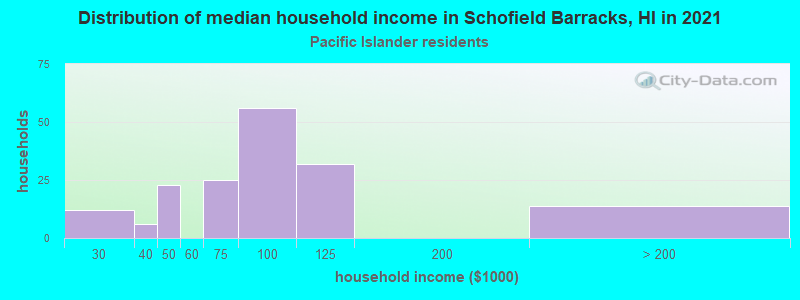
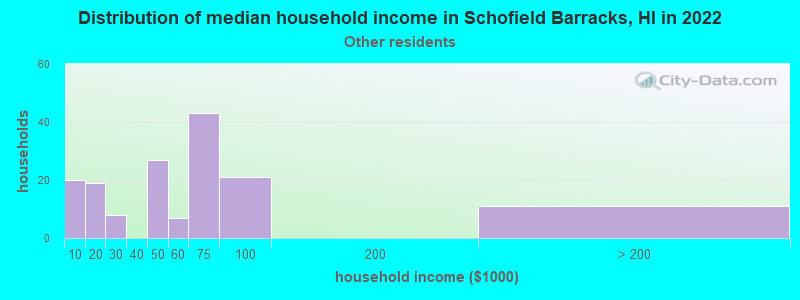
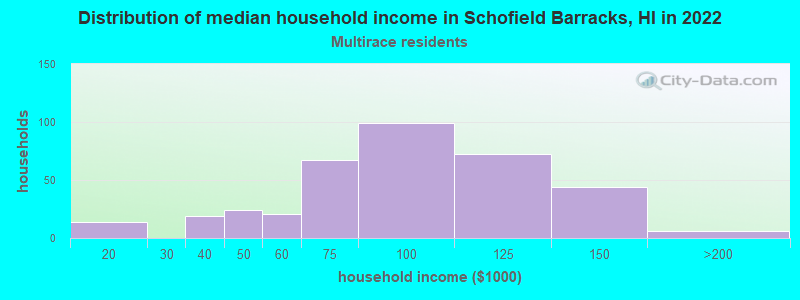
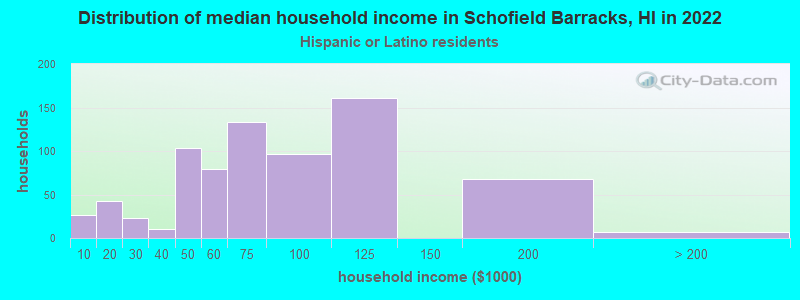
Income and house value in Schofield Barracks Median household income in 2022 $70,720 White non-Hispanic householders$50,118 Black householders$74,610 Native Hawaiian and other Pacific Islander householders$50,844 Some other race householders$86,246 Two or more races householders$66,747 Hispanic or Latino race householdersMedian 2022 house value $-700,552,751 Black or African American householders
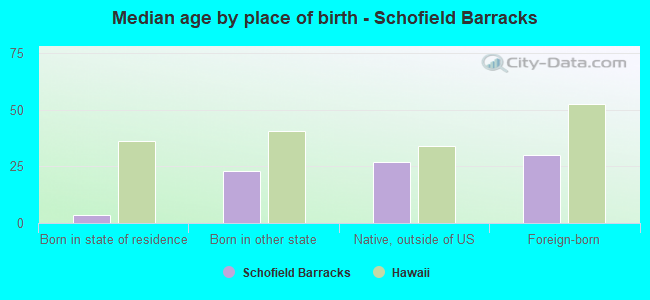
Median age by race in Schofield Barracks
23.2 Median age for White residents23.5 22.1 24.0 Median age for Black or African American residents23.5 24.9 22.3 Median age for American Indian / Alaska Native residents25.2 19.2 27.8 Median age for Asian residents23.9 30.4 22.6 Median age for Native Hawaiian / Pacific Islander residents21.8 24.8 20.3 Median age for Other race residents20.0 25.4 20.1 Median age for Two or more races residents19.9 18.2 23.8 Median age for White alone residents24.2 22.5 21.5 Median age for Hispanic or Latino residents21.7 21.6
Owner/renter occupied households by race in Schofield Barracks
House owners and renters - White residents 2,340 100.0% Renter occupiedHouse owners and renters - Black or African American residents 981 100.0% Renter occupiedHouse owners and renters - American Indian / Alaska Native residents 15 100.0% Renter occupiedHouse owners and renters - Asian residents 10 5.7% Owner occupied168 94.3% Renter occupiedHouse owners and renters - Native Hawaiian / Pacific Islander residents 136 100.0% Renter occupiedHouse owners and renters - Other race residents 123 100.0% Renter occupiedHouse owners and renters - Two or more races residents 343 100.0% Renter occupiedHouse owners and renters - White alone residents 2,093 100.0% Renter occupiedHouse owners and renters - Hispanic or Latino residents 742 100.0% Renter occupied
Language usage in Schofield Barracks
English speakers - Total 83.2% of residents of Schofield Barracks speak English at home.
10.2% of residents speak Spanish at home 1,174 75.9% Speak English very well373 24.1% Speak English less than very well7.9% of residents speak other language at home 750 62.2% Speak English very well456 37.8% Speak English less than very well
English speakers - Born in the United States 90.0% of residents of Schofield Barracks speak English at home.
7.3% of residents speak Spanish at home 755 80.9% Speak English very well178 19.1% Speak English less than very well2.8% of residents speak other language at home 271 74.9% Speak English very well91 25.1% Speak English less than very well
English speakers - Native, born elsewhere 52.6% of residents of Schofield Barracks speak English at home.
40.4% of residents speak Spanish at home 255 69.7% Speak English very well111 30.3% Speak English less than very well7.5% of residents speak other language at home 61 89.7% Speak English very well7 10.3% Speak English less than very well
English speakers - Foreign-born 14.7% of residents of Schofield Barracks speak English at home.
15.9% of residents speak Spanish at home 101 65.6% Speak English very well53 34.4% Speak English less than very well69.2% of residents speak other language at home 392 58.7% Speak English very well276 41.3% Speak English less than very well
White (Caucasian) - Speak only English Native:
93.0% (7,690)Foreign-born:
43.5% (50)
White (Caucasian) - Speak another language Native:
6.6% (549)Foreign-born:
55.0% (64)
Black or African American - Speak only English Native:
91.5% (2,411)Foreign-born:
25.7% (10)
Black or African American - Speak another language Native:
7.3% (192)Foreign-born:
100.0% (38)
American Indian / Alaska Native - Speak another language Native:
14.7% (23)Foreign-born:
100.0% (8)
Asian - Speak only English Native:
44.9% (157)Foreign-born:
7.4% (32)
Asian - Speak another language Native:
52.2% (183)Foreign-born:
92.6% (398)
Native Hawaiian / Pacific Islander - Speak only English Native:
78.6% (173)Foreign-born:
14.8% (34)
Native Hawaiian / Pacific Islander - Speak another language Native:
21.0% (46)Foreign-born:
85.0% (198)
Other race - Speak another language Native:
55.7% (441)Foreign-born:
98.0% (47)
Two or more races - Speak only English Native:
85.8% (1,232)Foreign-born:
19.4% (17)
Two or more races - Speak another language Native:
14.3% (206)Foreign-born:
80.3% (72)
White alone - Speak only English Native:
97.0% (7,138)Foreign-born:
66.0% (51)
White alone - Speak another language Native:
3.2% (232)Foreign-born:
34.1% (26)
Hispanic or Latino - Speak another language Native:
46.3% (1,303)Foreign-born:
95.6% (140)
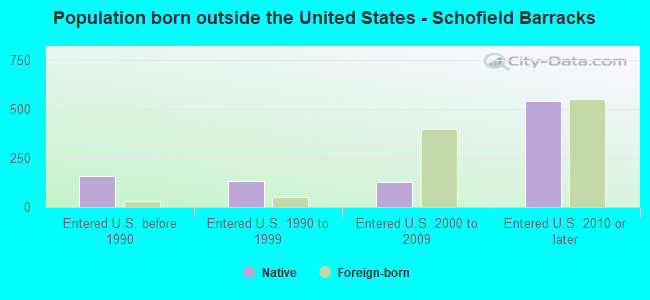
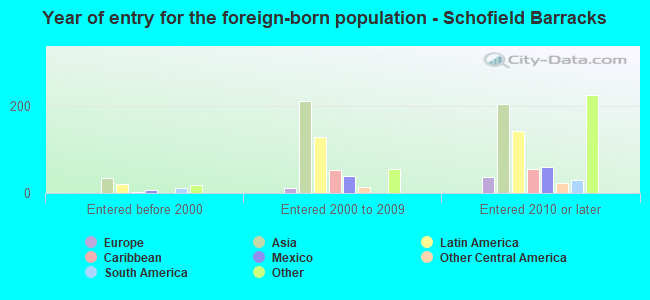
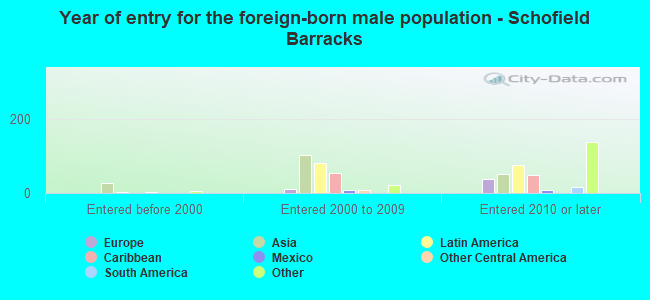
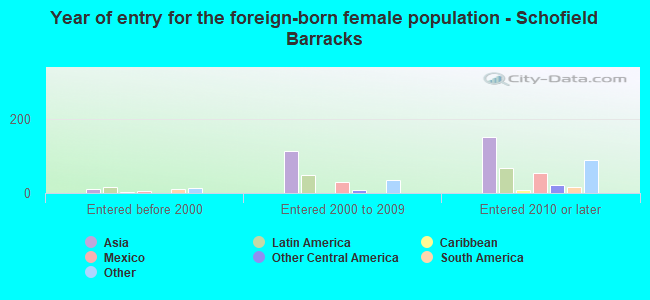
Foreign-born residents in Schofield Barracks 1,049 residents are foreign born (2.6% Asia , 1.4% Oceania , 1.3% Latin America ).
This city:
5.9%Hawaii:
18.0%
Marital status for residents in Schofield Barracks Marital status - White (Caucasian) population 15 years and over
Males 51.6% Never married44.8% Now married0.6% Separated0.0% Widowed2.9% DivorcedFemales 17.0% Never married77.5% Now married1.5% Separated0.2% Widowed3.7% DivorcedWomen who gave birth in the past 12 months Now married:
98.6% (320)Unmarried:
1.4% (5)
Women who did not give birth in the past 12 months Now married:
75.1% (1,104)Unmarried:
24.9% (366)
Marital status - Black or African American population 15 years and over
Males 51.5% Never married46.0% Now married1.8% Separated0.0% Widowed0.7% DivorcedFemales 26.4% Never married61.8% Now married0.0% Separated0.7% Widowed11.1% DivorcedWomen who gave birth in the past 12 months Now married:
88.4% (73)Unmarried:
11.6% (10)
Women who did not give birth in the past 12 months Now married:
59.6% (530)Unmarried:
40.4% (359)
Marital status - American Indian / Alaska Native population 15 years and over
Males 65.5% Never married34.5% Now married0.0% Separated0.0% Widowed0.0% DivorcedFemales 38.2% Never married61.8% Now married0.0% Separated0.0% Widowed0.0% DivorcedWomen who did not give birth in the past 12 months Now married:
61.8% (55)Unmarried:
38.2% (34)
Marital status - Asian population 15 years and over
Males 57.2% Never married42.8% Now married0.0% Separated0.0% Widowed0.0% DivorcedFemales 16.4% Never married76.7% Now married0.0% Separated5.1% Widowed1.8% DivorcedWomen who gave birth in the past 12 months Now married:
100.0% (11)Unmarried:
0.0% (0)
Women who did not give birth in the past 12 months Now married:
80.1% (233)Unmarried:
19.9% (58)
Marital status - Native Hawaiian / Pacific Islander population 15 years and over
Males 22.7% Never married77.3% Now married0.0% Separated0.0% Widowed0.0% DivorcedFemales 12.7% Never married87.3% Now married0.0% Separated0.0% Widowed0.0% DivorcedWomen who gave birth in the past 12 months Now married:
100.0% (22)Unmarried:
0.0% (0)
Women who did not give birth in the past 12 months Now married:
84.6% (88)Unmarried:
15.4% (16)
Marital status - Other race population 15 years and over
Males 78.9% Never married18.2% Now married1.8% Separated0.0% Widowed1.1% DivorcedFemales 36.7% Never married51.4% Now married2.8% Separated0.0% Widowed9.0% DivorcedWomen who gave birth in the past 12 months Now married:
100.0% (7)Unmarried:
0.0% (0)
Women who did not give birth in the past 12 months Now married:
50.6% (104)Unmarried:
49.4% (101)
Marital status - Two or more races population 15 years and over
Males 48.0% Never married50.1% Now married0.0% Separated0.0% Widowed1.9% DivorcedFemales 19.8% Never married77.1% Now married0.0% Separated0.0% Widowed3.1% DivorcedWomen who gave birth in the past 12 months Now married:
100.0% (74)Unmarried:
0.0% (0)
Women who did not give birth in the past 12 months Now married:
74.0% (326)Unmarried:
26.0% (115)
Marital status - White alone, not Hispanic / Latino population 15 years and over
Males 52.3% Never married44.3% Now married0.6% Separated0.0% Widowed2.7% DivorcedFemales 18.0% Never married75.7% Now married1.7% Separated0.2% Widowed4.4% DivorcedWomen who gave birth in the past 12 months Now married:
98.3% (276)Unmarried:
1.7% (5)
Women who did not give birth in the past 12 months Now married:
73.1% (928)Unmarried:
26.9% (341)
Marital status - Hispanic or Latino population 15 years and over
Males 51.5% Never married43.5% Now married2.3% Separated0.0% Widowed2.7% DivorcedFemales 19.7% Never married77.6% Now married0.7% Separated0.0% Widowed2.0% DivorcedWomen who gave birth in the past 12 months Now married:
100.0% (95)Unmarried:
0.0% (0)
Women who did not give birth in the past 12 months Now married:
75.2% (528)Unmarried:
24.8% (174)
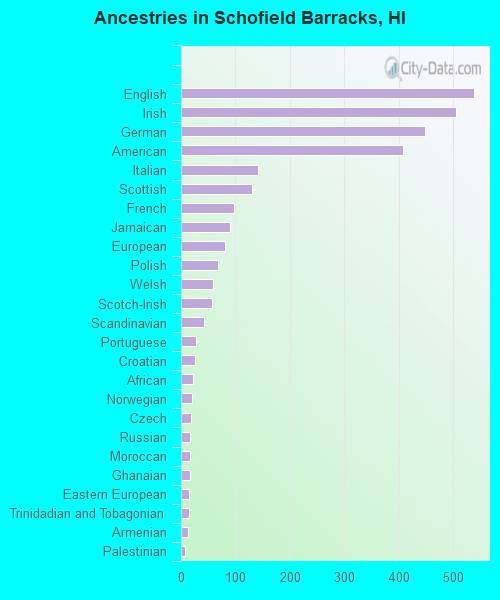
Ancestries in Schofield Barracks
539 5.0% English505 4.7% Irish449 4.1% German408 3.8% American142 1.3% Italian131 1.2% Scottish98 0.9% French90 0.8% Jamaican80 0.7% European68 0.6% Polish59 0.5% Welsh57 0.5% Scotch-Irish42 0.4% Scandinavian28 0.3% Portuguese25 0.2% Croatian22 0.2% African21 0.2% Norwegian18 0.2% Czech17 0.2% Russian16 0.1% Moroccan16 0.1% Ghanaian15 0.1% Eastern European14 0.1% Trinidadian and Tobagonian12 0.1% Armenian8 0.07% Palestinian6 0.06% Haitian3 0.03% Canadian2 0.02% Czechoslovakian
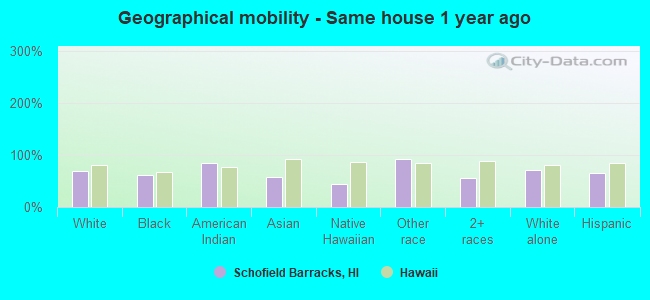
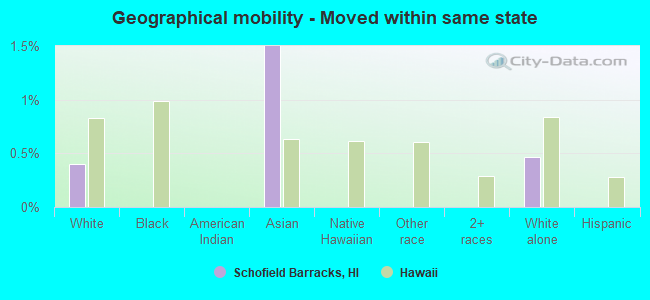
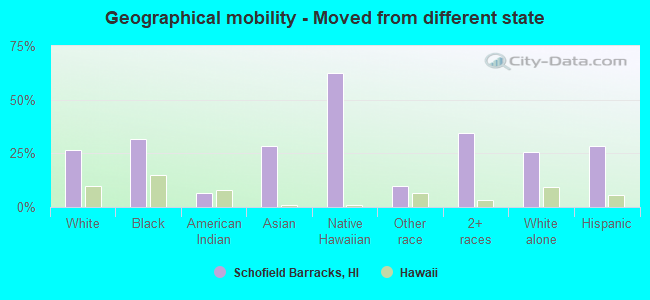
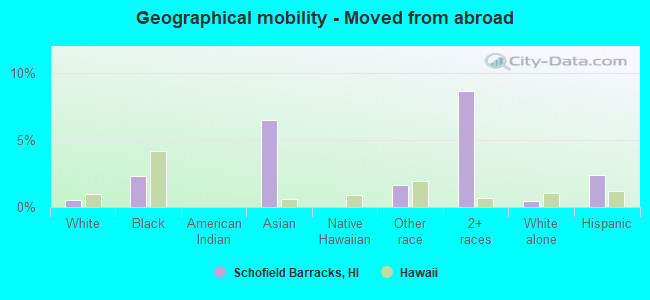
Geographical mobility in Schofield Barracks Same house 1 year ago 6,672 70.1% White (Caucasian)1,822 61.5% Black or African American136 85.5% American Indian / Alaska Native543 57.9% Asian209 43.5% Native Hawaiian / Pacific Islander785 92.3% Other race1,055 55.4% Two or more races5,763 70.4% White alone, not Hispanic / Latino2,386 66.2% Hispanic or LatinoMoved within same county 396 4.2% White / Caucasian192 6.5% Black or African American22 13.7% American Indian / Alaska Native55 5.9% Asian5 0.6% Other race128 6.7% Two or more races361 4.4% White alone, not Hispanic / Latino131 3.6% Hispanic or LatinoMoved within same state 38 0.4% White / Caucasian15 1.6% Asian38 0.5% White alone, not Hispanic / LatinoMoved from different state 2,519 26.5% White / Caucasian937 31.6% Black or African American11 6.7% American Indian / Alaska Native267 28.5% Asian300 62.4% Native Hawaiian / Pacific Islander83 9.8% Other race654 34.4% Two or more races2,115 25.9% White alone, not Hispanic / Latino1,030 28.6% Hispanic or LatinoMoved from abroad 50 0.5% White68 2.3% Black or African American61 6.5% Asian14 1.7% Other race165 8.7% Two or more races39 0.5% White alone, not Hispanic / Latino86 2.4% Hispanic or Latino
Children Nativity (place of birth) in Schofield Barracks
Children under 6 years - Living with two parents Both parents native 1,925 99.7% Native6 0.3% Foreign-bornBoth parents foreign-born 202 87.9% Native28 12.1% Foreign-bornOne native, one foreign-born parent 318 100.0% NativeChildren under 6 years - Living with one parent Native parent 348 100.0% NativeForeign-born parent 6 100.0% NativeChildren 6 to 17 years - Living with two parents Both parents native 1,619 99.8% Native4 0.2% Foreign-bornBoth parents foreign-born 35 82.3% Native8 17.7% Foreign-bornOne native, one foreign-born parent 255 95.4% Native12 4.6% Foreign-bornChildren 6 to 17 years - Living with one parent Native parent 153 100.0% Native
Grandparents responsible for own grandchildren in Schofield Barracks
Grandparents (30 to 59 years) White / Caucasian 5 100.0% Not responsible for grandchildrenBlack or African American 12 100.0% Not responsible for grandchildrenWhite alone, not Hispanic / Latino 6 100.0% Not responsible for grandchildren
Grandparents (60 years and over)