Races in Seabrook, Texas (TX) Detailed Stats
Data:
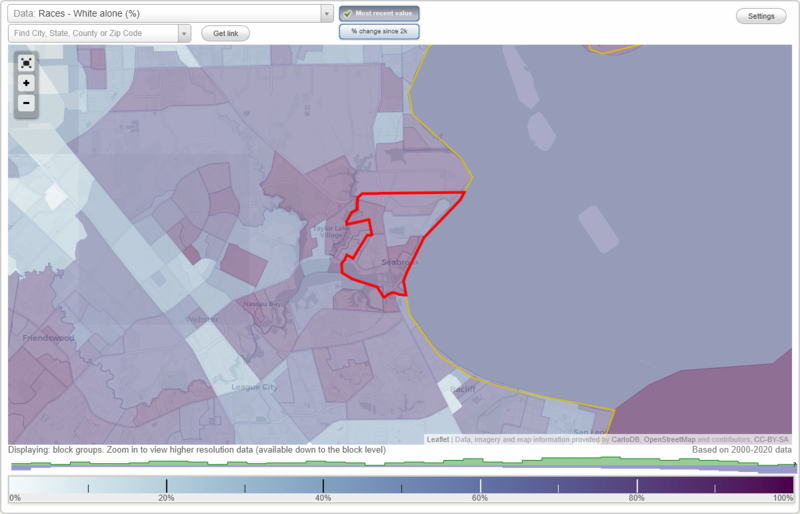
Races - White alone (%)
Races - White alone (% change since 2000)
Races - Black alone (%)
Races - Black alone (% change since 2000)
Races - American Indian alone (%)
Races - American Indian alone (% change since 2000)
Races - Asian alone (%)
Races - Asian alone (% change since 2000)
Races - Hispanic (%)
Races - Hispanic (% change since 2000)
Races - Native Hawaiian and Other Pacific Islander alone (%)
Races - Native Hawaiian and Other Pacific Islander alone (% change since 2000)
Races - Two or more races(%)
Races - Two or more races(% change since 2000)
Races - Other race alone (%)
Races - Other race alone (% change since 2000)
Racial diversity
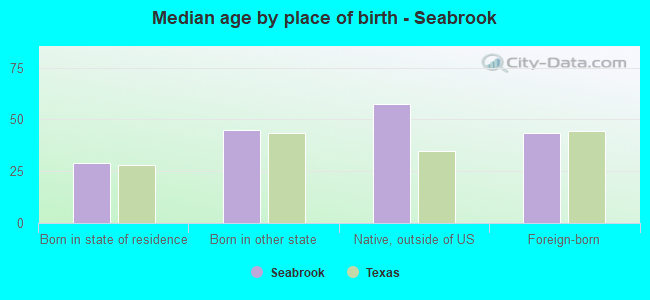
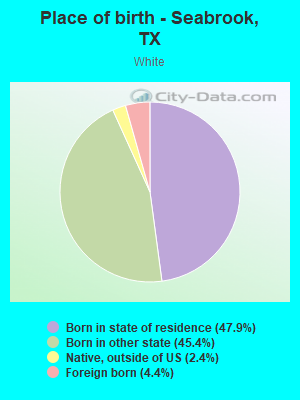
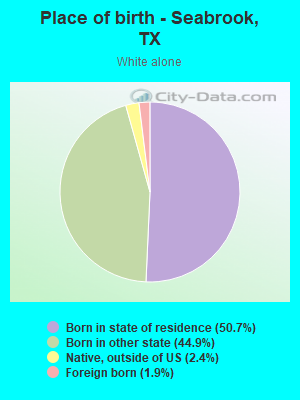
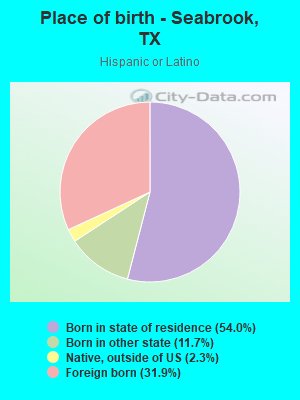
Place of birth - Born in state of residence (%)
Place of birth - Born in state of residence (%) - White
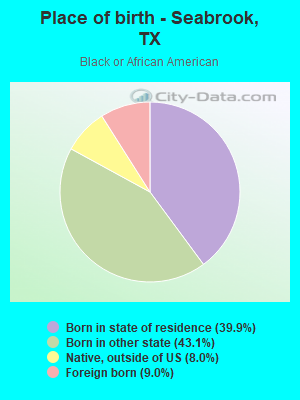
Place of birth - Born in state of residence (%) - Black or African American
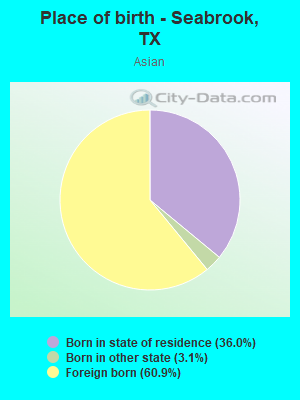
Place of birth - Born in state of residence (%) - Asian
Place of birth - Born in state of residence (%) - Hispanic or Latino
Place of birth - Born in state of residence (%) - American Indian and Alaska Native
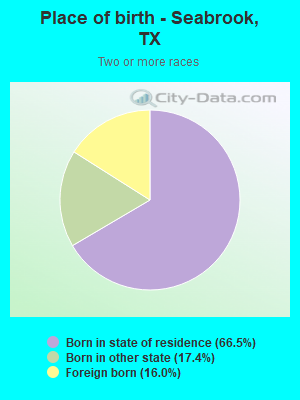
Place of birth - Born in state of residence (%) - Multirace
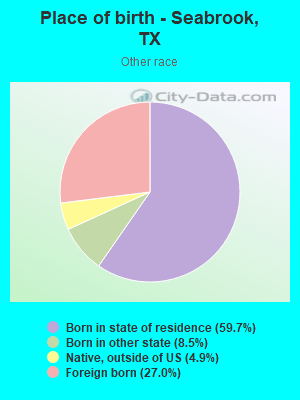
Place of birth - Born in state of residence (%) - Other Race
Place of birth - Born in other state (%)
Place of birth - Born in other state (%) - White
Place of birth - Born in other state (%) - Black or African American
Place of birth - Born in other state (%) - Asian
Place of birth - Born in other state (%) - Hispanic or Latino
Place of birth - Born in other state (%) - American Indian and Alaska Native
Place of birth - Born in other state (%) - Multirace
Place of birth - Born in other state (%) - Other Race
Place of birth - Native, outside of US (%)
Place of birth - Native, outside of US (%) - White
Place of birth - Native, outside of US (%) - Black or African American
Place of birth - Native, outside of US (%) - Asian
Place of birth - Native, outside of US (%) - Hispanic or Latino
Place of birth - Native, outside of US (%) - American Indian and Alaska Native
Place of birth - Native, outside of US (%) - Multirace
Place of birth - Native, outside of US (%) - Other Race
Place of birth - Foreign born (%)
Place of birth - Foreign born (%) - White
Place of birth - Foreign born (%) - Black or African American
Place of birth - Foreign born (%) - Asian
Place of birth - Foreign born (%) - Hispanic or Latino
Place of birth - Foreign born (%) - American Indian and Alaska Native
Place of birth - Foreign born (%) - Multirace
Place of birth - Foreign born (%) - Other Race
Residents speaking English at home (%)
Residents speaking English at home - Born in the United States (%)
Residents speaking English at home - Native, born elsewhere (%)
Residents speaking English at home - Foreign born (%)
Residents speaking Spanish at home (%)
Residents speaking Spanish at home - Born in the United States (%)
Residents speaking Spanish at home - Native, born elsewhere (%)
Residents speaking Spanish at home - Foreign born (%)
Residents speaking other language at home (%)
Residents speaking other language at home - Born in the United States (%)
Residents speaking other language at home - Native, born elsewhere (%)
Residents speaking other language at home - Foreign born (%)
Marital status - Never married (%)
Marital status - Now married (%)
Marital status - Separated (%)
Marital status - Widowed (%)
Marital status - Divorced (%)
Ancestries Reported - Arab (%)
Ancestries Reported - Czech (%)
Ancestries Reported - Danish (%)
Ancestries Reported - Dutch (%)
Ancestries Reported - English (%)
Ancestries Reported - French (%)
Ancestries Reported - French Canadian (%)
Ancestries Reported - German (%)
Ancestries Reported - Greek (%)
Ancestries Reported - Hungarian (%)
Ancestries Reported - Irish (%)
Ancestries Reported - Italian (%)
Ancestries Reported - Lithuanian (%)
Ancestries Reported - Norwegian (%)
Ancestries Reported - Polish (%)
Ancestries Reported - Portuguese (%)
Ancestries Reported - Russian (%)
Ancestries Reported - Scotch-Irish (%)
Ancestries Reported - Scottish (%)
Ancestries Reported - Slovak (%)
Ancestries Reported - Subsaharan African (%)
Ancestries Reported - Swedish (%)
Ancestries Reported - Swiss (%)
Ancestries Reported - Ukrainian (%)
Ancestries Reported - United States (%)
Ancestries Reported - Welsh (%)
Ancestries Reported - West Indian (%)
Ancestries Reported - Other (%)
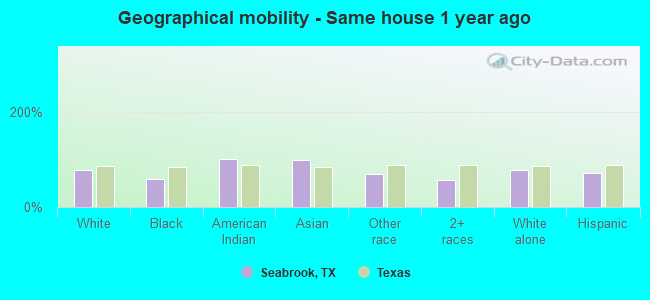
Geographical mobility - Same house 1 year ago (%)
Geographical mobility - Same house 1 year ago (%) - White
Geographical mobility - Same house 1 year ago (%) - Black or African American
Geographical mobility - Same house 1 year ago (%) - Asian
Geographical mobility - Same house 1 year ago (%) - Hispanic or Latino
Geographical mobility - Same house 1 year ago (%) - American Indian and Alaska Native
Geographical mobility - Same house 1 year ago (%) - Multirace
Geographical mobility - Same house 1 year ago (%) - Other Race
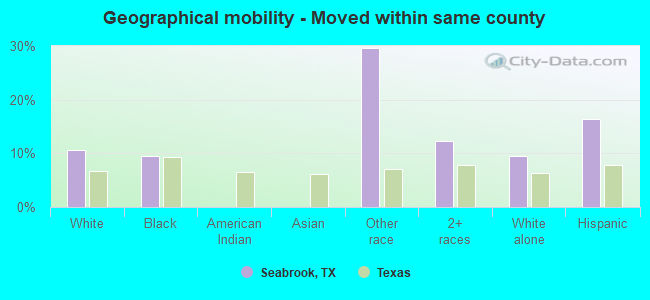
Geographical mobility - Moved within same county (%)
Geographical mobility - Moved within same county (%) - White
Geographical mobility - Moved within same county (%) - Black or African American
Geographical mobility - Moved within same county (%) - Asian
Geographical mobility - Moved within same county (%) - Hispanic or Latino
Geographical mobility - Moved within same county (%) - American Indian and Alaska Native
Geographical mobility - Moved within same county (%) - Multirace
Geographical mobility - Moved within same county (%) - Other Race
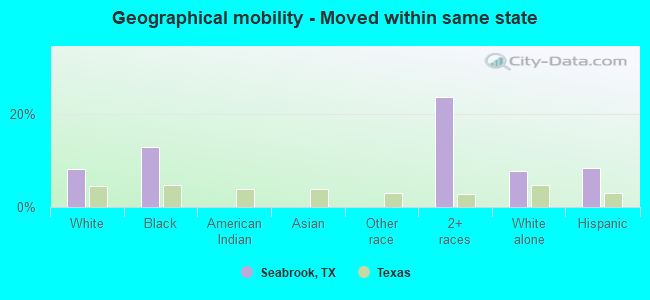
Geographical mobility - Moved from different county within same state (%)
Geographical mobility - Moved from different county within same state (%) - White
Geographical mobility - Moved from different county within same state (%) - Black or African American
Geographical mobility - Moved from different county within same state (%) - Asian
Geographical mobility - Moved from different county within same state (%) - Hispanic or Latino
Geographical mobility - Moved from different county within same state (%) - American Indian and Alaska Native
Geographical mobility - Moved from different county within same state (%) - Multirace
Geographical mobility - Moved from different county within same state (%) - Other Race
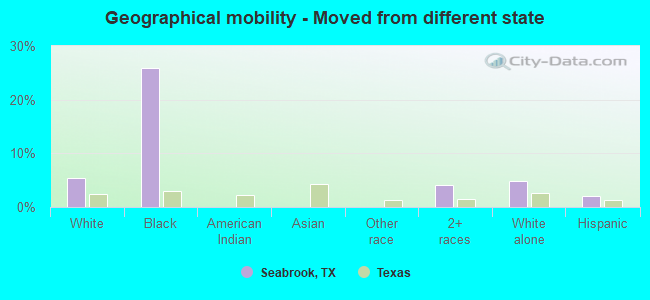
Geographical mobility - Moved from different state (%)
Geographical mobility - Moved from different state (%) - White
Geographical mobility - Moved from different state (%) - Black or African American
Geographical mobility - Moved from different state (%) - Asian
Geographical mobility - Moved from different state (%) - Hispanic or Latino
Geographical mobility - Moved from different state (%) - American Indian and Alaska Native
Geographical mobility - Moved from different state (%) - Multirace
Geographical mobility - Moved from different state (%) - Other Race
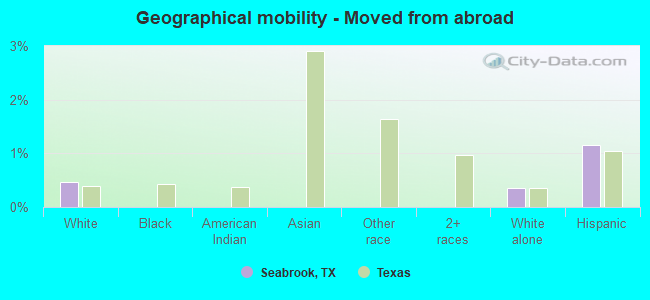
Geographical mobility - Moved from abroad (%)
Geographical mobility - Moved from abroad (%) - White
Geographical mobility - Moved from abroad (%) - Black or African American
Geographical mobility - Moved from abroad (%) - Asian
Geographical mobility - Moved from abroad (%) - Hispanic or Latino
Geographical mobility - Moved from abroad (%) - American Indian and Alaska Native
Geographical mobility - Moved from abroad (%) - Multirace
Geographical mobility - Moved from abroad (%) - Other Race
Place of birth for the foreign-born population - Ireland (%)
Place of birth for the foreign-born population - Denmark (%)
Place of birth for the foreign-born population - Norway (%)
Place of birth for the foreign-born population - Sweden (%)
Place of birth for the foreign-born population - United Kingdom (%)
Place of birth for the foreign-born population - England (%)
Place of birth for the foreign-born population - Scotland (%)
Place of birth for the foreign-born population - Other Northern Europe (%)
Place of birth for the foreign-born population - Austria (%)
Place of birth for the foreign-born population - Belgium (%)
Place of birth for the foreign-born population - France (%)
Place of birth for the foreign-born population - Germany (%)
Place of birth for the foreign-born population - Netherlands (%)
Place of birth for the foreign-born population - Switzerland (%)
Place of birth for the foreign-born population - Other Western Europe (%)
Place of birth for the foreign-born population - Greece (%)
Place of birth for the foreign-born population - Italy (%)
Place of birth for the foreign-born population - Portugal (%)
Place of birth for the foreign-born population - Spain (%)
Place of birth for the foreign-born population - Other Southern Europe (%)
Place of birth for the foreign-born population - Albania (%)
Place of birth for the foreign-born population - Belarus (%)
Place of birth for the foreign-born population - Bosnia and Herzegovina (%)
Place of birth for the foreign-born population - Bulgaria (%)
Place of birth for the foreign-born population - Croatia (%)
Place of birth for the foreign-born population - Czechoslovakia (%)
Place of birth for the foreign-born population - Hungary (%)
Place of birth for the foreign-born population - Latvia (%)
Place of birth for the foreign-born population - Lithuania (%)
Place of birth for the foreign-born population - North Macedonia (Macedonia) (%)
Place of birth for the foreign-born population - Moldova (%)
Place of birth for the foreign-born population - Poland (%)
Place of birth for the foreign-born population - Romania (%)
Place of birth for the foreign-born population - Russia (%)
Place of birth for the foreign-born population - Serbia (%)
Place of birth for the foreign-born population - Ukraine (%)
Place of birth for the foreign-born population - Other Eastern Europe (%)
Place of birth for the foreign-born population - China (%)
Place of birth for the foreign-born population - Hong Kong (%)
Place of birth for the foreign-born population - Taiwan (%)
Place of birth for the foreign-born population - Japan (%)
Place of birth for the foreign-born population - Korea (%)
Place of birth for the foreign-born population - Other Eastern Asia (%)
Place of birth for the foreign-born population - Afghanistan (%)
Place of birth for the foreign-born population - Bangladesh (%)
Place of birth for the foreign-born population - India (%)
Place of birth for the foreign-born population - Iran (%)
Place of birth for the foreign-born population - Kazakhstan (%)
Place of birth for the foreign-born population - Nepal (%)
Place of birth for the foreign-born population - Pakistan (%)
Place of birth for the foreign-born population - Sri Lanka (%)
Place of birth for the foreign-born population - Uzbekistan (%)
Place of birth for the foreign-born population - Other South Central Asia (%)
Place of birth for the foreign-born population - Burma (%)
Place of birth for the foreign-born population - Cambodia (%)
Place of birth for the foreign-born population - Indonesia (%)
Place of birth for the foreign-born population - Laos (%)
Place of birth for the foreign-born population - Malaysia (%)
Place of birth for the foreign-born population - Philippines (%)
Place of birth for the foreign-born population - Singapore (%)
Place of birth for the foreign-born population - Thailand (%)
Place of birth for the foreign-born population - Vietnam (%)
Place of birth for the foreign-born population - Other South Eastern Asia (%)
Place of birth for the foreign-born population - Armenia (%)
Place of birth for the foreign-born population - Iraq (%)
Place of birth for the foreign-born population - Israel (%)
Place of birth for the foreign-born population - Jordan (%)
Place of birth for the foreign-born population - Kuwait (%)
Place of birth for the foreign-born population - Lebanon (%)
Place of birth for the foreign-born population - Saudi Arabia (%)
Place of birth for the foreign-born population - Syria (%)
Place of birth for the foreign-born population - Turkey (%)
Place of birth for the foreign-born population - Yemen (%)
Place of birth for the foreign-born population - Other Western Asia (%)
Place of birth for the foreign-born population - Eritrea (%)
Place of birth for the foreign-born population - Ethiopia (%)
Place of birth for the foreign-born population - Kenya (%)
Place of birth for the foreign-born population - Somalia (%)
Place of birth for the foreign-born population - Uganda (%)
Place of birth for the foreign-born population - Zimbabwe (%)
Place of birth for the foreign-born population - Other Eastern Africa (%)
Place of birth for the foreign-born population - Cameroon (%)
Place of birth for the foreign-born population - Congo (%)
Place of birth for the foreign-born population - Democratic Republic of Congo (Zaire) (%)
Place of birth for the foreign-born population - Other Middle Africa (%)
Place of birth for the foreign-born population - Egypt (%)
Place of birth for the foreign-born population - Morocco (%)
Place of birth for the foreign-born population - Sudan (%)
Place of birth for the foreign-born population - Other Northern Africa (%)
Place of birth for the foreign-born population - South Africa (%)
Place of birth for the foreign-born population - Other Southern Africa (%)
Place of birth for the foreign-born population - Cabo Verde (%)
Place of birth for the foreign-born population - Ghana (%)
Place of birth for the foreign-born population - Liberia (%)
Place of birth for the foreign-born population - Nigeria (%)
Place of birth for the foreign-born population - Senegal (%)
Place of birth for the foreign-born population - Sierra Leone (%)
Place of birth for the foreign-born population - Other Western Africa (%)
Place of birth for the foreign-born population - Australia (%)
Place of birth for the foreign-born population - New Zealand (%)
Place of birth for the foreign-born population - Fiji (%)
Place of birth for the foreign-born population - Micronesia (%)
Place of birth for the foreign-born population - Bahamas (%)
Place of birth for the foreign-born population - Barbados (%)
Place of birth for the foreign-born population - Cuba (%)
Place of birth for the foreign-born population - Dominica (%)
Place of birth for the foreign-born population - Dominican Republic (%)
Place of birth for the foreign-born population - Grenada (%)
Place of birth for the foreign-born population - Haiti (%)
Place of birth for the foreign-born population - Jamaica (%)
Place of birth for the foreign-born population - St. Vincent and the Grenadines (%)
Place of birth for the foreign-born population - Trinidad and Tobago (%)
Place of birth for the foreign-born population - West Indies (%)
Place of birth for the foreign-born population - Other Caribbean (%)
Place of birth for the foreign-born population - Belize (%)
Place of birth for the foreign-born population - Costa Rica (%)
Place of birth for the foreign-born population - El Salvador (%)
Place of birth for the foreign-born population - Guatemala (%)
Place of birth for the foreign-born population - Honduras (%)
Place of birth for the foreign-born population - Mexico (%)
Place of birth for the foreign-born population - Nicaragua (%)
Place of birth for the foreign-born population - Panama (%)
Place of birth for the foreign-born population - Other Central America (%)
Place of birth for the foreign-born population - Argentina (%)
Place of birth for the foreign-born population - Bolivia (%)
Place of birth for the foreign-born population - Brazil (%)
Place of birth for the foreign-born population - Chile (%)
Place of birth for the foreign-born population - Colombia (%)
Place of birth for the foreign-born population - Ecuador (%)
Place of birth for the foreign-born population - Guyana (%)
Place of birth for the foreign-born population - Peru (%)
Place of birth for the foreign-born population - Uruguay (%)
Place of birth for the foreign-born population - Venezuela (%)
Place of birth for the foreign-born population - Other South America (%)
Place of birth for the foreign-born population - Canada (%)
Place of birth for the foreign-born population - Other Northern America (%)
Place of birth for the foreign-born population - Other (%)
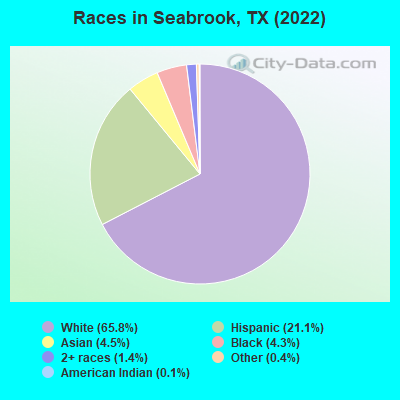
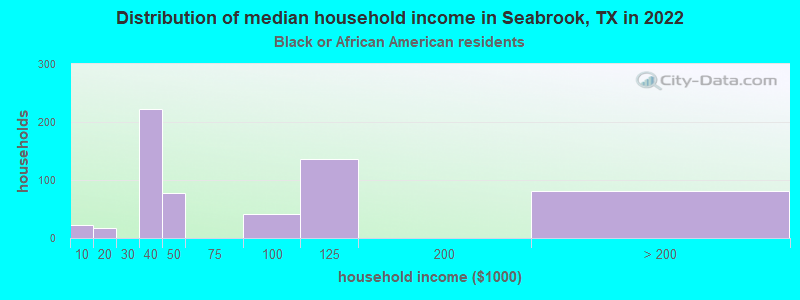
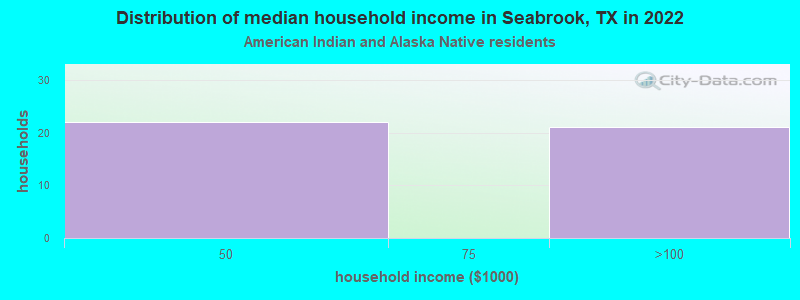
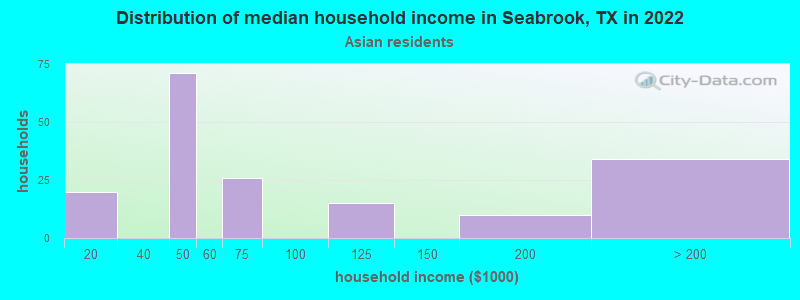
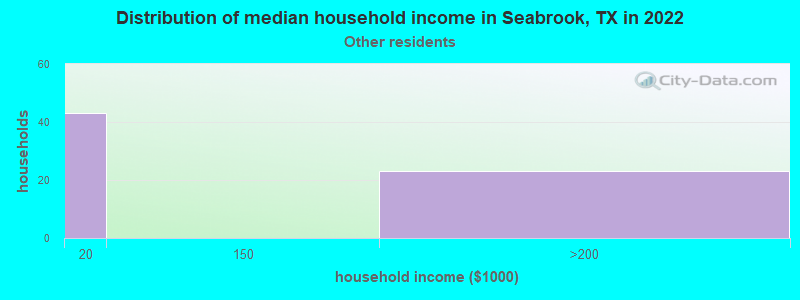
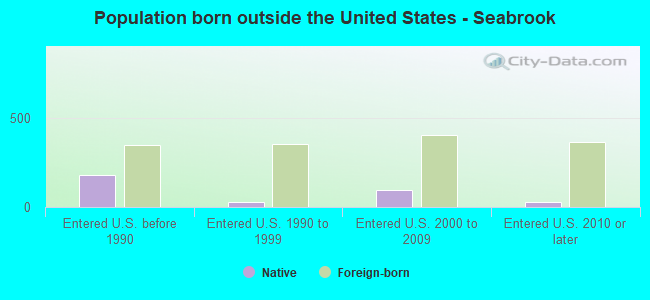
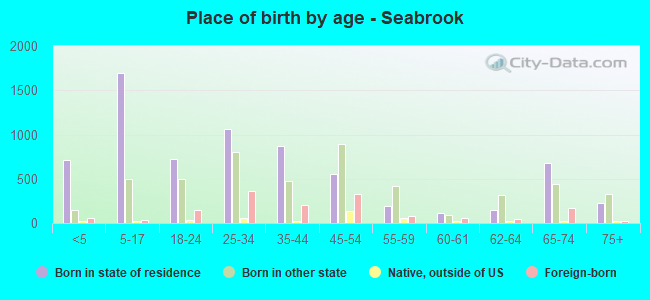
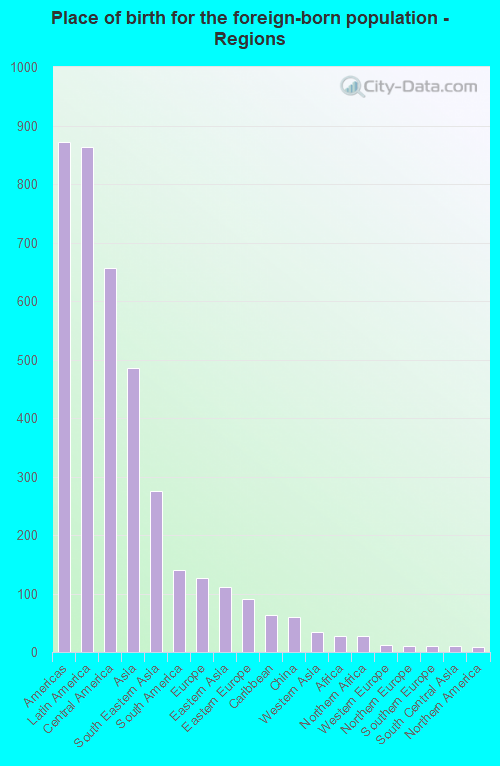
According to 2022 data, the most numerous races in Seabrook, TX are Hispanic (2,888 residents), White alone (9,023 residents), and Black alone (585 residents). 79.0% of Seabrook residents speak English at home. 11.0% of Seabrook, TX residents are foreign-born (6.2% born in Latin America, 3.5% born in Asia), which is 54.1% less than the foreign-born rate of 17.0% across the entire state of Texas.
Race distribution in Seabrook
2000 2022
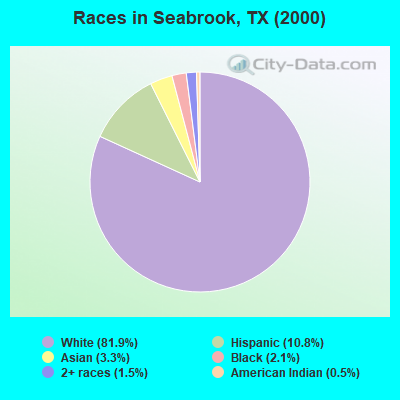
10,933,313 52.4% White alone 6,669,666 32.0% Hispanic 2,364,255 11.3% Black alone 554,445 2.7% Asian alone 230,567 1.1% Two or more races 68,859 0.3% American Indian alone 19,958 0.10% Other race alone 10,757 0.05% Native Hawaiian and Other
12,070,642 40.2% Hispanic 11,683,430 38.9% White alone 3,508,706 11.7% Black alone 1,608,173 5.4% Asian alone 956,560 3.2% Two or more races 125,763 0.4% Other race alone 47,023 0.2% American Indian alone 29,275 0.10% Native Hawaiian and Other
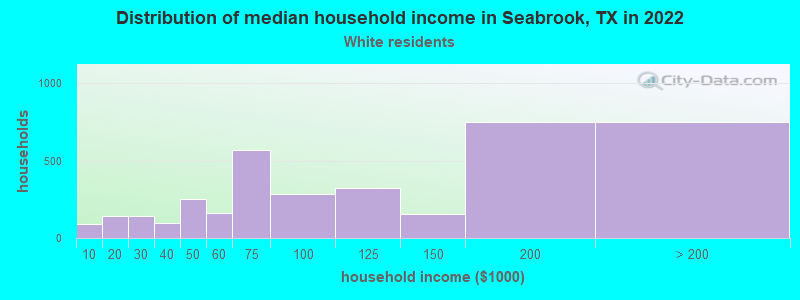
Income and house value in Seabrook Median household income in 2022 $101,264 White non-Hispanic householders$70,610 Asian householders$60,078 Hispanic or Latino race householdersMedian 2022 house value $357,075 White Non-Hispanic householders$360,406 Black or African American householders $425,522 Asian householders$309,223 Some other race householders$227,147 Two or more races householders$349,201 Hispanic or Latino householders
Median age by race in Seabrook
41.0 Median age for White residents42.6 39.7 29.7 Median age for Black or African American residents29.7 20.2 24.7 Median age for American Indian / Alaska Native residents-598,187,310.6 -652,037,616.9 36.3 Median age for Asian residents43.2 20.3 -782,795,698.1 Median age for Native Hawaiian / Pacific Islander residents-633,771,929.2 -816,367,264.7 17.2 Median age for Other race residents25.1 17.0 30.9 Median age for Two or more races residents72.0 27.7 42.8 Median age for White alone residents44.2 38.8 27.0 Median age for Hispanic or Latino residents25.6 29.4
Owner/renter occupied households by race in Seabrook
House owners and renters - White residents 2,404 65.7% Owner occupied1,254 34.3% Renter occupiedHouse owners and renters - Black or African American residents 60 10.4% Owner occupied517 89.6% Renter occupiedHouse owners and renters - American Indian / Alaska Native residents 25 58.0% Owner occupied18 42.0% Renter occupiedHouse owners and renters - Asian residents 126 75.8% Owner occupied40 24.2% Renter occupiedHouse owners and renters - Other race residents 18 27.5% Owner occupied48 72.5% Renter occupiedHouse owners and renters - Two or more races residents 270 62.2% Owner occupied164 37.8% Renter occupiedHouse owners and renters - White alone residents 2,604 65.4% Owner occupied1,380 34.6% Renter occupiedHouse owners and renters - Hispanic or Latino residents 313 41.5% Owner occupied441 58.5% Renter occupied
Language usage in Seabrook
English speakers - Total 79.0% of residents of Seabrook speak English at home.
15.1% of residents speak Spanish at home 1,629 84.1% Speak English very well309 15.9% Speak English less than very well5.0% of residents speak other language at home 433 67.4% Speak English very well209 32.6% Speak English less than very well
English speakers - Born in the United States 93.1% of residents of Seabrook speak English at home.
5.9% of residents speak Spanish at home 273 96.1% Speak English very well11 3.9% Speak English less than very well0.7% of residents speak other language at home 34 100.0% Speak English less than very well
English speakers - Native, born elsewhere 40.7% of residents of Seabrook speak English at home.
20.7% of residents speak Spanish at home 30 44.1% Speak English very well38 55.9% Speak English less than very well40.7% of residents speak other language at home 134 100.0% Speak English very well
English speakers - Foreign-born 20.1% of residents of Seabrook speak English at home.
49.2% of residents speak Spanish at home 568 79.0% Speak English very well151 21.0% Speak English less than very well29.6% of residents speak other language at home 258 59.6% Speak English very well175 40.4% Speak English less than very well
White (Caucasian) - Speak only English Native:
98.7% (7,948)Foreign-born:
34.7% (131)
White (Caucasian) - Speak another language Native:
6.9% (559)Foreign-born:
69.8% (264)
Black or African American - Speak only English Native:
83.0% (522)Foreign-born:
87.6% (55)
Asian - Speak only English Native:
94.7% (239)Foreign-born:
16.2% (62)
Asian - Speak another language Native:
6.2% (16)Foreign-born:
83.9% (323)
Other race - Speak another language Native:
59.9% (81)Foreign-born:
100.0% (105)
Two or more races - Speak another language Native:
27.4% (182)Foreign-born:
100.0% (123)
White alone - Speak only English Native:
96.3% (7,927)Foreign-born:
43.1% (77)
White alone - Speak another language Native:
3.6% (299)Foreign-born:
57.4% (102)
Hispanic or Latino - Speak only English Native:
40.9% (747)Foreign-born:
17.4% (151)
Hispanic or Latino - Speak another language Native:
58.8% (1,073)Foreign-born:
83.1% (720)
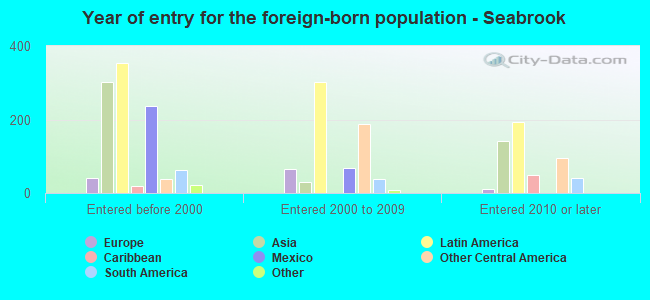
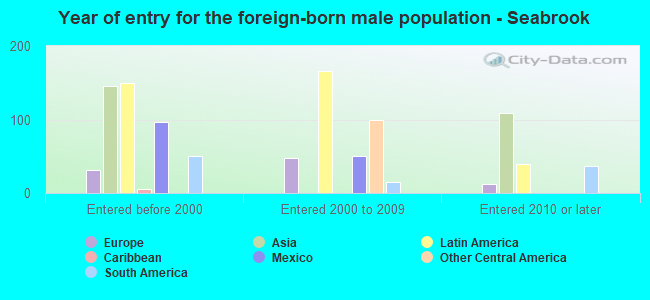
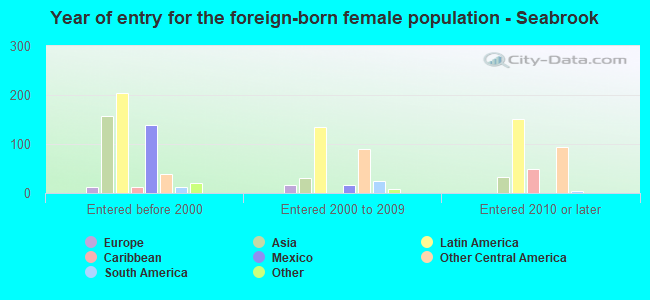
Foreign-born residents in Seabrook 1,513 residents are foreign born (6.2% Latin America , 3.5% Asia ).
This city:
11.0%Texas:
17.1%
Marital status for residents in Seabrook Marital status - White (Caucasian) population 15 years and over
Males 29.3% Never married50.2% Now married1.2% Separated0.6% Widowed18.7% DivorcedFemales 27.5% Never married49.9% Now married0.9% Separated5.5% Widowed16.1% DivorcedWomen who gave birth in the past 12 months Now married:
49.6% (79)Unmarried:
50.4% (80)
Women who did not give birth in the past 12 months Now married:
42.4% (749)Unmarried:
57.6% (1,017)
Marital status - Black or African American population 15 years and over
Males 79.0% Never married14.1% Now married0.0% Separated6.9% Widowed0.0% DivorcedFemales 45.1% Never married41.8% Now married0.0% Separated0.0% Widowed13.1% DivorcedWomen who did not give birth in the past 12 months Now married:
31.2% (25)Unmarried:
68.8% (55)
Marital status - Asian population 15 years and over
Males 12.7% Never married79.6% Now married0.0% Separated0.0% Widowed7.7% DivorcedFemales 26.5% Never married73.5% Now married0.0% Separated0.0% Widowed0.0% DivorcedWomen who gave birth in the past 12 months Now married:
0.0% (0)Unmarried:
100.0% (28)
Women who did not give birth in the past 12 months Now married:
74.3% (76)Unmarried:
25.7% (26)
Marital status - Other race population 15 years and over
Males 56.9% Never married43.1% Now married0.0% Separated0.0% Widowed0.0% DivorcedFemales 74.5% Never married25.5% Now married0.0% Separated0.0% Widowed0.0% DivorcedWomen who gave birth in the past 12 months Now married:
13.6% (17)Unmarried:
86.4% (110)
Women who did not give birth in the past 12 months Now married:
0.0% (0)Unmarried:
100.0% (9)
Marital status - Two or more races population 15 years and over
Males 26.2% Never married26.2% Now married0.0% Separated0.0% Widowed47.7% DivorcedFemales 37.2% Never married35.5% Now married0.0% Separated0.0% Widowed27.3% DivorcedWomen who did not give birth in the past 12 months Now married:
39.8% (78)Unmarried:
60.2% (118)
Marital status - White alone, not Hispanic / Latino population 15 years and over
Males 24.1% Never married52.6% Now married1.4% Separated0.7% Widowed21.2% DivorcedFemales 25.6% Never married49.5% Now married1.1% Separated6.5% Widowed17.3% DivorcedWomen who gave birth in the past 12 months Now married:
48.6% (103)Unmarried:
51.4% (109)
Women who did not give birth in the past 12 months Now married:
42.6% (791)Unmarried:
57.4% (1,067)
Marital status - Hispanic or Latino population 15 years and over
Males 52.3% Never married37.2% Now married0.0% Separated0.0% Widowed10.5% DivorcedFemales 45.6% Never married45.3% Now married0.0% Separated0.0% Widowed9.1% DivorcedWomen who gave birth in the past 12 months Now married:
4.4% (4)Unmarried:
95.6% (89)
Women who did not give birth in the past 12 months Now married:
40.4% (297)Unmarried:
59.6% (438)
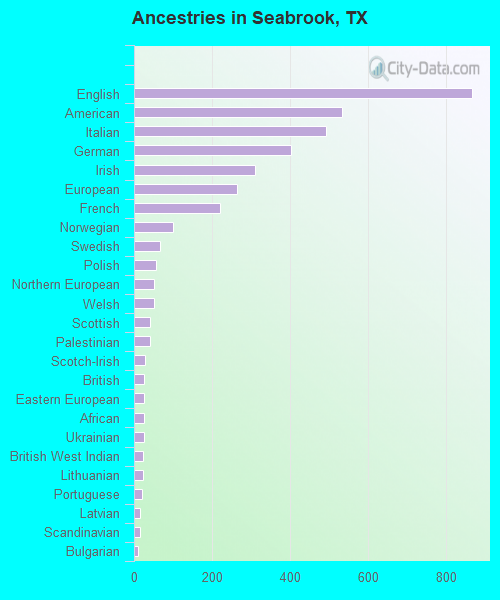
Ancestries in Seabrook
868 13.5% English533 8.3% American494 7.7% Italian402 6.2% German311 4.8% Irish265 4.1% European222 3.4% French100 1.6% Norwegian66 1.0% Swedish57 0.9% Polish52 0.8% Northern European52 0.8% Welsh42 0.7% Scottish41 0.6% Palestinian29 0.4% Scotch-Irish25 0.4% British25 0.4% Eastern European25 0.4% African25 0.4% Ukrainian23 0.4% British West Indian22 0.3% Lithuanian21 0.3% Portuguese16 0.2% Latvian15 0.2% Scandinavian11 0.2% Bulgarian9 0.1% Iranian7 0.1% Czech3 0.05% Serbian
Children Nativity (place of birth) in Seabrook
Children under 6 years - Living with two parents Both parents native 624 100.0% NativeOne native, one foreign-born parent 16 100.0% NativeChildren under 6 years - Living with one parent Native parent 206 80.0% Native51 20.0% Foreign-bornForeign-born parent 53 100.0% NativeChildren 6 to 17 years - Living with two parents Both parents native 904 98.3% Native15 1.7% Foreign-bornBoth parents foreign-born 209 95.5% Native10 4.5% Foreign-bornOne native, one foreign-born parent 62 100.0% NativeChildren 6 to 17 years - Living with one parent Native parent 408 100.0% NativeForeign-born parent 253 50.8% Native245 49.2% Foreign-born
Grandparents responsible for own grandchildren in Seabrook
Grandparents (30 to 59 years) White / Caucasian 37 100.0% Responsible for grandchildrenBlack or African American 10 100.0% Not responsible for grandchildrenOther race 52 100.0% Responsible for grandchildrenWhite alone, not Hispanic / Latino 10 100.0% Responsible for grandchildrenHispanic or Latino 88 100.0% Responsible for grandchildrenGrandparents (60 years and over) White / Caucasian 32 51.9% Responsible for grandchildren30 48.1% Not responsible for grandchildrenWhite alone, not Hispanic / Latino 9 14.6% Responsible for grandchildren53 85.4% Not responsible for grandchildrenHispanic or Latino 46 100.0% Responsible for grandchildren