Races in Seattle, Washington (WA) Detailed Stats
Data:
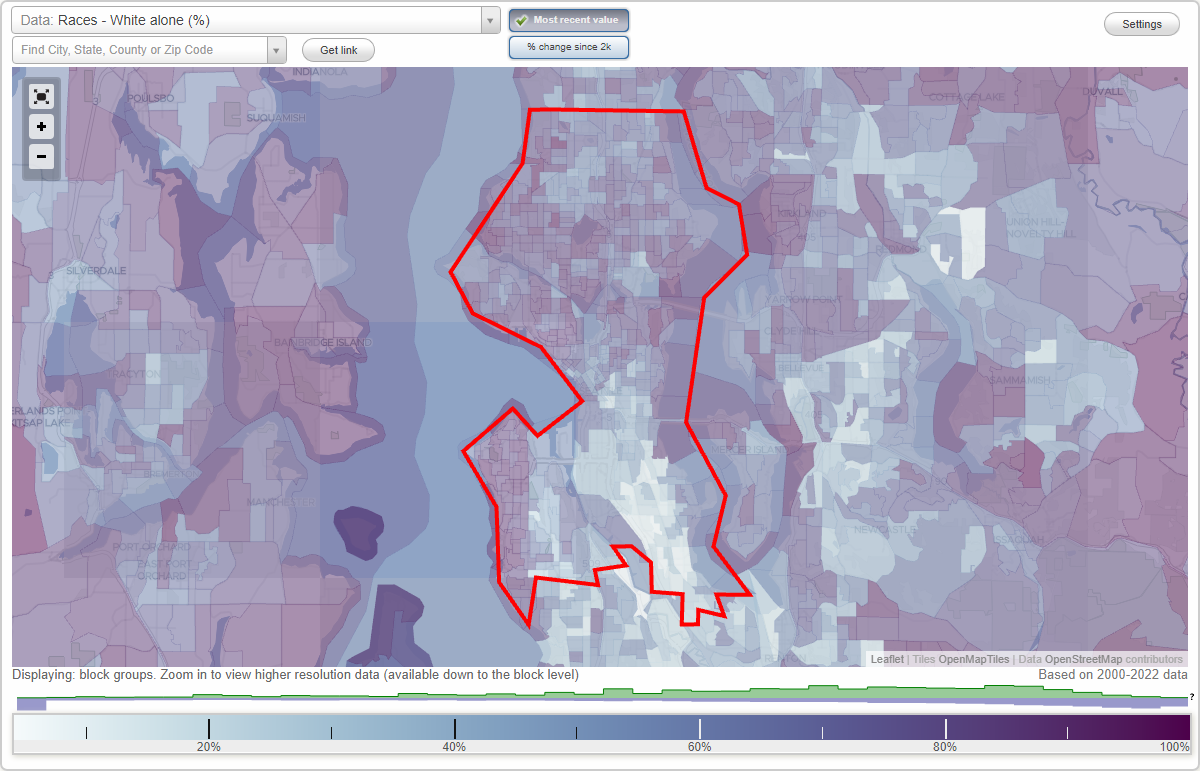
Races - White alone (%)
Races - White alone (% change since 2000)
Races - Black alone (%)
Races - Black alone (% change since 2000)
Races - American Indian alone (%)
Races - American Indian alone (% change since 2000)
Races - Asian alone (%)
Races - Asian alone (% change since 2000)
Races - Hispanic (%)
Races - Hispanic (% change since 2000)
Races - Native Hawaiian and Other Pacific Islander alone (%)
Races - Native Hawaiian and Other Pacific Islander alone (% change since 2000)
Races - Two or more races(%)
Races - Two or more races(% change since 2000)
Races - Other race alone (%)
Races - Other race alone (% change since 2000)
Racial diversity
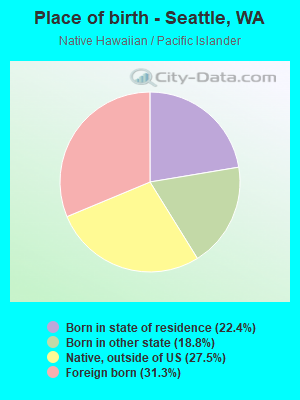
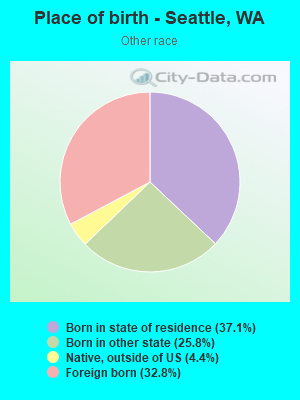
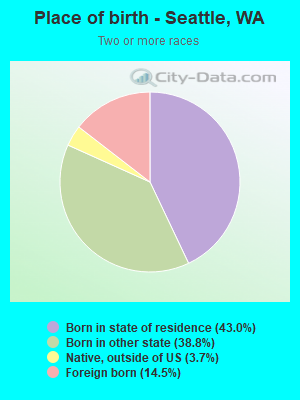
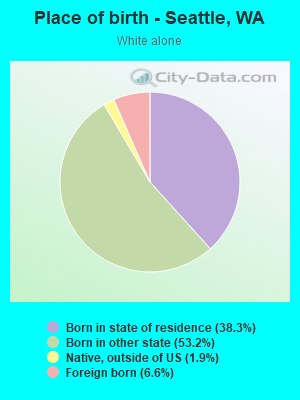
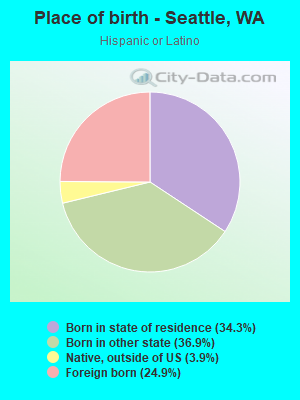
Place of birth - Born in state of residence (%)
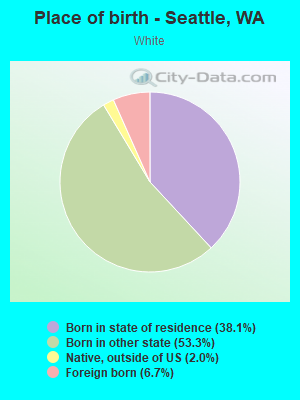
Place of birth - Born in state of residence (%) - White
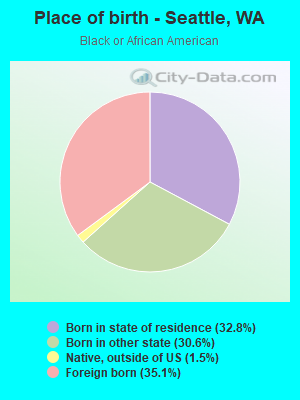
Place of birth - Born in state of residence (%) - Black or African American
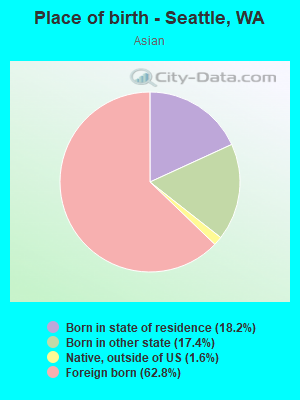
Place of birth - Born in state of residence (%) - Asian
Place of birth - Born in state of residence (%) - Hispanic or Latino
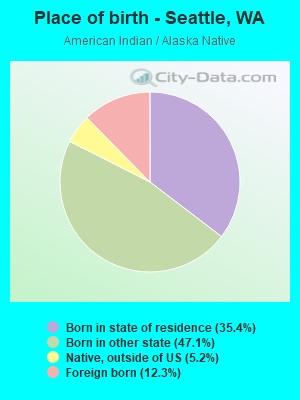
Place of birth - Born in state of residence (%) - American Indian and Alaska Native
Place of birth - Born in state of residence (%) - Multirace
Place of birth - Born in state of residence (%) - Other Race
Place of birth - Born in other state (%)
Place of birth - Born in other state (%) - White
Place of birth - Born in other state (%) - Black or African American
Place of birth - Born in other state (%) - Asian
Place of birth - Born in other state (%) - Hispanic or Latino
Place of birth - Born in other state (%) - American Indian and Alaska Native
Place of birth - Born in other state (%) - Multirace
Place of birth - Born in other state (%) - Other Race
Place of birth - Native, outside of US (%)
Place of birth - Native, outside of US (%) - White
Place of birth - Native, outside of US (%) - Black or African American
Place of birth - Native, outside of US (%) - Asian
Place of birth - Native, outside of US (%) - Hispanic or Latino
Place of birth - Native, outside of US (%) - American Indian and Alaska Native
Place of birth - Native, outside of US (%) - Multirace
Place of birth - Native, outside of US (%) - Other Race
Place of birth - Foreign born (%)
Place of birth - Foreign born (%) - White
Place of birth - Foreign born (%) - Black or African American
Place of birth - Foreign born (%) - Asian
Place of birth - Foreign born (%) - Hispanic or Latino
Place of birth - Foreign born (%) - American Indian and Alaska Native
Place of birth - Foreign born (%) - Multirace
Place of birth - Foreign born (%) - Other Race
Residents speaking English at home (%)
Residents speaking English at home - Born in the United States (%)
Residents speaking English at home - Native, born elsewhere (%)
Residents speaking English at home - Foreign born (%)
Residents speaking Spanish at home (%)
Residents speaking Spanish at home - Born in the United States (%)
Residents speaking Spanish at home - Native, born elsewhere (%)
Residents speaking Spanish at home - Foreign born (%)
Residents speaking other language at home (%)
Residents speaking other language at home - Born in the United States (%)
Residents speaking other language at home - Native, born elsewhere (%)
Residents speaking other language at home - Foreign born (%)
Marital status - Never married (%)
Marital status - Now married (%)
Marital status - Separated (%)
Marital status - Widowed (%)
Marital status - Divorced (%)
Ancestries Reported - Arab (%)
Ancestries Reported - Czech (%)
Ancestries Reported - Danish (%)
Ancestries Reported - Dutch (%)
Ancestries Reported - English (%)
Ancestries Reported - French (%)
Ancestries Reported - French Canadian (%)
Ancestries Reported - German (%)
Ancestries Reported - Greek (%)
Ancestries Reported - Hungarian (%)
Ancestries Reported - Irish (%)
Ancestries Reported - Italian (%)
Ancestries Reported - Lithuanian (%)
Ancestries Reported - Norwegian (%)
Ancestries Reported - Polish (%)
Ancestries Reported - Portuguese (%)
Ancestries Reported - Russian (%)
Ancestries Reported - Scotch-Irish (%)
Ancestries Reported - Scottish (%)
Ancestries Reported - Slovak (%)
Ancestries Reported - Subsaharan African (%)
Ancestries Reported - Swedish (%)
Ancestries Reported - Swiss (%)
Ancestries Reported - Ukrainian (%)
Ancestries Reported - United States (%)
Ancestries Reported - Welsh (%)
Ancestries Reported - West Indian (%)
Ancestries Reported - Other (%)
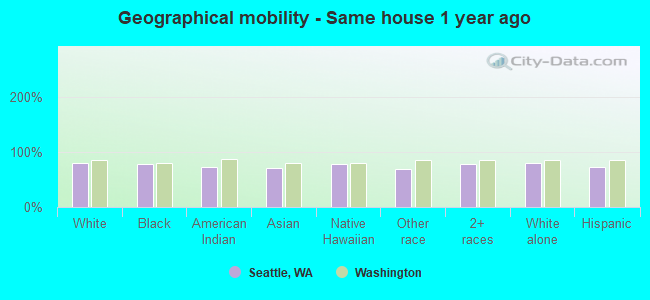
Geographical mobility - Same house 1 year ago (%)
Geographical mobility - Same house 1 year ago (%) - White
Geographical mobility - Same house 1 year ago (%) - Black or African American
Geographical mobility - Same house 1 year ago (%) - Asian
Geographical mobility - Same house 1 year ago (%) - Hispanic or Latino
Geographical mobility - Same house 1 year ago (%) - American Indian and Alaska Native
Geographical mobility - Same house 1 year ago (%) - Multirace
Geographical mobility - Same house 1 year ago (%) - Other Race
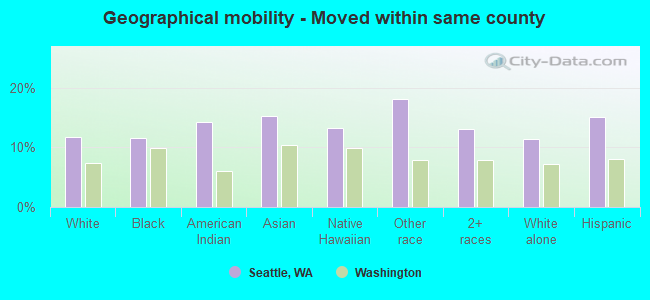
Geographical mobility - Moved within same county (%)
Geographical mobility - Moved within same county (%) - White
Geographical mobility - Moved within same county (%) - Black or African American
Geographical mobility - Moved within same county (%) - Asian
Geographical mobility - Moved within same county (%) - Hispanic or Latino
Geographical mobility - Moved within same county (%) - American Indian and Alaska Native
Geographical mobility - Moved within same county (%) - Multirace
Geographical mobility - Moved within same county (%) - Other Race
Geographical mobility - Moved from different county within same state (%)
Geographical mobility - Moved from different county within same state (%) - White
Geographical mobility - Moved from different county within same state (%) - Black or African American
Geographical mobility - Moved from different county within same state (%) - Asian
Geographical mobility - Moved from different county within same state (%) - Hispanic or Latino
Geographical mobility - Moved from different county within same state (%) - American Indian and Alaska Native
Geographical mobility - Moved from different county within same state (%) - Multirace
Geographical mobility - Moved from different county within same state (%) - Other Race
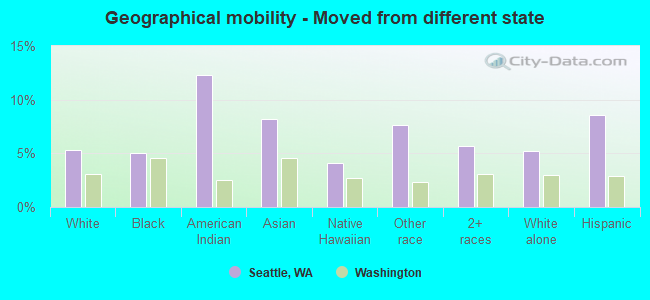
Geographical mobility - Moved from different state (%)
Geographical mobility - Moved from different state (%) - White
Geographical mobility - Moved from different state (%) - Black or African American
Geographical mobility - Moved from different state (%) - Asian
Geographical mobility - Moved from different state (%) - Hispanic or Latino
Geographical mobility - Moved from different state (%) - American Indian and Alaska Native
Geographical mobility - Moved from different state (%) - Multirace
Geographical mobility - Moved from different state (%) - Other Race
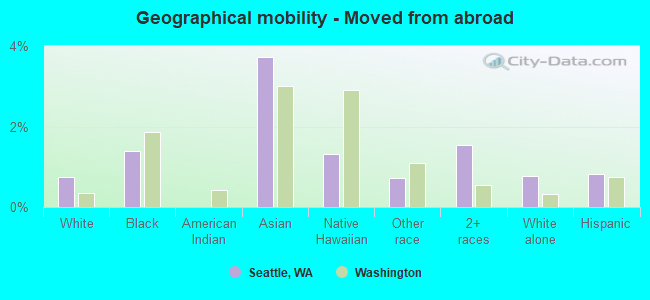
Geographical mobility - Moved from abroad (%)
Geographical mobility - Moved from abroad (%) - White
Geographical mobility - Moved from abroad (%) - Black or African American
Geographical mobility - Moved from abroad (%) - Asian
Geographical mobility - Moved from abroad (%) - Hispanic or Latino
Geographical mobility - Moved from abroad (%) - American Indian and Alaska Native
Geographical mobility - Moved from abroad (%) - Multirace
Geographical mobility - Moved from abroad (%) - Other Race
Place of birth for the foreign-born population - Ireland (%)
Place of birth for the foreign-born population - Denmark (%)
Place of birth for the foreign-born population - Norway (%)
Place of birth for the foreign-born population - Sweden (%)
Place of birth for the foreign-born population - United Kingdom (%)
Place of birth for the foreign-born population - England (%)
Place of birth for the foreign-born population - Scotland (%)
Place of birth for the foreign-born population - Other Northern Europe (%)
Place of birth for the foreign-born population - Austria (%)
Place of birth for the foreign-born population - Belgium (%)
Place of birth for the foreign-born population - France (%)
Place of birth for the foreign-born population - Germany (%)
Place of birth for the foreign-born population - Netherlands (%)
Place of birth for the foreign-born population - Switzerland (%)
Place of birth for the foreign-born population - Other Western Europe (%)
Place of birth for the foreign-born population - Greece (%)
Place of birth for the foreign-born population - Italy (%)
Place of birth for the foreign-born population - Portugal (%)
Place of birth for the foreign-born population - Spain (%)
Place of birth for the foreign-born population - Other Southern Europe (%)
Place of birth for the foreign-born population - Albania (%)
Place of birth for the foreign-born population - Belarus (%)
Place of birth for the foreign-born population - Bosnia and Herzegovina (%)
Place of birth for the foreign-born population - Bulgaria (%)
Place of birth for the foreign-born population - Croatia (%)
Place of birth for the foreign-born population - Czechoslovakia (%)
Place of birth for the foreign-born population - Hungary (%)
Place of birth for the foreign-born population - Latvia (%)
Place of birth for the foreign-born population - Lithuania (%)
Place of birth for the foreign-born population - North Macedonia (Macedonia) (%)
Place of birth for the foreign-born population - Moldova (%)
Place of birth for the foreign-born population - Poland (%)
Place of birth for the foreign-born population - Romania (%)
Place of birth for the foreign-born population - Russia (%)
Place of birth for the foreign-born population - Serbia (%)
Place of birth for the foreign-born population - Ukraine (%)
Place of birth for the foreign-born population - Other Eastern Europe (%)
Place of birth for the foreign-born population - China (%)
Place of birth for the foreign-born population - Hong Kong (%)
Place of birth for the foreign-born population - Taiwan (%)
Place of birth for the foreign-born population - Japan (%)
Place of birth for the foreign-born population - Korea (%)
Place of birth for the foreign-born population - Other Eastern Asia (%)
Place of birth for the foreign-born population - Afghanistan (%)
Place of birth for the foreign-born population - Bangladesh (%)
Place of birth for the foreign-born population - India (%)
Place of birth for the foreign-born population - Iran (%)
Place of birth for the foreign-born population - Kazakhstan (%)
Place of birth for the foreign-born population - Nepal (%)
Place of birth for the foreign-born population - Pakistan (%)
Place of birth for the foreign-born population - Sri Lanka (%)
Place of birth for the foreign-born population - Uzbekistan (%)
Place of birth for the foreign-born population - Other South Central Asia (%)
Place of birth for the foreign-born population - Burma (%)
Place of birth for the foreign-born population - Cambodia (%)
Place of birth for the foreign-born population - Indonesia (%)
Place of birth for the foreign-born population - Laos (%)
Place of birth for the foreign-born population - Malaysia (%)
Place of birth for the foreign-born population - Philippines (%)
Place of birth for the foreign-born population - Singapore (%)
Place of birth for the foreign-born population - Thailand (%)
Place of birth for the foreign-born population - Vietnam (%)
Place of birth for the foreign-born population - Other South Eastern Asia (%)
Place of birth for the foreign-born population - Armenia (%)
Place of birth for the foreign-born population - Iraq (%)
Place of birth for the foreign-born population - Israel (%)
Place of birth for the foreign-born population - Jordan (%)
Place of birth for the foreign-born population - Kuwait (%)
Place of birth for the foreign-born population - Lebanon (%)
Place of birth for the foreign-born population - Saudi Arabia (%)
Place of birth for the foreign-born population - Syria (%)
Place of birth for the foreign-born population - Turkey (%)
Place of birth for the foreign-born population - Yemen (%)
Place of birth for the foreign-born population - Other Western Asia (%)
Place of birth for the foreign-born population - Eritrea (%)
Place of birth for the foreign-born population - Ethiopia (%)
Place of birth for the foreign-born population - Kenya (%)
Place of birth for the foreign-born population - Somalia (%)
Place of birth for the foreign-born population - Uganda (%)
Place of birth for the foreign-born population - Zimbabwe (%)
Place of birth for the foreign-born population - Other Eastern Africa (%)
Place of birth for the foreign-born population - Cameroon (%)
Place of birth for the foreign-born population - Congo (%)
Place of birth for the foreign-born population - Democratic Republic of Congo (Zaire) (%)
Place of birth for the foreign-born population - Other Middle Africa (%)
Place of birth for the foreign-born population - Egypt (%)
Place of birth for the foreign-born population - Morocco (%)
Place of birth for the foreign-born population - Sudan (%)
Place of birth for the foreign-born population - Other Northern Africa (%)
Place of birth for the foreign-born population - South Africa (%)
Place of birth for the foreign-born population - Other Southern Africa (%)
Place of birth for the foreign-born population - Cabo Verde (%)
Place of birth for the foreign-born population - Ghana (%)
Place of birth for the foreign-born population - Liberia (%)
Place of birth for the foreign-born population - Nigeria (%)
Place of birth for the foreign-born population - Senegal (%)
Place of birth for the foreign-born population - Sierra Leone (%)
Place of birth for the foreign-born population - Other Western Africa (%)
Place of birth for the foreign-born population - Australia (%)
Place of birth for the foreign-born population - New Zealand (%)
Place of birth for the foreign-born population - Fiji (%)
Place of birth for the foreign-born population - Micronesia (%)
Place of birth for the foreign-born population - Bahamas (%)
Place of birth for the foreign-born population - Barbados (%)
Place of birth for the foreign-born population - Cuba (%)
Place of birth for the foreign-born population - Dominica (%)
Place of birth for the foreign-born population - Dominican Republic (%)
Place of birth for the foreign-born population - Grenada (%)
Place of birth for the foreign-born population - Haiti (%)
Place of birth for the foreign-born population - Jamaica (%)
Place of birth for the foreign-born population - St. Vincent and the Grenadines (%)
Place of birth for the foreign-born population - Trinidad and Tobago (%)
Place of birth for the foreign-born population - West Indies (%)
Place of birth for the foreign-born population - Other Caribbean (%)
Place of birth for the foreign-born population - Belize (%)
Place of birth for the foreign-born population - Costa Rica (%)
Place of birth for the foreign-born population - El Salvador (%)
Place of birth for the foreign-born population - Guatemala (%)
Place of birth for the foreign-born population - Honduras (%)
Place of birth for the foreign-born population - Mexico (%)
Place of birth for the foreign-born population - Nicaragua (%)
Place of birth for the foreign-born population - Panama (%)
Place of birth for the foreign-born population - Other Central America (%)
Place of birth for the foreign-born population - Argentina (%)
Place of birth for the foreign-born population - Bolivia (%)
Place of birth for the foreign-born population - Brazil (%)
Place of birth for the foreign-born population - Chile (%)
Place of birth for the foreign-born population - Colombia (%)
Place of birth for the foreign-born population - Ecuador (%)
Place of birth for the foreign-born population - Guyana (%)
Place of birth for the foreign-born population - Peru (%)
Place of birth for the foreign-born population - Uruguay (%)
Place of birth for the foreign-born population - Venezuela (%)
Place of birth for the foreign-born population - Other South America (%)
Place of birth for the foreign-born population - Canada (%)
Place of birth for the foreign-born population - Other Northern America (%)
Place of birth for the foreign-born population - Other (%)
Latest news about races in Seattle, WA collected exclusively by city-data.com from local newspapers, TV, and radio stations
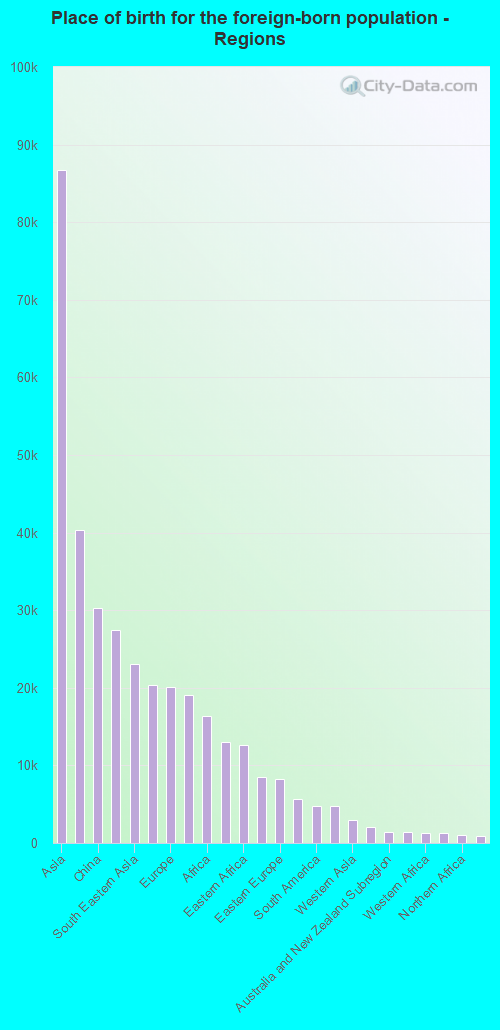
According to 2022 data, the most numerous races in Seattle, WA are White alone (444,864 residents), Hispanic (63,033 residents), and Asian alone (135,258 residents). 75.9% of Seattle residents speak English at home. 20.7% of Seattle, WA residents are foreign-born (11.3% born in Asia, 2.6% born in Europe, 2.5% born in Latin America, 2.1% born in Africa), which is 27.5% greater than the foreign-born rate of 15.0% across the entire state of Washington.
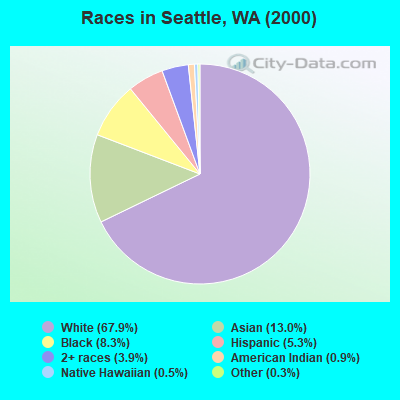
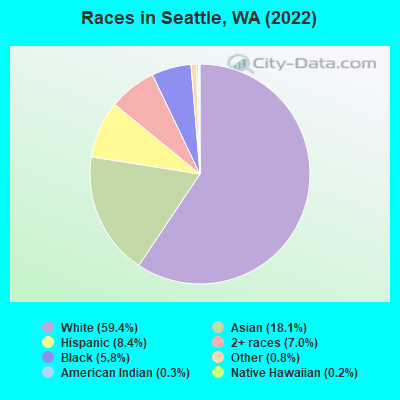
Race distribution in Seattle
2000 2022
382,532 67.9% White alone 73,512 13.0% Asian alone 46,545 8.3% Black alone 29,719 5.3% Hispanic 21,691 3.9% Two or more races 5,004 0.9% American Indian alone 2,715 0.5% Native Hawaiian and Other 1,656 0.3% Other race alone
444,864 59.4% White alone 135,258 18.1% Asian alone 63,033 8.4% Hispanic 52,823 7.0% Two or more races 43,670 5.8% Black alone 5,994 0.8% Other race alone 2,130 0.3% American Indian alone 1,495 0.2% Native Hawaiian and Other
2000 2022
4,652,490 78.9% White alone 441,509 7.5% Hispanic 319,401 5.4% Asian alone 184,631 3.1% Black alone 175,926 3.0% Two or more races 85,396 1.4% American Indian alone 22,779 0.4% Native Hawaiian and Other 11,989 0.2% Other race alone
4,941,456 63.5% White alone 1,093,313 14.0% Hispanic 755,832 9.7% Asian alone 523,448 6.7% Two or more races 299,537 3.8% Black alone 69,024 0.9% American Indian alone 52,231 0.7% Native Hawaiian and Other 50,945 0.7% Other race alone
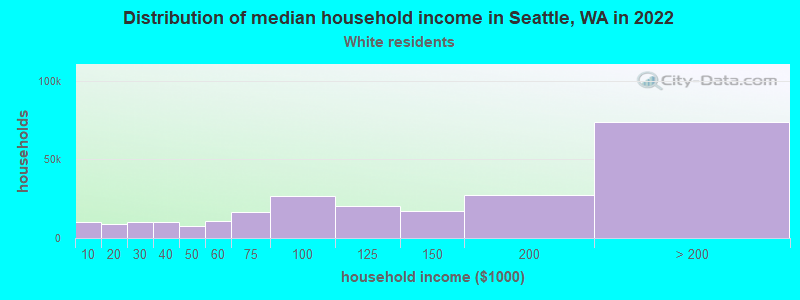
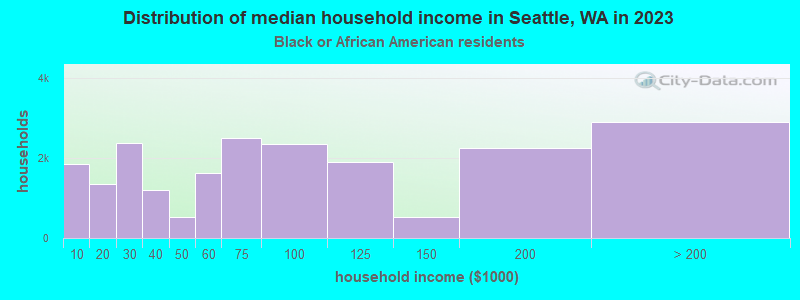
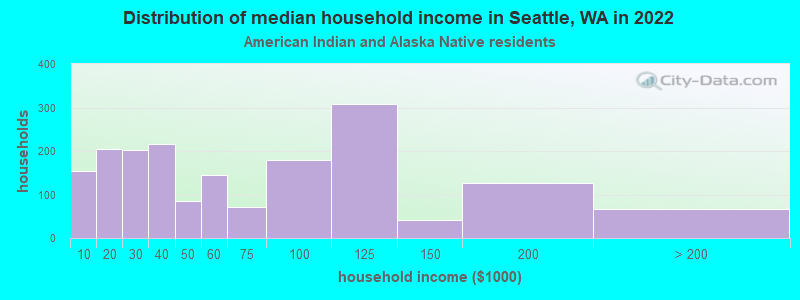
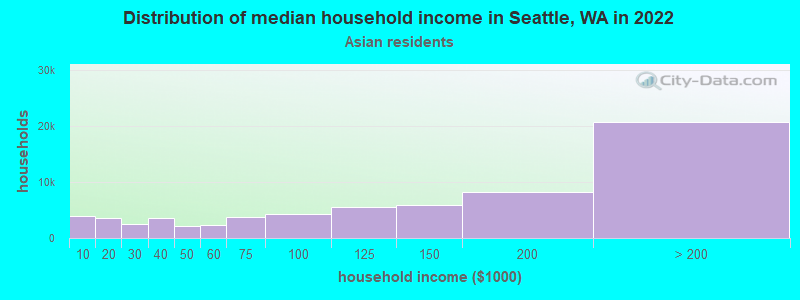
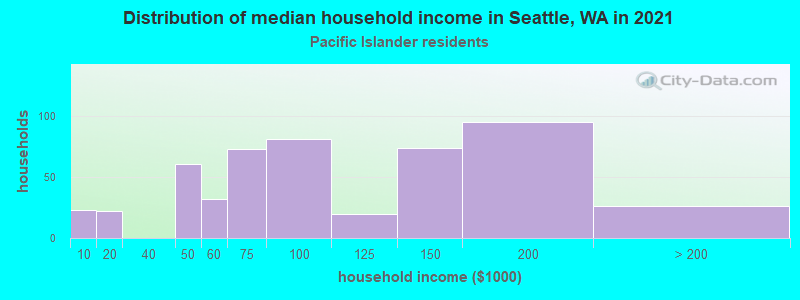
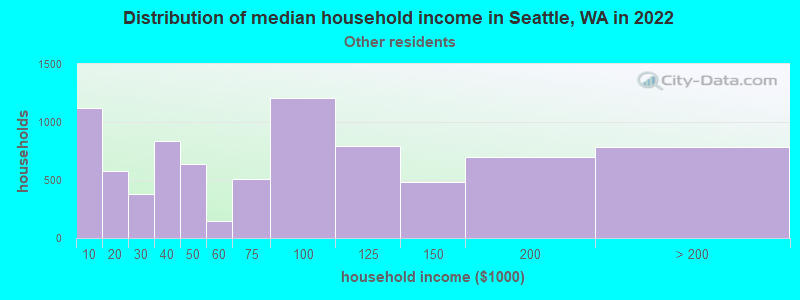
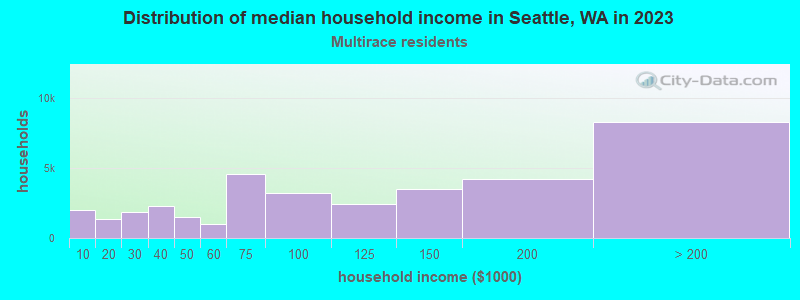
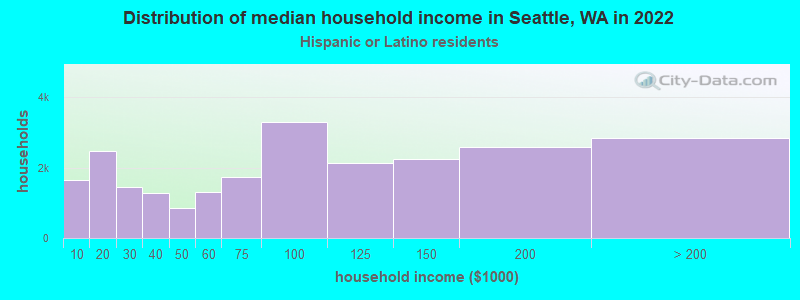
Income and house value in Seattle Median household income in 2022 $124,560 White non-Hispanic householders$52,350 Black householders$35,830 American Indian and Alaska Native householders$129,967 Asian householders$74,870 Native Hawaiian and other Pacific Islander householders$67,026 Some other race householders$87,797 Two or more races householders$80,358 Hispanic or Latino race householdersMedian 2022 house value over $1,000,000 White Non-Hispanic householders$748,964 Black or African American householders$813,486 American Indian or Alaska Native householders $737,600 Asian householders$657,681 Native Hawaiian and other Pacific Islander householders$762,895 Some other race householders$820,818 Two or more races householders$771,694 Hispanic or Latino householders
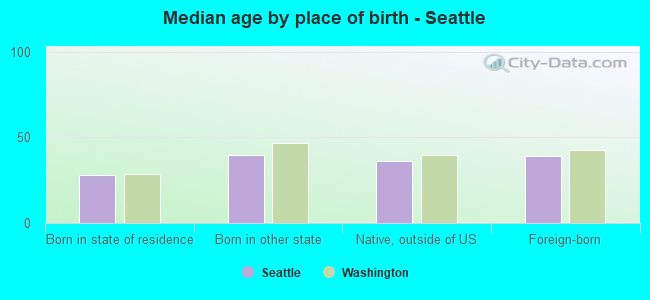
Median age by race in Seattle
38.4 Median age for White residents37.9 38.8 32.5 Median age for Black or African American residents32.8 32.0 29.4 Median age for American Indian / Alaska Native residents30.5 27.1 33.1 Median age for Asian residents32.2 34.4 45.1 Median age for Native Hawaiian / Pacific Islander residents30.7 49.8 29.8 Median age for Other race residents32.6 28.9 29.7 Median age for Two or more races residents31.0 28.3 38.7 Median age for White alone residents38.2 39.2 30.3 Median age for Hispanic or Latino residents32.2 28.7
Owner/renter occupied households by race in Seattle
House owners and renters - White residents 116,408 48.7% Owner occupied122,738 51.3% Renter occupiedHouse owners and renters - Black or African American residents 3,979 22.5% Owner occupied13,678 77.5% Renter occupiedHouse owners and renters - American Indian / Alaska Native residents 116 6.4% Owner occupied1,704 93.6% Renter occupiedHouse owners and renters - Asian residents 26,695 40.2% Owner occupied39,680 59.8% Renter occupiedHouse owners and renters - Native Hawaiian / Pacific Islander residents 91 15.1% Owner occupied511 84.9% Renter occupiedHouse owners and renters - Other race residents 2,213 27.1% Owner occupied5,952 72.9% Renter occupiedHouse owners and renters - Two or more races residents 11,317 34.5% Owner occupied21,449 65.5% Renter occupiedHouse owners and renters - White alone residents 115,513 49.5% Owner occupied117,722 50.5% Renter occupiedHouse owners and renters - Hispanic or Latino residents 5,936 24.9% Owner occupied17,871 75.1% Renter occupied
Language usage in Seattle
English speakers - Total 75.9% of residents of Seattle speak English at home.
4.8% of residents speak Spanish at home 25,950 75.4% Speak English very well8,455 24.6% Speak English less than very well19.4% of residents speak other language at home 98,018 70.1% Speak English very well41,837 29.9% Speak English less than very well
English speakers - Born in the United States 91.5% of residents of Seattle speak English at home.
3.4% of residents speak Spanish at home 9,292 86.5% Speak English very well1,451 13.5% Speak English less than very well5.1% of residents speak other language at home 15,535 95.9% Speak English very well658 4.1% Speak English less than very well
English speakers - Native, born elsewhere 72.5% of residents of Seattle speak English at home.
8.6% of residents speak Spanish at home 1,342 94.9% Speak English very well72 5.1% Speak English less than very well19.0% of residents speak other language at home 2,567 82.2% Speak English very well557 17.8% Speak English less than very well
English speakers - Foreign-born 22.4% of residents of Seattle speak English at home.
9.4% of residents speak Spanish at home 8,808 62.0% Speak English very well5,390 38.0% Speak English less than very well68.2% of residents speak other language at home 65,038 62.8% Speak English very well38,454 37.2% Speak English less than very well
White (Caucasian) - Speak only English Native:
95.7% (393,306)Foreign-born:
43.2% (13,095)
White (Caucasian) - Speak another language Native:
4.3% (17,529)Foreign-born:
56.8% (17,200)
Black or African American - Speak only English Native:
89.7% (23,863)Foreign-born:
13.1% (2,013)
Black or African American - Speak another language Native:
10.3% (2,738)Foreign-born:
86.9% (13,378)
American Indian / Alaska Native - Speak only English Native:
78.2% (2,495)Foreign-born:
14.2% (138)
American Indian / Alaska Native - Speak another language Native:
22.5% (717)Foreign-born:
83.0% (807)
Asian - Speak only English Native:
58.9% (28,554)Foreign-born:
17.4% (14,778)
Asian - Speak another language Native:
41.1% (19,927)Foreign-born:
82.6% (70,338)
Native Hawaiian / Pacific Islander - Speak only English Native:
65.1% (745)Foreign-born:
42.1% (217)
Native Hawaiian / Pacific Islander - Speak another language Native:
32.9% (376)Foreign-born:
61.1% (315)
Other race - Speak only English Native:
58.7% (10,373)Foreign-born:
11.7% (994)
Other race - Speak another language Native:
41.3% (7,287)Foreign-born:
88.3% (7,471)
Two or more races - Speak only English Native:
87.2% (53,948)Foreign-born:
24.7% (2,848)
Two or more races - Speak another language Native:
12.8% (7,913)Foreign-born:
75.3% (8,668)
White alone - Speak only English Native:
96.2% (385,664)Foreign-born:
44.4% (13,002)
White alone - Speak another language Native:
3.8% (15,191)Foreign-born:
55.6% (16,295)
Hispanic or Latino - Speak only English Native:
67.5% (29,445)Foreign-born:
9.1% (1,393)
Hispanic or Latino - Speak another language Native:
32.5% (14,166)Foreign-born:
90.9% (13,903)
Foreign-born residents in Seattle 152,822 residents are foreign born (11.3% Asia , 2.6% Europe , 2.5% Latin America , 2.1% Africa ).
This city:
20.7%Washington:
14.9%
Marital status for residents in Seattle Marital status - White (Caucasian) population 15 years and over
Males 45.4% Never married43.9% Now married0.5% Separated1.7% Widowed8.5% DivorcedFemales 42.2% Never married40.1% Now married1.3% Separated4.8% Widowed11.5% DivorcedWomen who gave birth in the past 12 months Now married:
84.2% (2,450)Unmarried:
15.8% (461)
Women who did not give birth in the past 12 months Now married:
34.7% (42,758)Unmarried:
65.3% (80,551)
Marital status - Black or African American population 15 years and over
Males 59.7% Never married29.8% Now married1.0% Separated2.9% Widowed6.5% DivorcedFemales 52.5% Never married29.3% Now married3.6% Separated4.7% Widowed9.9% DivorcedWomen who gave birth in the past 12 months Now married:
16.8% (89)Unmarried:
83.2% (440)
Women who did not give birth in the past 12 months Now married:
27.3% (2,960)Unmarried:
72.7% (7,882)
Marital status - American Indian / Alaska Native population 15 years and over
Males 49.8% Never married34.5% Now married0.6% Separated1.6% Widowed13.6% DivorcedFemales 45.2% Never married31.4% Now married4.9% Separated7.0% Widowed11.6% DivorcedWomen who gave birth in the past 12 months Now married:
0.0% (0)Unmarried:
100.0% (13)
Women who did not give birth in the past 12 months Now married:
37.8% (421)Unmarried:
62.2% (692)
Marital status - Asian population 15 years and over
Males 51.3% Never married39.8% Now married1.4% Separated0.8% Widowed6.6% DivorcedFemales 42.5% Never married41.0% Now married1.4% Separated8.6% Widowed6.5% DivorcedWomen who gave birth in the past 12 months Now married:
100.0% (1,160)Unmarried:
0.0% (0)
Women who did not give birth in the past 12 months Now married:
37.9% (16,560)Unmarried:
62.1% (27,176)
Marital status - Native Hawaiian / Pacific Islander population 15 years and over
Males 62.5% Never married35.8% Now married0.0% Separated0.0% Widowed1.7% DivorcedFemales 47.7% Never married27.2% Now married0.0% Separated13.0% Widowed12.1% DivorcedWomen who did not give birth in the past 12 months Now married:
27.6% (138)Unmarried:
72.4% (362)
Marital status - Other race population 15 years and over
Males 65.4% Never married22.5% Now married2.0% Separated0.8% Widowed9.3% DivorcedFemales 61.9% Never married28.6% Now married2.6% Separated1.1% Widowed5.8% DivorcedWomen who gave birth in the past 12 months Now married:
83.7% (273)Unmarried:
16.3% (53)
Women who did not give birth in the past 12 months Now married:
25.0% (2,328)Unmarried:
75.0% (6,968)
Marital status - Two or more races population 15 years and over
Males 55.5% Never married35.1% Now married2.8% Separated0.4% Widowed6.3% DivorcedFemales 57.4% Never married30.7% Now married0.6% Separated2.4% Widowed8.8% DivorcedWomen who gave birth in the past 12 months Now married:
88.7% (740)Unmarried:
11.3% (94)
Women who did not give birth in the past 12 months Now married:
26.6% (6,704)Unmarried:
73.4% (18,467)
Marital status - White alone, not Hispanic / Latino population 15 years and over
Males 45.0% Never married44.3% Now married0.5% Separated1.7% Widowed8.4% DivorcedFemales 41.8% Never married40.6% Now married1.3% Separated4.8% Widowed11.5% DivorcedWomen who gave birth in the past 12 months Now married:
84.2% (2,450)Unmarried:
15.8% (461)
Women who did not give birth in the past 12 months Now married:
35.1% (41,565)Unmarried:
64.9% (76,887)
Marital status - Hispanic or Latino population 15 years and over
Males 57.4% Never married30.3% Now married3.6% Separated0.3% Widowed8.3% DivorcedFemales 56.5% Never married28.8% Now married2.6% Separated3.4% Widowed8.8% DivorcedWomen who gave birth in the past 12 months Now married:
80.3% (419)Unmarried:
19.7% (103)
Women who did not give birth in the past 12 months Now married:
28.2% (5,514)Unmarried:
71.8% (14,006)
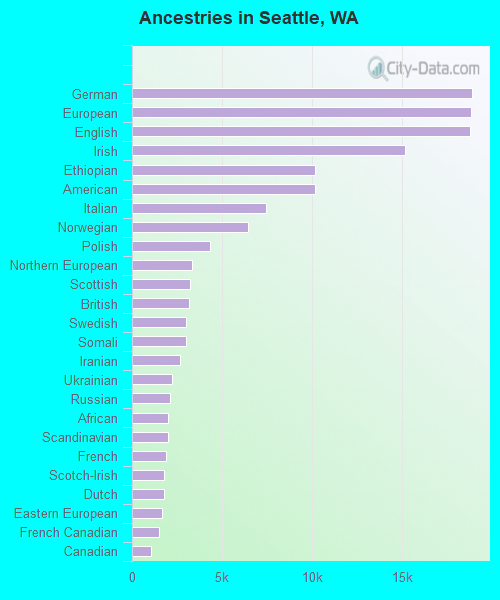
Ancestries in Seattle
18,904 5.4% German18,855 5.4% European18,775 5.4% English15,164 4.4% Irish10,196 2.9% Ethiopian10,187 2.9% American7,467 2.1% Italian6,448 1.9% Norwegian4,338 1.2% Polish3,332 1.0% Northern European3,218 0.9% Scottish3,171 0.9% British3,027 0.9% Swedish2,977 0.9% Somali2,675 0.8% Iranian2,208 0.6% Ukrainian2,127 0.6% Russian2,014 0.6% African1,991 0.6% Scandinavian1,865 0.5% French1,797 0.5% Scotch-Irish1,760 0.5% Dutch1,653 0.5% Eastern European1,481 0.4% French Canadian1,079 0.3% Canadian1,029 0.3% Danish852 0.2% Czech840 0.2% Brazilian839 0.2% Portuguese821 0.2% Greek813 0.2% Romanian726 0.2% Finnish718 0.2% Turkish655 0.2% Armenian634 0.2% Serbian611 0.2% Welsh584 0.2% Egyptian560 0.2% Swiss514 0.1% Croatian507 0.1% Nigerian459 0.1% Kenyan426 0.1% Palestinian421 0.1% Ghanaian406 0.1% Austrian378 0.1% Bulgarian377 0.1% Iraqi356 0.1% Latvian330 0.09% Slovak325 0.09% Hungarian256 0.07% Arab242 0.07% Australian231 0.07% Jamaican224 0.06% Icelander224 0.06% Cajun224 0.06% Haitian219 0.06% Israeli208 0.06% Lithuanian192 0.06% Lebanese190 0.05% Jordanian189 0.05% Czechoslovakian162 0.05% South African136 0.04% Yugoslavian131 0.04% West Indian130 0.04% Basque126 0.04% Syrian124 0.04% Belgian123 0.04% Macedonian123 0.04% Ugandan121 0.03% Slovene118 0.03% Moroccan118 0.03% Afghan105 0.03% Trinidadian and Tobagonian92 0.03% New Zealander91 0.03% Slavic83 0.02% Sudanese57 0.02% Guyanese57 0.02% Albanian55 0.02% Celtic53 0.02% Estonian47 0.01% Belizean46 0.01% Pennsylvania German23 0.01% German Russian23 0.01% Assyrian23 0.01% British West Indian18 0.01% Bahamian
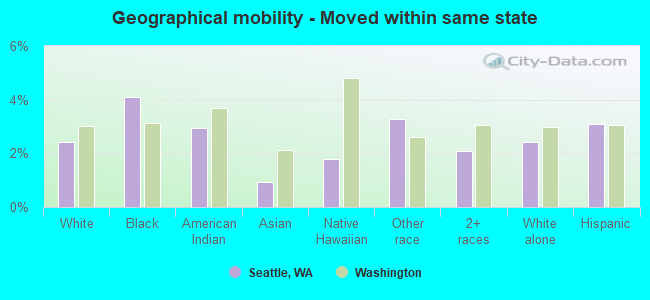
Geographical mobility in Seattle Same house 1 year ago 362,096 79.8% White (Caucasian)33,745 77.9% Black or African American3,173 73.4% American Indian / Alaska Native96,978 71.8% Asian1,280 78.0% Native Hawaiian / Pacific Islander18,762 70.2% Other race61,522 77.6% Two or more races354,684 80.1% White alone, not Hispanic / Latino45,002 72.4% Hispanic or LatinoMoved within same county 53,258 11.7% White / Caucasian5,011 11.6% Black or African American614 14.2% American Indian / Alaska Native20,733 15.3% Asian219 13.3% Native Hawaiian / Pacific Islander4,846 18.1% Other race10,423 13.1% Two or more races50,763 11.5% White alone, not Hispanic / Latino9,395 15.1% Hispanic or LatinoMoved within same state 11,014 2.4% White / Caucasian1,776 4.1% Black or African American127 2.9% American Indian / Alaska Native1,237 0.9% Asian29 1.8% Native Hawaiian / Pacific Islander878 3.3% Other race1,660 2.1% Two or more races10,735 2.4% White alone, not Hispanic / Latino1,916 3.1% Hispanic or LatinoMoved from different state 24,044 5.3% White / Caucasian2,200 5.1% Black or African American529 12.3% American Indian / Alaska Native11,140 8.2% Asian68 4.1% Native Hawaiian / Pacific Islander2,051 7.7% Other race4,493 5.7% Two or more races23,019 5.2% White alone, not Hispanic / Latino5,312 8.5% Hispanic or LatinoMoved from abroad 3,370 0.7% White602 1.4% Black or African American5,052 3.7% Asian22 1.3% Native Hawaiian / Pacific Islander190 0.7% Other race1,218 1.5% Two or more races3,370 0.8% White alone, not Hispanic / Latino507 0.8% Hispanic or Latino
Children Nativity (place of birth) in Seattle
Children under 6 years - Living with two parents Both parents native 17,616 100.0% NativeBoth parents foreign-born 3,635 89.1% Native443 10.9% Foreign-bornOne native, one foreign-born parent 3,365 100.0% NativeChildren under 6 years - Living with one parent Native parent 4,656 100.0% NativeForeign-born parent 2,087 89.0% Native259 11.0% Foreign-bornChildren 6 to 17 years - Living with two parents Both parents native 28,310 99.5% Native149 0.5% Foreign-bornBoth parents foreign-born 8,168 81.4% Native1,863 18.6% Foreign-bornOne native, one foreign-born parent 7,768 100.0% NativeChildren 6 to 17 years - Living with one parent Native parent 12,127 100.0% NativeForeign-born parent 5,226 55.7% Native4,148 44.3% Foreign-born
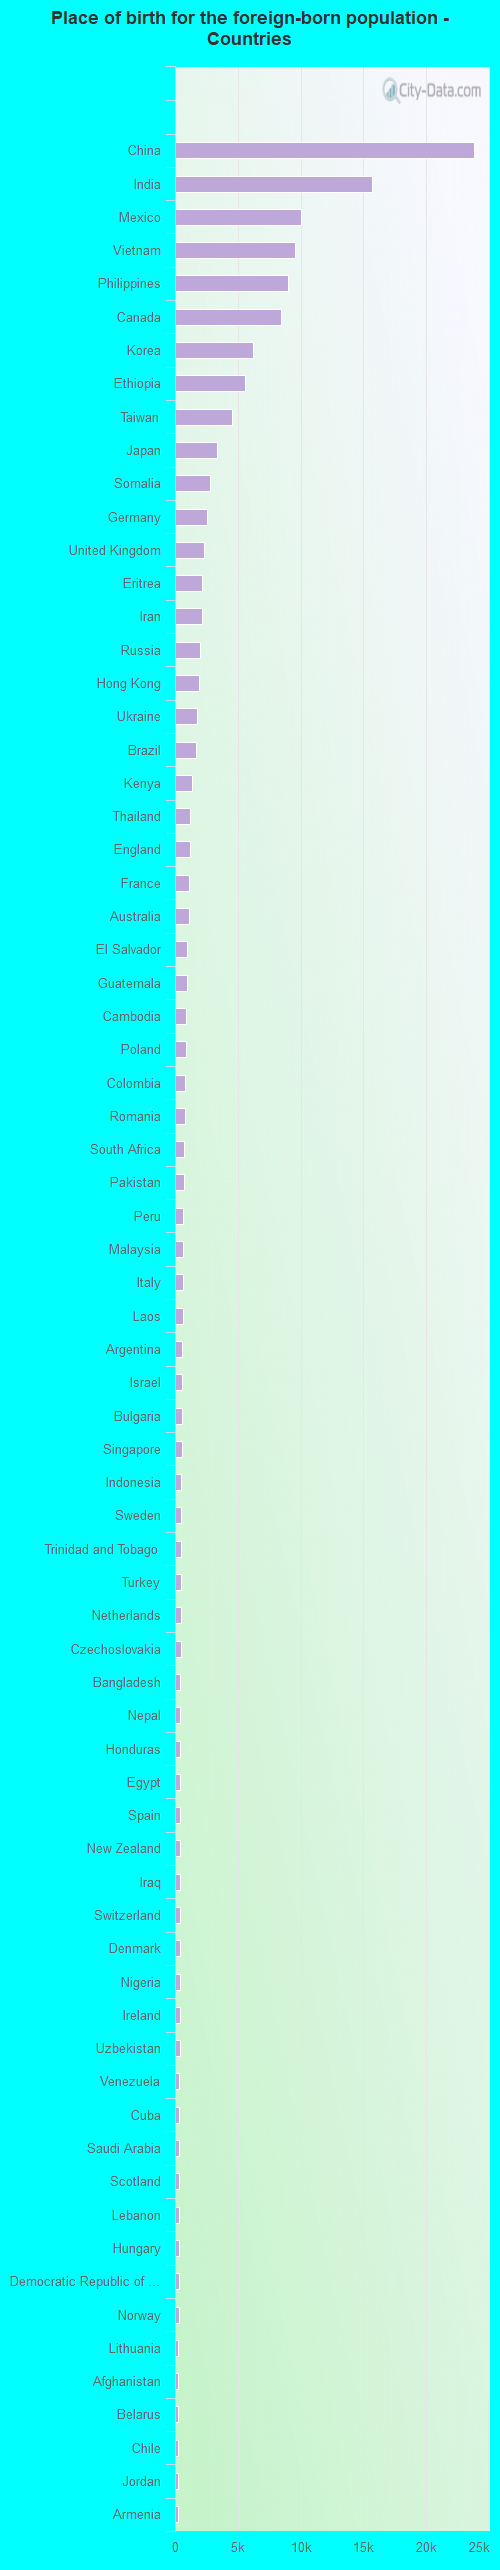
Place of birth for residents in Seattle 86,781 Asia40,295 Eastern Asia30,264 China27,504 Americas23,086 South Eastern Asia20,347 South Central Asia20,079 Europe19,059 Latin America16,354 Africa12,986 Central America12,607 Eastern Africa8,444 Northern America8,213 Eastern Europe5,636 Northern Europe4,825 South America4,770 Western Europe3,011 Western Asia2,103 Oceania1,472 Australia and New Zealand Subregion1,438 Southern Europe1,248 Western Africa1,247 Caribbean987 Northern Africa890 Southern Africa393 Middle Africa23,823 China15,662 India10,031 Mexico9,541 Vietnam9,025 Philippines8,440 Canada6,249 Korea5,593 Ethiopia4,529 Taiwan3,317 Japan2,755 Somalia2,521 Germany2,328 United Kingdom2,165 Eritrea2,142 Iran2,000 Russia1,910 Hong Kong1,745 Ukraine1,703 Brazil1,371 Kenya1,198 Thailand1,168 England1,133 France1,086 Australia969 El Salvador921 Guatemala916 Cambodia906 Poland792 Colombia773 Romania744 South Africa678 Pakistan675 Peru666 Malaysia657 Italy649 Laos577 Argentina570 Israel545 Bulgaria533 Singapore502 Indonesia491 Sweden478 Trinidad and Tobago478 Turkey477 Netherlands463 Czechoslovakia414 Bangladesh412 Nepal405 Honduras402 Egypt392 Spain385 New Zealand385 Iraq384 Switzerland376 Denmark376 Nigeria374 Ireland374 Uzbekistan350 Venezuela315 Cuba310 Saudi Arabia305 Scotland301 Lebanon294 Hungary288 Democratic Republic of Congo (Zaire)283 Norway274 Lithuania264 Afghanistan252 Belarus251 Chile233 Jordan224 Armenia211 Greece208 Fiji203 Costa Rica198 Algeria178 Yemen178 Panama178 Uganda177 Portugal166 Croatia161 Nicaragua159 Sri Lanka155 Morocco150 Haiti147 Ghana145 Ivory Coast144 Bolivia144 Moldova133 Jamaica130 Senegal125 Austria117 Kazakhstan110 Belgium105 Latvia104 Syria103 Sudan100 Belize98 United Arab Emirates96 Bosnia and Herzegovina90 Ecuador82 Zimbabwe68 Micronesia67 Sierra Leone66 North Macedonia (Macedonia)55 Dominican Republic52 Burma (Myanmar)48 Congo45 Cameroon45 Guyana42 Liberia36 Albania36 Kuwait29 Serbia23 Azores Islands10 Marshall Islands9 Uruguay8 St. Lucia7 Azerbaijan5 Georgia
Grandparents responsible for own grandchildren in Seattle
Grandparents (30 to 59 years) White / Caucasian 76 22.5% Responsible for grandchildren262 77.5% Not responsible for grandchildrenBlack or African American 63 27.8% Responsible for grandchildren164 72.2% Not responsible for grandchildrenAmerican Indian / Alaska Native 22 100.0% Responsible for grandchildrenAsian 11 2.4% Responsible for grandchildren465 97.6% Not responsible for grandchildrenNative Hawaiian / Pacific Islander 13 100.0% Not responsible for grandchildrenOther race 20 46.8% Responsible for grandchildren23 53.2% Not responsible for grandchildrenTwo or more races 15 23.2% Responsible for grandchildren49 76.8% Not responsible for grandchildrenWhite alone, not Hispanic / Latino 76 22.5% Responsible for grandchildren262 77.5% Not responsible for grandchildrenHispanic or Latino 18 22.0% Responsible for grandchildren65 78.0% Not responsible for grandchildrenGrandparents (60 years and over) White / Caucasian 564 51.0% Responsible for grandchildren541 49.0% Not responsible for grandchildrenBlack or African American 47 9.6% Responsible for grandchildren444 90.4% Not responsible for grandchildrenAmerican Indian / Alaska Native 70 100.0% Not responsible for grandchildrenAsian 557 32.7% Responsible for grandchildren1,145 67.3% Not responsible for grandchildrenOther race 242 100.0% Not responsible for grandchildrenTwo or more races 26 16.2% Responsible for grandchildren131 83.8% Not responsible for grandchildrenWhite alone, not Hispanic / Latino 564 51.0% Responsible for grandchildren541 49.0% Not responsible for grandchildrenHispanic or Latino 8 1.6% Responsible for grandchildren469 98.4% Not responsible for grandchildren
Zip codes: 98101 , 98102 , 98103 , 98104 , 98105 , 98106 , 98107 , 98109 , 98112 , 98115 , 98116 , 98117 , 98118 , 98119 , 98121 , 98122 , 98125 , 98126 , 98133 , 98134 , 98136 , 98144 , 98154, 98164 , 98174, 98177 , 98195 , 98199 .