Races in Selma, California (CA) Detailed Stats
Data:
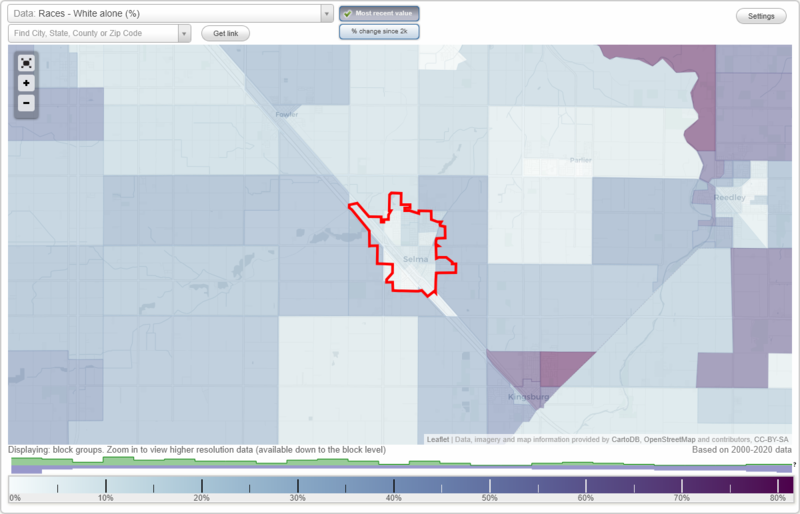
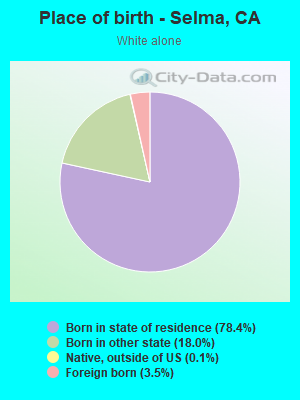
Races - White alone (%)
Races - White alone (% change since 2000)
Races - Black alone (%)
Races - Black alone (% change since 2000)
Races - American Indian alone (%)
Races - American Indian alone (% change since 2000)
Races - Asian alone (%)
Races - Asian alone (% change since 2000)
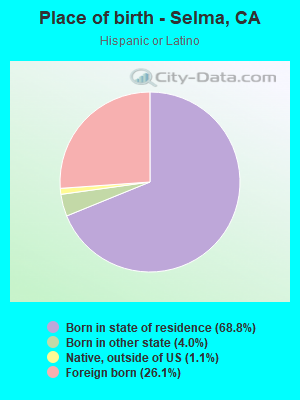
Races - Hispanic (%)
Races - Hispanic (% change since 2000)
Races - Native Hawaiian and Other Pacific Islander alone (%)
Races - Native Hawaiian and Other Pacific Islander alone (% change since 2000)
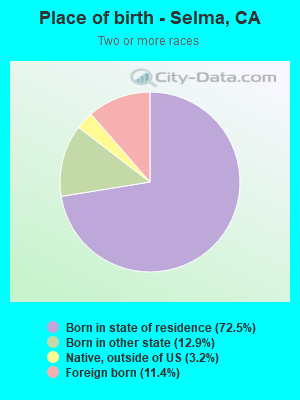
Races - Two or more races(%)
Races - Two or more races(% change since 2000)
Races - Other race alone (%)
Races - Other race alone (% change since 2000)
Racial diversity
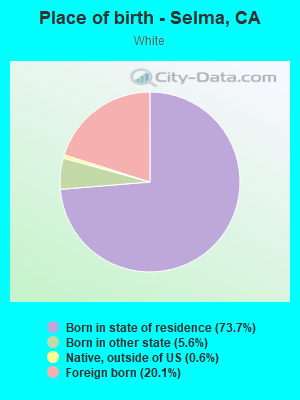
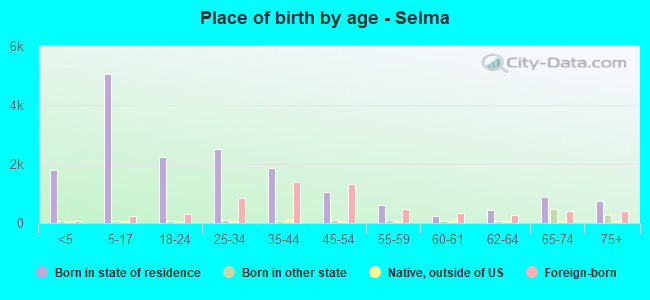
Place of birth - Born in state of residence (%)
Place of birth - Born in state of residence (%) - White
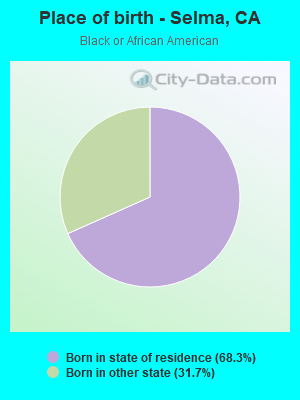
Place of birth - Born in state of residence (%) - Black or African American
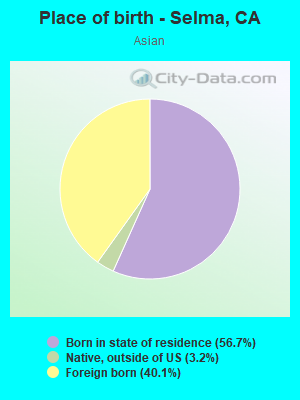
Place of birth - Born in state of residence (%) - Asian
Place of birth - Born in state of residence (%) - Hispanic or Latino
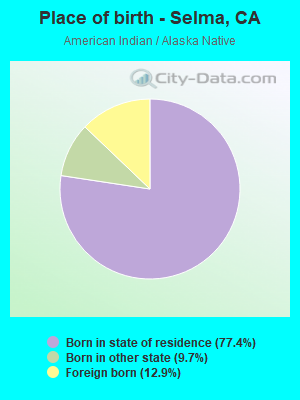
Place of birth - Born in state of residence (%) - American Indian and Alaska Native
Place of birth - Born in state of residence (%) - Multirace
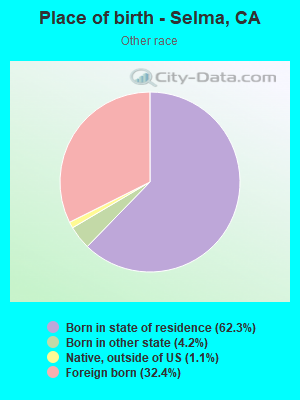
Place of birth - Born in state of residence (%) - Other Race
Place of birth - Born in other state (%)
Place of birth - Born in other state (%) - White
Place of birth - Born in other state (%) - Black or African American
Place of birth - Born in other state (%) - Asian
Place of birth - Born in other state (%) - Hispanic or Latino
Place of birth - Born in other state (%) - American Indian and Alaska Native
Place of birth - Born in other state (%) - Multirace
Place of birth - Born in other state (%) - Other Race
Place of birth - Native, outside of US (%)
Place of birth - Native, outside of US (%) - White
Place of birth - Native, outside of US (%) - Black or African American
Place of birth - Native, outside of US (%) - Asian
Place of birth - Native, outside of US (%) - Hispanic or Latino
Place of birth - Native, outside of US (%) - American Indian and Alaska Native
Place of birth - Native, outside of US (%) - Multirace
Place of birth - Native, outside of US (%) - Other Race
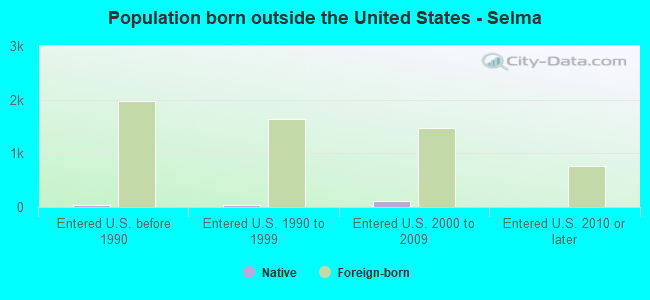
Place of birth - Foreign born (%)
Place of birth - Foreign born (%) - White
Place of birth - Foreign born (%) - Black or African American
Place of birth - Foreign born (%) - Asian
Place of birth - Foreign born (%) - Hispanic or Latino
Place of birth - Foreign born (%) - American Indian and Alaska Native
Place of birth - Foreign born (%) - Multirace
Place of birth - Foreign born (%) - Other Race
Residents speaking English at home (%)
Residents speaking English at home - Born in the United States (%)
Residents speaking English at home - Native, born elsewhere (%)
Residents speaking English at home - Foreign born (%)
Residents speaking Spanish at home (%)
Residents speaking Spanish at home - Born in the United States (%)
Residents speaking Spanish at home - Native, born elsewhere (%)
Residents speaking Spanish at home - Foreign born (%)
Residents speaking other language at home (%)
Residents speaking other language at home - Born in the United States (%)
Residents speaking other language at home - Native, born elsewhere (%)
Residents speaking other language at home - Foreign born (%)
Marital status - Never married (%)
Marital status - Now married (%)
Marital status - Separated (%)
Marital status - Widowed (%)
Marital status - Divorced (%)
Ancestries Reported - Arab (%)
Ancestries Reported - Czech (%)
Ancestries Reported - Danish (%)
Ancestries Reported - Dutch (%)
Ancestries Reported - English (%)
Ancestries Reported - French (%)
Ancestries Reported - French Canadian (%)
Ancestries Reported - German (%)
Ancestries Reported - Greek (%)
Ancestries Reported - Hungarian (%)
Ancestries Reported - Irish (%)
Ancestries Reported - Italian (%)
Ancestries Reported - Lithuanian (%)
Ancestries Reported - Norwegian (%)
Ancestries Reported - Polish (%)
Ancestries Reported - Portuguese (%)
Ancestries Reported - Russian (%)
Ancestries Reported - Scotch-Irish (%)
Ancestries Reported - Scottish (%)
Ancestries Reported - Slovak (%)
Ancestries Reported - Subsaharan African (%)
Ancestries Reported - Swedish (%)
Ancestries Reported - Swiss (%)
Ancestries Reported - Ukrainian (%)
Ancestries Reported - United States (%)
Ancestries Reported - Welsh (%)
Ancestries Reported - West Indian (%)
Ancestries Reported - Other (%)
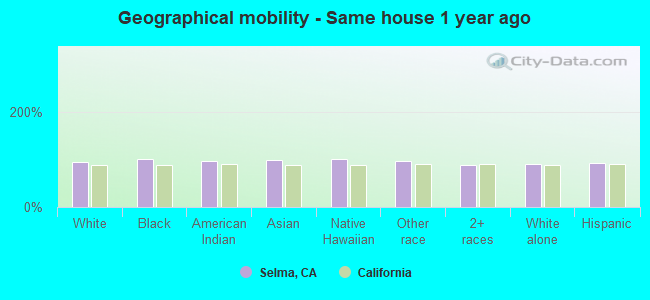
Geographical mobility - Same house 1 year ago (%)
Geographical mobility - Same house 1 year ago (%) - White
Geographical mobility - Same house 1 year ago (%) - Black or African American
Geographical mobility - Same house 1 year ago (%) - Asian
Geographical mobility - Same house 1 year ago (%) - Hispanic or Latino
Geographical mobility - Same house 1 year ago (%) - American Indian and Alaska Native
Geographical mobility - Same house 1 year ago (%) - Multirace
Geographical mobility - Same house 1 year ago (%) - Other Race
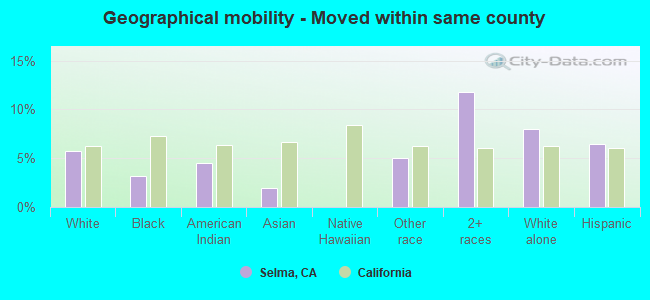
Geographical mobility - Moved within same county (%)
Geographical mobility - Moved within same county (%) - White
Geographical mobility - Moved within same county (%) - Black or African American
Geographical mobility - Moved within same county (%) - Asian
Geographical mobility - Moved within same county (%) - Hispanic or Latino
Geographical mobility - Moved within same county (%) - American Indian and Alaska Native
Geographical mobility - Moved within same county (%) - Multirace
Geographical mobility - Moved within same county (%) - Other Race
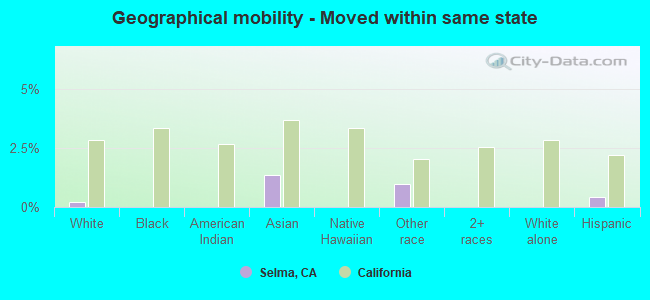
Geographical mobility - Moved from different county within same state (%)
Geographical mobility - Moved from different county within same state (%) - White
Geographical mobility - Moved from different county within same state (%) - Black or African American
Geographical mobility - Moved from different county within same state (%) - Asian
Geographical mobility - Moved from different county within same state (%) - Hispanic or Latino
Geographical mobility - Moved from different county within same state (%) - American Indian and Alaska Native
Geographical mobility - Moved from different county within same state (%) - Multirace
Geographical mobility - Moved from different county within same state (%) - Other Race
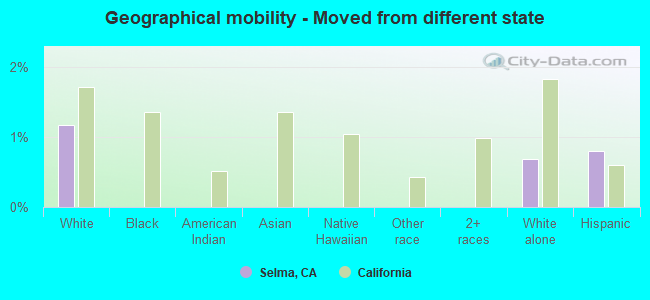
Geographical mobility - Moved from different state (%)
Geographical mobility - Moved from different state (%) - White
Geographical mobility - Moved from different state (%) - Black or African American
Geographical mobility - Moved from different state (%) - Asian
Geographical mobility - Moved from different state (%) - Hispanic or Latino
Geographical mobility - Moved from different state (%) - American Indian and Alaska Native
Geographical mobility - Moved from different state (%) - Multirace
Geographical mobility - Moved from different state (%) - Other Race
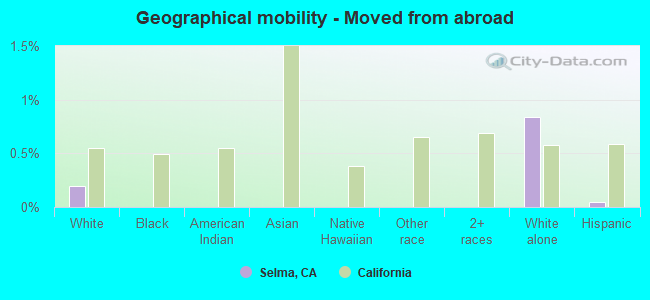
Geographical mobility - Moved from abroad (%)
Geographical mobility - Moved from abroad (%) - White
Geographical mobility - Moved from abroad (%) - Black or African American
Geographical mobility - Moved from abroad (%) - Asian
Geographical mobility - Moved from abroad (%) - Hispanic or Latino
Geographical mobility - Moved from abroad (%) - American Indian and Alaska Native
Geographical mobility - Moved from abroad (%) - Multirace
Geographical mobility - Moved from abroad (%) - Other Race
Place of birth for the foreign-born population - Ireland (%)
Place of birth for the foreign-born population - Denmark (%)
Place of birth for the foreign-born population - Norway (%)
Place of birth for the foreign-born population - Sweden (%)
Place of birth for the foreign-born population - United Kingdom (%)
Place of birth for the foreign-born population - England (%)
Place of birth for the foreign-born population - Scotland (%)
Place of birth for the foreign-born population - Other Northern Europe (%)
Place of birth for the foreign-born population - Austria (%)
Place of birth for the foreign-born population - Belgium (%)
Place of birth for the foreign-born population - France (%)
Place of birth for the foreign-born population - Germany (%)
Place of birth for the foreign-born population - Netherlands (%)
Place of birth for the foreign-born population - Switzerland (%)
Place of birth for the foreign-born population - Other Western Europe (%)
Place of birth for the foreign-born population - Greece (%)
Place of birth for the foreign-born population - Italy (%)
Place of birth for the foreign-born population - Portugal (%)
Place of birth for the foreign-born population - Spain (%)
Place of birth for the foreign-born population - Other Southern Europe (%)
Place of birth for the foreign-born population - Albania (%)
Place of birth for the foreign-born population - Belarus (%)
Place of birth for the foreign-born population - Bosnia and Herzegovina (%)
Place of birth for the foreign-born population - Bulgaria (%)
Place of birth for the foreign-born population - Croatia (%)
Place of birth for the foreign-born population - Czechoslovakia (%)
Place of birth for the foreign-born population - Hungary (%)
Place of birth for the foreign-born population - Latvia (%)
Place of birth for the foreign-born population - Lithuania (%)
Place of birth for the foreign-born population - North Macedonia (Macedonia) (%)
Place of birth for the foreign-born population - Moldova (%)
Place of birth for the foreign-born population - Poland (%)
Place of birth for the foreign-born population - Romania (%)
Place of birth for the foreign-born population - Russia (%)
Place of birth for the foreign-born population - Serbia (%)
Place of birth for the foreign-born population - Ukraine (%)
Place of birth for the foreign-born population - Other Eastern Europe (%)
Place of birth for the foreign-born population - China (%)
Place of birth for the foreign-born population - Hong Kong (%)
Place of birth for the foreign-born population - Taiwan (%)
Place of birth for the foreign-born population - Japan (%)
Place of birth for the foreign-born population - Korea (%)
Place of birth for the foreign-born population - Other Eastern Asia (%)
Place of birth for the foreign-born population - Afghanistan (%)
Place of birth for the foreign-born population - Bangladesh (%)
Place of birth for the foreign-born population - India (%)
Place of birth for the foreign-born population - Iran (%)
Place of birth for the foreign-born population - Kazakhstan (%)
Place of birth for the foreign-born population - Nepal (%)
Place of birth for the foreign-born population - Pakistan (%)
Place of birth for the foreign-born population - Sri Lanka (%)
Place of birth for the foreign-born population - Uzbekistan (%)
Place of birth for the foreign-born population - Other South Central Asia (%)
Place of birth for the foreign-born population - Burma (%)
Place of birth for the foreign-born population - Cambodia (%)
Place of birth for the foreign-born population - Indonesia (%)
Place of birth for the foreign-born population - Laos (%)
Place of birth for the foreign-born population - Malaysia (%)
Place of birth for the foreign-born population - Philippines (%)
Place of birth for the foreign-born population - Singapore (%)
Place of birth for the foreign-born population - Thailand (%)
Place of birth for the foreign-born population - Vietnam (%)
Place of birth for the foreign-born population - Other South Eastern Asia (%)
Place of birth for the foreign-born population - Armenia (%)
Place of birth for the foreign-born population - Iraq (%)
Place of birth for the foreign-born population - Israel (%)
Place of birth for the foreign-born population - Jordan (%)
Place of birth for the foreign-born population - Kuwait (%)
Place of birth for the foreign-born population - Lebanon (%)
Place of birth for the foreign-born population - Saudi Arabia (%)
Place of birth for the foreign-born population - Syria (%)
Place of birth for the foreign-born population - Turkey (%)
Place of birth for the foreign-born population - Yemen (%)
Place of birth for the foreign-born population - Other Western Asia (%)
Place of birth for the foreign-born population - Eritrea (%)
Place of birth for the foreign-born population - Ethiopia (%)
Place of birth for the foreign-born population - Kenya (%)
Place of birth for the foreign-born population - Somalia (%)
Place of birth for the foreign-born population - Uganda (%)
Place of birth for the foreign-born population - Zimbabwe (%)
Place of birth for the foreign-born population - Other Eastern Africa (%)
Place of birth for the foreign-born population - Cameroon (%)
Place of birth for the foreign-born population - Congo (%)
Place of birth for the foreign-born population - Democratic Republic of Congo (Zaire) (%)
Place of birth for the foreign-born population - Other Middle Africa (%)
Place of birth for the foreign-born population - Egypt (%)
Place of birth for the foreign-born population - Morocco (%)
Place of birth for the foreign-born population - Sudan (%)
Place of birth for the foreign-born population - Other Northern Africa (%)
Place of birth for the foreign-born population - South Africa (%)
Place of birth for the foreign-born population - Other Southern Africa (%)
Place of birth for the foreign-born population - Cabo Verde (%)
Place of birth for the foreign-born population - Ghana (%)
Place of birth for the foreign-born population - Liberia (%)
Place of birth for the foreign-born population - Nigeria (%)
Place of birth for the foreign-born population - Senegal (%)
Place of birth for the foreign-born population - Sierra Leone (%)
Place of birth for the foreign-born population - Other Western Africa (%)
Place of birth for the foreign-born population - Australia (%)
Place of birth for the foreign-born population - New Zealand (%)
Place of birth for the foreign-born population - Fiji (%)
Place of birth for the foreign-born population - Micronesia (%)
Place of birth for the foreign-born population - Bahamas (%)
Place of birth for the foreign-born population - Barbados (%)
Place of birth for the foreign-born population - Cuba (%)
Place of birth for the foreign-born population - Dominica (%)
Place of birth for the foreign-born population - Dominican Republic (%)
Place of birth for the foreign-born population - Grenada (%)
Place of birth for the foreign-born population - Haiti (%)
Place of birth for the foreign-born population - Jamaica (%)
Place of birth for the foreign-born population - St. Vincent and the Grenadines (%)
Place of birth for the foreign-born population - Trinidad and Tobago (%)
Place of birth for the foreign-born population - West Indies (%)
Place of birth for the foreign-born population - Other Caribbean (%)
Place of birth for the foreign-born population - Belize (%)
Place of birth for the foreign-born population - Costa Rica (%)
Place of birth for the foreign-born population - El Salvador (%)
Place of birth for the foreign-born population - Guatemala (%)
Place of birth for the foreign-born population - Honduras (%)
Place of birth for the foreign-born population - Mexico (%)
Place of birth for the foreign-born population - Nicaragua (%)
Place of birth for the foreign-born population - Panama (%)
Place of birth for the foreign-born population - Other Central America (%)
Place of birth for the foreign-born population - Argentina (%)
Place of birth for the foreign-born population - Bolivia (%)
Place of birth for the foreign-born population - Brazil (%)
Place of birth for the foreign-born population - Chile (%)
Place of birth for the foreign-born population - Colombia (%)
Place of birth for the foreign-born population - Ecuador (%)
Place of birth for the foreign-born population - Guyana (%)
Place of birth for the foreign-born population - Peru (%)
Place of birth for the foreign-born population - Uruguay (%)
Place of birth for the foreign-born population - Venezuela (%)
Place of birth for the foreign-born population - Other South America (%)
Place of birth for the foreign-born population - Canada (%)
Place of birth for the foreign-born population - Other Northern America (%)
Place of birth for the foreign-born population - Other (%)
Latest news about races in Selma, CA collected exclusively by city-data.com from local newspapers, TV, and radio stations
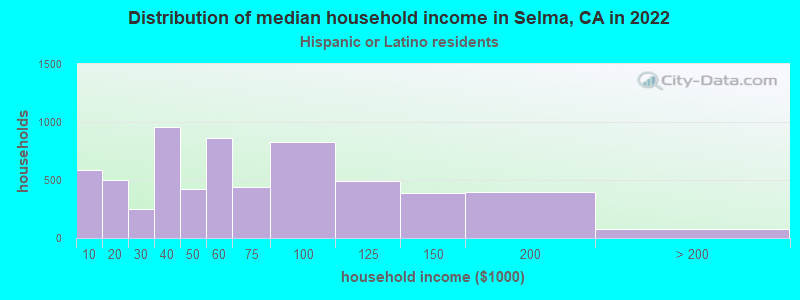
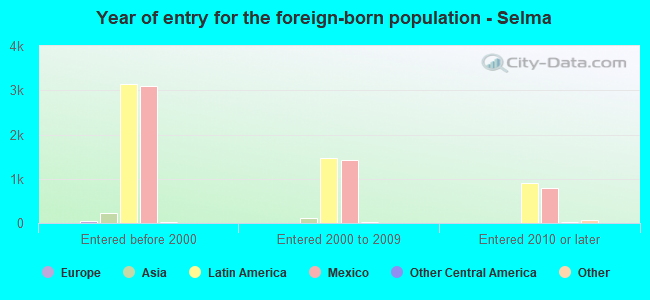
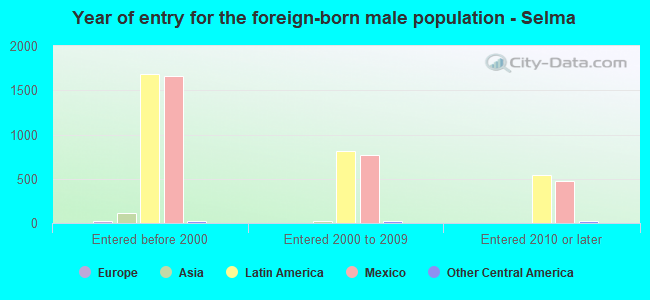
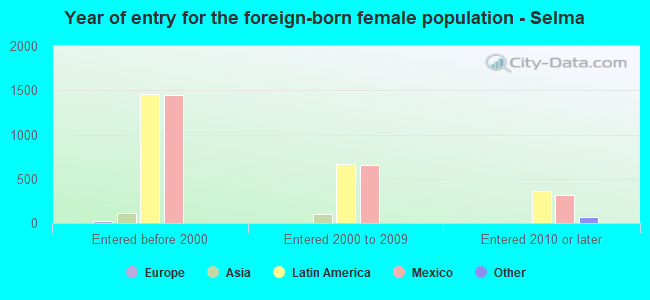
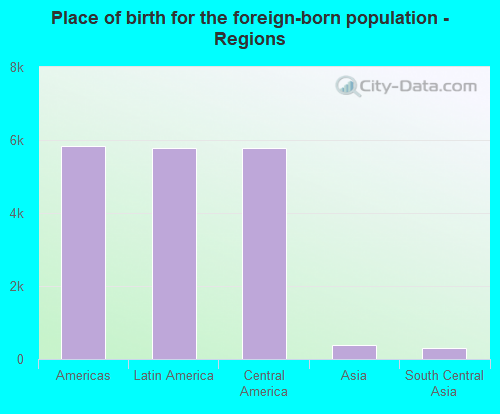
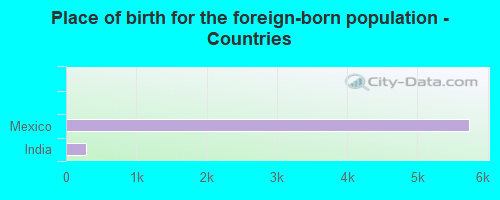
According to 2022 data, the most numerous races in Selma, CA are Hispanic (21,698 residents), White alone (2,505 residents), and Asian alone (873 residents). 41.1% of Selma residents speak English at home. 25.0% of Selma, CA residents are foreign-born (23.2% born in Latin America), which is 4.2% less than the foreign-born rate of 26.0% across the entire state of California.
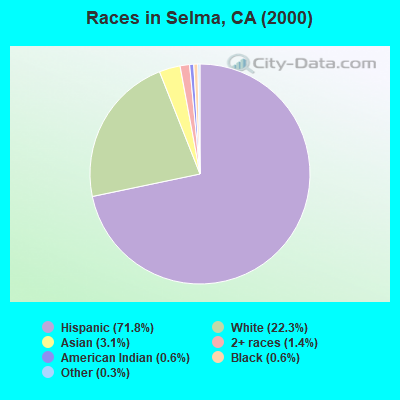
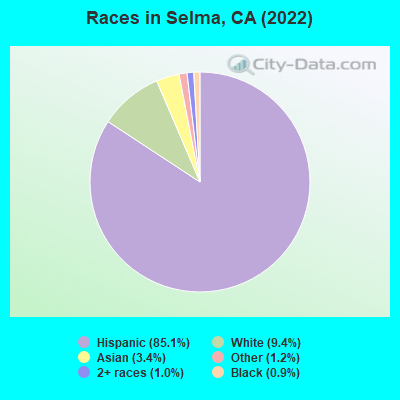
Race distribution in Selma
2000 2022
15,816,790 46.7% White alone 10,966,556 32.4% Hispanic 3,648,860 10.8% Asian alone 2,181,926 6.4% Black alone 903,115 2.7% Two or more races 178,984 0.5% American Indian alone 103,736 0.3% Native Hawaiian and Other 71,681 0.2% Other race alone
15,732,184 40.3% Hispanic 13,160,426 33.7% White alone 5,957,867 15.3% Asian alone 2,025,218 5.2% Black alone 1,663,222 4.3% Two or more races 251,618 0.6% Other race alone 135,777 0.3% Native Hawaiian and Other 103,030 0.3% American Indian alone
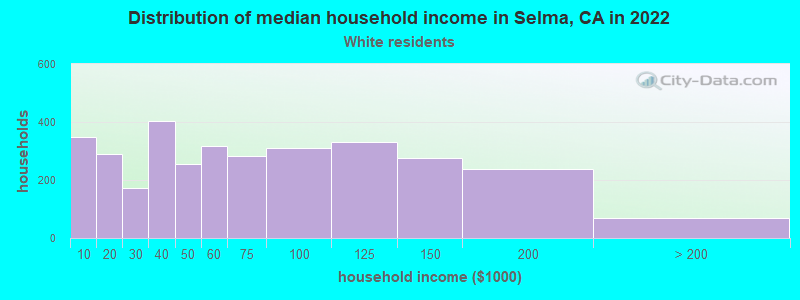
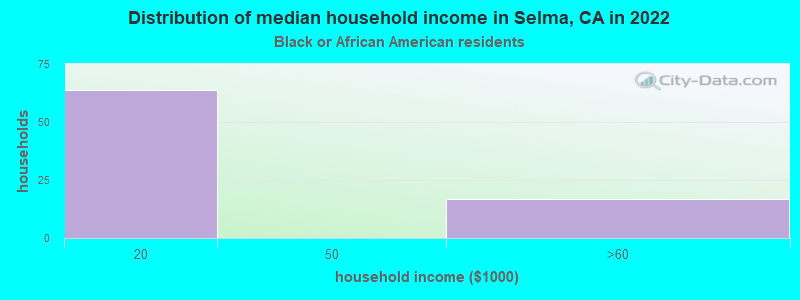
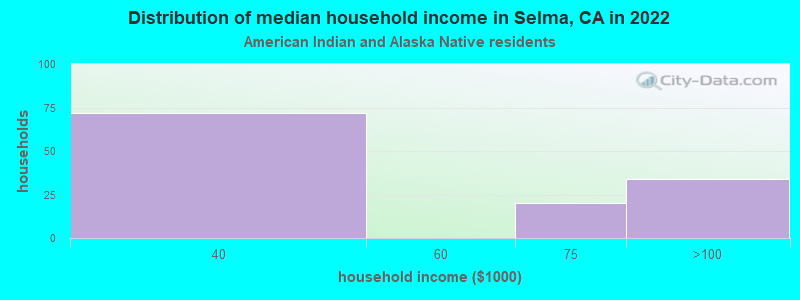
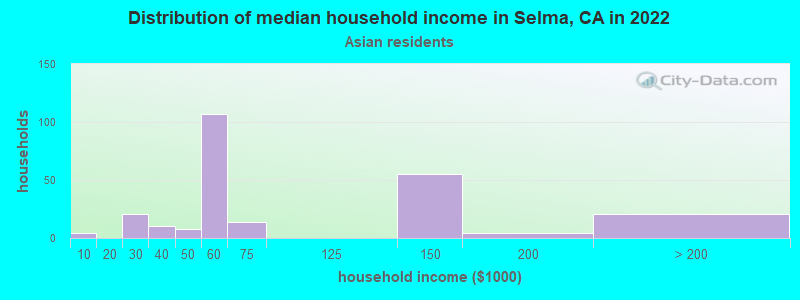
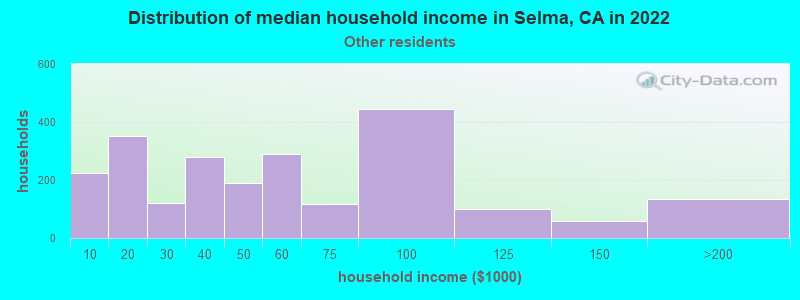
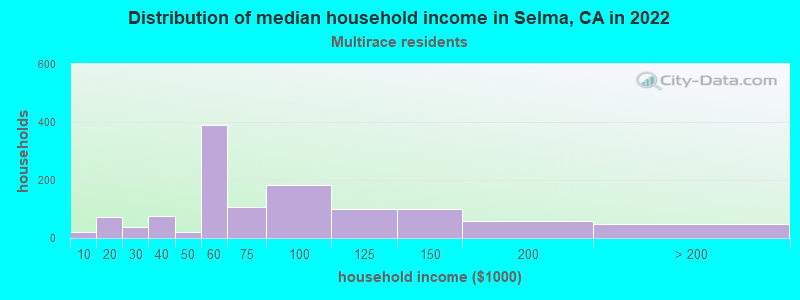
Income and house value in Selma Median household income in 2022 $59,267 White non-Hispanic householders$91,690 Black householders$50,054 American Indian and Alaska Native householders$103,741 Asian householders$96,263 Native Hawaiian and other Pacific Islander householders$65,412 Some other race householders$89,024 Two or more races householders$55,965 Hispanic or Latino race householdersMedian 2022 house value $376,486 White Non-Hispanic householders$427,596 Black or African American householders$290,103 American Indian or Alaska Native householders $393,762 Asian householders$317,097 Some other race householders$404,920 Two or more races householders$318,537 Hispanic or Latino householders
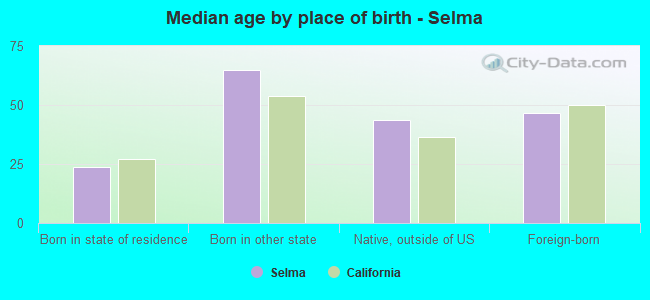
Median age by race in Selma
31.8 Median age for White residents30.6 35.2 69.6 Median age for Black or African American residents28.0 Median age for American Indian / Alaska Native residents27.2 28.2 36.4 Median age for Asian residents26.2 35.8 29.9 Median age for Native Hawaiian / Pacific Islander residents26.7 48.8 33.9 Median age for Other race residents32.4 37.5 35.6 Median age for Two or more races residents26.6 57.3 55.0 Median age for White alone residents45.6 60.0 30.2 Median age for Hispanic or Latino residents29.4 30.7
Owner/renter occupied households by race in Selma
House owners and renters - White residents 2,997 60.4% Owner occupied1,965 39.6% Renter occupiedHouse owners and renters - Black or African American residents 59 100.0% Owner occupiedHouse owners and renters - American Indian / Alaska Native residents 82 79.9% Owner occupied20 20.1% Renter occupiedHouse owners and renters - Asian residents 268 84.7% Owner occupied48 15.3% Renter occupiedHouse owners and renters - Native Hawaiian / Pacific Islander residents 24 100.0% Owner occupiedHouse owners and renters - Other race residents 443 49.9% Owner occupied444 50.1% Renter occupiedHouse owners and renters - Two or more races residents 592 63.0% Owner occupied348 37.0% Renter occupiedHouse owners and renters - White alone residents 909 82.9% Owner occupied187 17.1% Renter occupiedHouse owners and renters - Hispanic or Latino residents 3,357 55.0% Owner occupied2,742 45.0% Renter occupied
Language usage in Selma
English speakers - Total 41.1% of residents of Selma speak English at home.
55.2% of residents speak Spanish at home 7,419 59.0% Speak English very well5,163 41.0% Speak English less than very well3.0% of residents speak other language at home 468 68.7% Speak English very well213 31.3% Speak English less than very well
English speakers - Born in the United States 61.8% of residents of Selma speak English at home.
37.7% of residents speak Spanish at home 396 80.2% Speak English very well98 19.8% Speak English less than very well0.2% of residents speak other language at home 3 100.0% Speak English very well
English speakers - Native, born elsewhere 32.1% of residents of Selma speak English at home.
61.0% of residents speak Spanish at home 76 50.7% Speak English very well74 49.3% Speak English less than very well7.3% of residents speak other language at home 18 100.0% Speak English very well
English speakers - Foreign-born 3.2% of residents of Selma speak English at home.
86.7% of residents speak Spanish at home 1,401 26.4% Speak English very well3,899 73.6% Speak English less than very well6.7% of residents speak other language at home 211 51.2% Speak English very well201 48.8% Speak English less than very well
White (Caucasian) - Speak only English Native:
56.5% (6,426)Foreign-born:
3.5% (109)
White (Caucasian) - Speak another language Native:
36.0% (4,094)Foreign-born:
93.0% (2,896)
American Indian / Alaska Native - Speak another language Native:
14.5% (50)Foreign-born:
91.9% (21)
Asian - Speak only English Native:
49.0% (236)Foreign-born:
1.8% (7)
Asian - Speak another language Native:
50.4% (243)Foreign-born:
97.4% (361)
Other race - Speak only English Native:
50.4% (961)Foreign-born:
1.3% (11)
Other race - Speak another language Native:
51.7% (986)Foreign-born:
98.3% (879)
Two or more races - Speak another language Native:
52.5% (1,292)Foreign-born:
100.0% (247)
White alone - Speak only English Native:
97.3% (2,312)Foreign-born:
5.2% (4)
White alone - Speak another language Native:
2.4% (58)Foreign-born:
100.0% (74)
Hispanic or Latino - Speak only English Native:
47.4% (7,007)Foreign-born:
2.8% (151)
Hispanic or Latino - Speak another language Native:
53.1% (7,848)Foreign-born:
96.7% (5,191)
Foreign-born residents in Selma 6,261 residents are foreign born (23.2% Latin America ).
This city:
25.0%California:
100.0%
Marital status for residents in Selma Marital status - White (Caucasian) population 15 years and over
Males 44.9% Never married46.9% Now married0.5% Separated1.6% Widowed6.1% DivorcedFemales 28.2% Never married46.5% Now married2.3% Separated9.5% Widowed13.4% DivorcedWomen who gave birth in the past 12 months Now married:
45.3% (95)Unmarried:
54.7% (114)
Women who did not give birth in the past 12 months Now married:
49.9% (1,685)Unmarried:
50.1% (1,690)
Marital status - Black or African American population 15 years and over
Males 3.4% Never married44.8% Now married1.7% Separated0.0% Widowed50.0% DivorcedFemales 0.0% Never married92.0% Now married0.0% Separated0.0% Widowed8.0% DivorcedWomen who did not give birth in the past 12 months Now married:
0.0% (0)Unmarried:
100.0% (2)
Marital status - American Indian / Alaska Native population 15 years and over
Males 86.3% Never married13.7% Now married0.0% Separated0.0% Widowed0.0% DivorcedFemales 65.3% Never married23.1% Now married0.0% Separated0.0% Widowed11.6% DivorcedWomen who did not give birth in the past 12 months Now married:
20.0% (28)Unmarried:
80.0% (113)
Marital status - Asian population 15 years and over
Males 6.5% Never married88.5% Now married0.0% Separated5.1% Widowed0.0% DivorcedFemales 33.3% Never married49.3% Now married0.0% Separated13.8% Widowed3.5% DivorcedWomen who gave birth in the past 12 months Now married:
100.0% (24)Unmarried:
0.0% (0)
Women who did not give birth in the past 12 months Now married:
34.4% (100)Unmarried:
65.6% (191)
Marital status - Native Hawaiian / Pacific Islander population 15 years and over
Males 52.0% Never married48.0% Now married0.0% Separated0.0% Widowed0.0% DivorcedFemales 48.0% Never married22.5% Now married0.0% Separated0.0% Widowed29.4% DivorcedWomen who did not give birth in the past 12 months Now married:
0.0% (0)Unmarried:
100.0% (76)
Marital status - Other race population 15 years and over
Males 34.4% Never married49.4% Now married1.0% Separated2.9% Widowed12.4% DivorcedFemales 43.4% Never married32.0% Now married5.5% Separated10.2% Widowed9.0% DivorcedWomen who gave birth in the past 12 months Now married:
50.8% (37)Unmarried:
49.2% (35)
Women who did not give birth in the past 12 months Now married:
25.5% (181)Unmarried:
74.5% (528)
Marital status - Two or more races population 15 years and over
Males 40.8% Never married51.8% Now married0.0% Separated5.0% Widowed2.4% DivorcedFemales 46.1% Never married33.9% Now married0.0% Separated16.3% Widowed3.6% DivorcedWomen who did not give birth in the past 12 months Now married:
8.7% (57)Unmarried:
91.3% (601)
Marital status - White alone, not Hispanic / Latino population 15 years and over
Males 33.6% Never married55.5% Now married0.0% Separated4.4% Widowed6.5% DivorcedFemales 20.6% Never married48.8% Now married1.8% Separated11.2% Widowed17.7% DivorcedWomen who gave birth in the past 12 months Now married:
0.0% (0)Unmarried:
100.0% (10)
Women who did not give birth in the past 12 months Now married:
48.6% (237)Unmarried:
51.4% (250)
Marital status - Hispanic or Latino population 15 years and over
Males 46.3% Never married45.1% Now married0.6% Separated1.5% Widowed6.5% DivorcedFemales 33.3% Never married43.0% Now married2.7% Separated9.5% Widowed11.6% DivorcedWomen who gave birth in the past 12 months Now married:
47.9% (158)Unmarried:
52.1% (172)
Women who did not give birth in the past 12 months Now married:
44.2% (2,156)Unmarried:
55.8% (2,723)
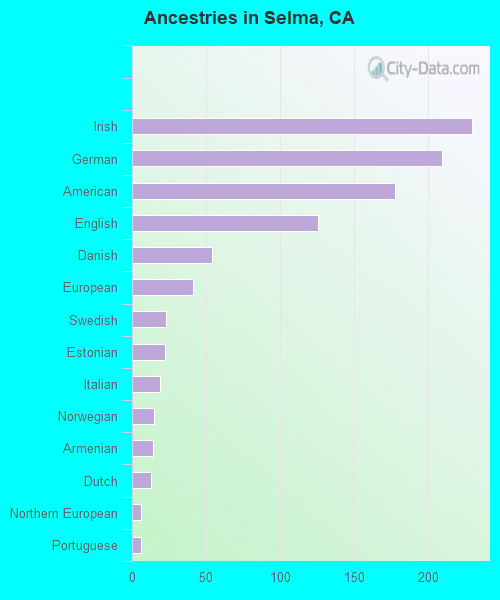
Ancestries in Selma
144 0.8% Irish121 0.7% German108 0.6% American99 0.5% English81 0.4% Dutch52 0.3% Italian44 0.2% European39 0.2% Danish14 0.08% Norwegian13 0.07% Portuguese10 0.05% Northern European7 0.04% Arab7 0.04% Estonian6 0.03% Armenian6 0.03% Polish6 0.03% Swedish2 0.01% Swiss
Geographical mobility in Selma Same house 1 year ago 14,825 93.6% White (Caucasian)82 100.0% Black or African American332 97.2% American Indian / Alaska Native867 98.4% Asian203 100.0% Native Hawaiian / Pacific Islander2,792 96.0% Other race2,579 87.7% Two or more races2,301 90.4% White alone, not Hispanic / Latino19,201 92.4% Hispanic or LatinoMoved within same county 910 5.7% White / Caucasian3 3.1% Black or African American15 4.5% American Indian / Alaska Native17 2.0% Asian145 5.0% Other race345 11.8% Two or more races204 8.0% White alone, not Hispanic / Latino1,341 6.5% Hispanic or LatinoMoved within same state 36 0.2% White / Caucasian12 1.3% Asian29 1.0% Other race84 0.4% Hispanic or LatinoMoved from different state 185 1.2% White / Caucasian18 0.7% White alone, not Hispanic / Latino166 0.8% Hispanic or LatinoMoved from abroad 30 0.2% White21 0.8% White alone, not Hispanic / Latino10 0.0% Hispanic or Latino
Children Nativity (place of birth) in Selma
Children under 6 years - Living with two parents Both parents native 538 100.0% NativeBoth parents foreign-born 371 84.3% Native69 15.7% Foreign-bornOne native, one foreign-born parent 211 100.0% NativeChildren under 6 years - Living with one parent Native parent 621 100.0% NativeForeign-born parent 240 100.0% NativeChildren 6 to 17 years - Living with two parents Both parents native 1,973 100.0% NativeBoth parents foreign-born 878 89.1% Native107 10.9% Foreign-bornOne native, one foreign-born parent 243 91.6% Native22 8.4% Foreign-bornChildren 6 to 17 years - Living with one parent Native parent 889 100.0% NativeForeign-born parent 799 50.9% Native771 49.1% Foreign-born
Grandparents responsible for own grandchildren in Selma
Grandparents (30 to 59 years) White / Caucasian 120 63.6% Responsible for grandchildren69 36.4% Not responsible for grandchildrenNative Hawaiian / Pacific Islander 55 100.0% Not responsible for grandchildrenOther race 7 5.9% Responsible for grandchildren106 94.1% Not responsible for grandchildrenTwo or more races 162 100.0% Not responsible for grandchildrenWhite alone, not Hispanic / Latino 4 11.3% Responsible for grandchildren29 88.7% Not responsible for grandchildrenHispanic or Latino 212 49.6% Responsible for grandchildren216 50.4% Not responsible for grandchildrenGrandparents (60 years and over) White / Caucasian 185 37.6% Responsible for grandchildren307 62.4% Not responsible for grandchildrenOther race 147 65.8% Responsible for grandchildren76 34.2% Not responsible for grandchildrenTwo or more races 63 55.4% Responsible for grandchildren51 44.6% Not responsible for grandchildrenWhite alone, not Hispanic / Latino 80 81.5% Responsible for grandchildren18 18.5% Not responsible for grandchildrenHispanic or Latino 362 44.3% Responsible for grandchildren456 55.7% Not responsible for grandchildren