Races in Shafter, California (CA) Detailed Stats
Ancestries, Foreign-born residents, place of birth
Settings
X


Recent posts about races in Shafter, California on our local forum with over 2,400,000 registered users:
 | Would moving to the Bay Area be a terrible idea for me? (32 replies) |
| Farm Hill Road (40 replies) |
| Oakland is probably better than SF (173 replies) |
| Bakersfield rush hour commute, smaller towns? (9 replies) |
| Roommates might be needed (4 replies) |
| Oakland Considering Filing Bankruptcy (220 replies) |
Latest news about races in Shafter, CA collected exclusively by city-data.com from local newspapers, TV, and radio stations
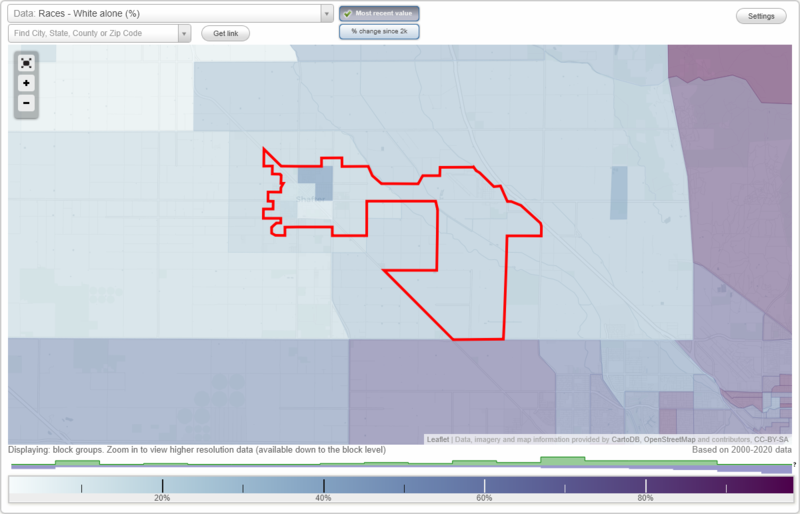
According to 2022 data, the most numerous races in Shafter, CA are Hispanic (16,962 residents), White alone (2,289 residents), and Asian alone (117 residents). 30.0% of Shafter residents speak English at home. 29.4% of Shafter, CA residents are foreign-born (28.9% born in Latin America), which is 11.6% greater than the foreign-born rate of 26.0% across the entire state of California.
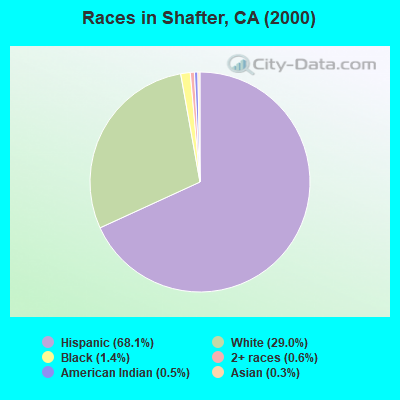
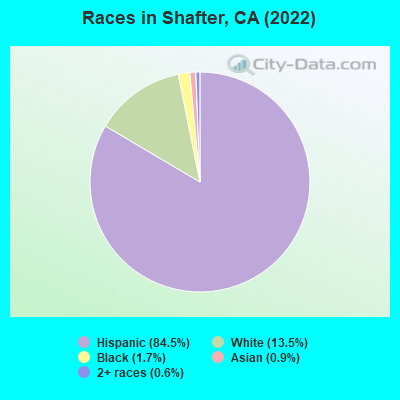
Race distribution in Shafter
2000
2022

- 8,66768.1%Hispanic
- 3,69329.0%White alone
- 1811.4%Black alone
- 820.6%Two or more races
- 590.5%American Indian alone
- 380.3%Asian alone
- 100.08%Native Hawaiian and Other
Pacific Islander alone - 60.05%Other race alone
-
- 16,96286.6%Hispanic
- 2,28911.7%White alone
- 3661.9%Black alone
- 1170.6%Asian alone
- 1140.6%Two or more races
- 270.1%American Indian alone
2000
2022
-
- 15,816,79046.7%White alone
- 10,966,55632.4%Hispanic
- 3,648,86010.8%Asian alone
- 2,181,9266.4%Black alone
- 903,1152.7%Two or more races
- 178,9840.5%American Indian alone
- 103,7360.3%Native Hawaiian and Other
Pacific Islander alone - 71,6810.2%Other race alone

-
- 15,732,18440.3%Hispanic
- 13,160,42633.7%White alone
- 5,957,86715.3%Asian alone
- 2,025,2185.2%Black alone
- 1,663,2224.3%Two or more races
- 251,6180.6%Other race alone
- 135,7770.3%Native Hawaiian and Other
Pacific Islander alone - 103,0300.3%American Indian alone

Income and house value in Shafter
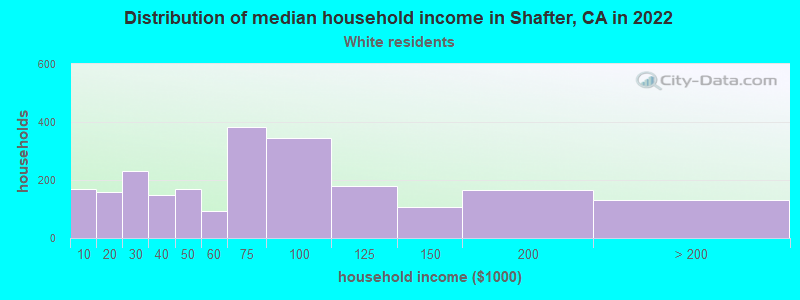
- Median household income in 2022
- $76,044White non-Hispanic householders
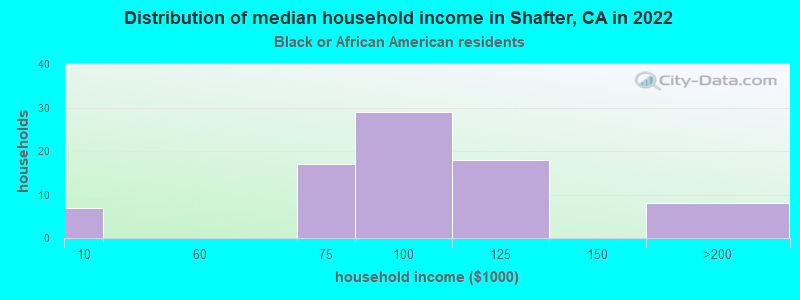
- $75,204Black householders
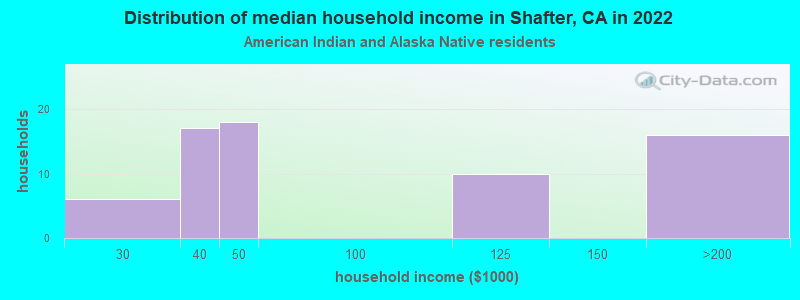
- $18,258American Indian and Alaska Native householders
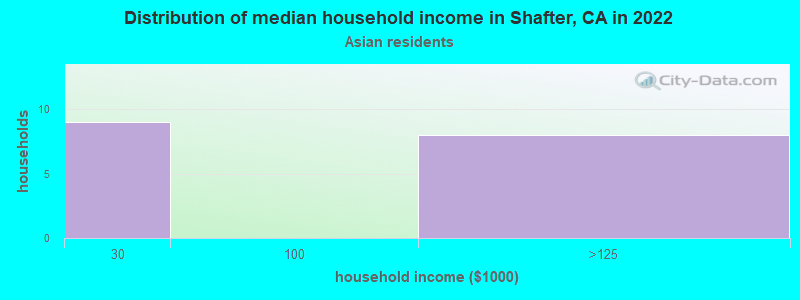
- $120,428Asian householders
- $101,244Native Hawaiian and other Pacific Islander householders
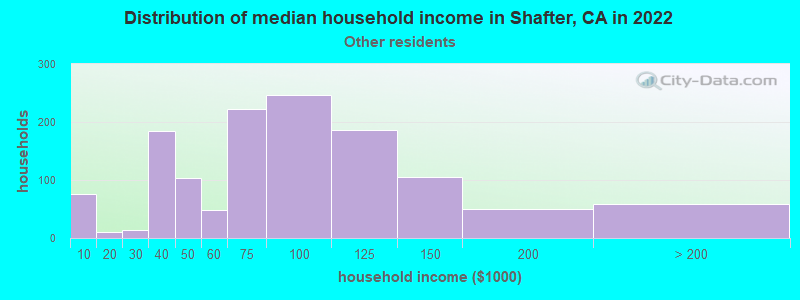
- $54,412Some other race householders
- $78,873Two or more races householders
- $54,819Hispanic or Latino race householders
- Median 2022 house value
- $313,138White Non-Hispanic householders
- $266,347American Indian or Alaska Native householders
- $584,885Asian householders
- $265,268Some other race householders
- $299,821Two or more races householders
- $268,867Hispanic or Latino householders
Household income for White non-Hispanic householders
Household income for Black householders
Household income for American Indian and Alaska Native householders
Household income for Asian householders
Household income for Some other race householders
Household income for Two or more races householders
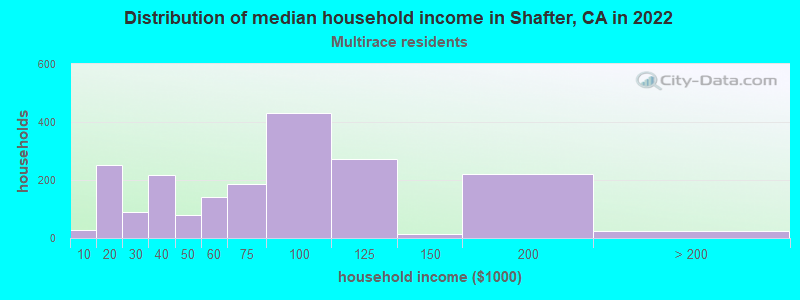
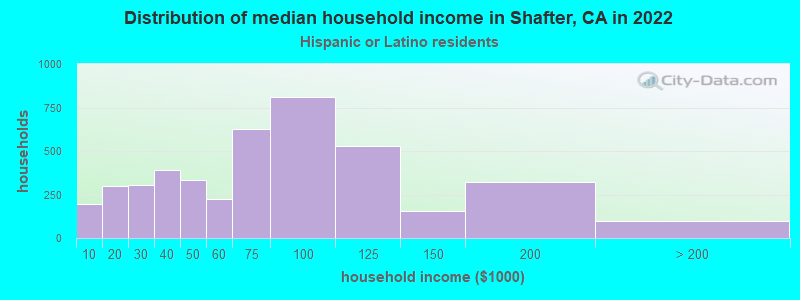
Household income for Hispanic or Latino race householders
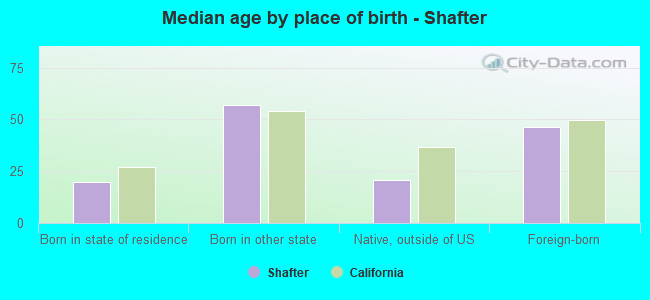
Median age by race in Shafter
- 28.3Median age for White residents
- 28.1Males
- 29.1Females
- 30.1Median age for Black or African American residents
- 30.3Males
- 18.9Females
- 72.8Median age for American Indian / Alaska Native residents
- 36.7Median age for Asian residents
- 33.9Males
- 37.9Females
- 38.8Median age for Native Hawaiian / Pacific Islander residents
- 30.4Median age for Other race residents
- 36.3Males
- 24.6Females
- 35.3Median age for Two or more races residents
- 37.9Males
- 38.2Females
- 47.8Median age for White alone residents
- 44.9Males
- 48.5Females
- 27.1Median age for Hispanic or Latino residents
- 27.9Males
- 25.5Females
Owner/renter occupied households by race in Shafter
- House owners and renters - White residents
- 1,97656.7%Owner occupied
- 1,51143.3%Renter occupied
- House owners and renters - Black or African American residents
- 3355.6%Owner occupied
- 2644.4%Renter occupied
- House owners and renters - American Indian / Alaska Native residents
- 53100.0%Owner occupied
- House owners and renters - Asian residents
- 22100.0%Owner occupied
- House owners and renters - Other race residents
- 58653.3%Owner occupied
- 51446.7%Renter occupied
- House owners and renters - Two or more races residents
- 37286.2%Owner occupied
- 5913.8%Renter occupied
- House owners and renters - White alone residents
- 72777.9%Owner occupied
- 20622.1%Renter occupied
- House owners and renters - Hispanic or Latino residents
- 2,20349.9%Owner occupied
- 2,21250.1%Renter occupied
Language usage in Shafter
- English speakers - Total
- 30.0% of residents of Shafter speak English at home.
- 67.4% of residents speak Spanish at home
- 5,63646.0%Speak English very well
- 6,61954.0%Speak English less than very well
- 1.1% of residents speak other language at home
- 15478.6%Speak English very well
- 4221.4%Speak English less than very well
- English speakers - Born in the United States
- 64.9% of residents of Shafter speak English at home.
- 32.6% of residents speak Spanish at home
- 19755.5%Speak English very well
- 15844.5%Speak English less than very well
- 1.7% of residents speak other language at home
- 18100.0%Speak English very well
- English speakers - Native, born elsewhere
- 15.5% of residents of Shafter speak English at home.
- 82.3% of residents speak Spanish at home
- 11652.0%Speak English very well
- 10748.0%Speak English less than very well
- 3.7% of residents speak other language at home
- 10100.0%Speak English very well
- English speakers - Foreign-born
- 3.4% of residents of Shafter speak English at home.
- 91.1% of residents speak Spanish at home
- 1,17722.7%Speak English very well
- 3,99977.3%Speak English less than very well
- 1.8% of residents speak other language at home
- 7170.3%Speak English very well
- 3029.7%Speak English less than very well
White (Caucasian) - Speak only English
| Native: | 43.9% (3,695) |
| Foreign-born: | 4.4% (122) |
White (Caucasian) - Speak another language
| Native: | 44.9% (3,775) |
| Foreign-born: | 91.3% (2,544) |
Asian - Speak another language
| Native: | 24.7% (17) |
| Foreign-born: | 97.0% (55) |
Other race - Speak only English
| Native: | 27.6% (676) |
| Foreign-born: | 3.5% (49) |
Other race - Speak another language
| Native: | 71.4% (1,750) |
| Foreign-born: | 96.4% (1,354) |
Two or more races - Speak another language
| Native: | 86.4% (759) |
| Foreign-born: | 100.0% (354) |
White alone - Speak only English
| Native: | 95.0% (1,988) |
| Foreign-born: | 9.8% (10) |
White alone - Speak another language
| Native: | 5.0% (105) |
| Foreign-born: | 100.0% (99) |
Hispanic or Latino - Speak only English
| Native: | 28.4% (3,082) |
| Foreign-born: | 3.8% (204) |
Hispanic or Latino - Speak another language
| Native: | 70.1% (7,600) |
| Foreign-born: | 95.8% (5,118) |
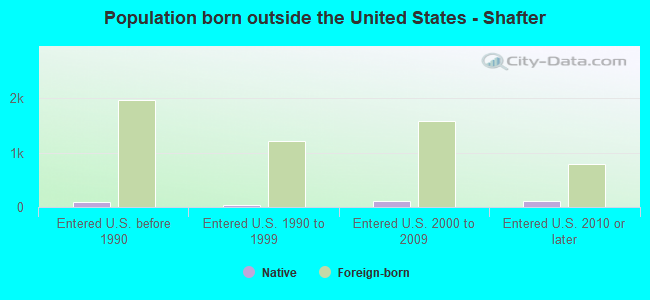
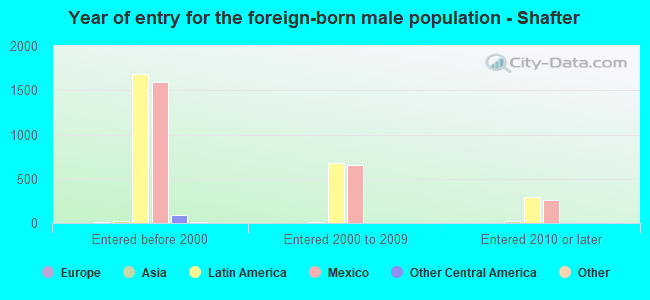
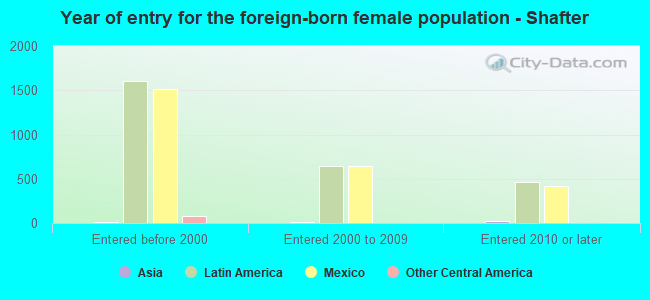
Foreign-born residents in Shafter
5,809 residents are foreign born (28.9% Latin America).
| This city: | 29.4% |
| California: | 100.0% |

Marital status for residents in Shafter
Marital status - White (Caucasian) population 15 years and over
- Males
- 43.5%Never married
- 48.0%Now married
- 1.0%Separated
- 3.7%Widowed
- 3.8%Divorced
- Females
- 35.6%Never married
- 48.4%Now married
- 2.9%Separated
- 6.9%Widowed
- 6.1%Divorced
Women who gave birth in the past 12 months
| Now married: | 49.8% (91) |
| Unmarried: | 50.2% (92) |
Women who did not give birth in the past 12 months
| Now married: | 46.9% (1,326) |
| Unmarried: | 53.1% (1,503) |
Marital status - Black or African American population 15 years and over
- Males
- 74.4%Never married
- 15.7%Now married
- 2.1%Separated
- 1.8%Widowed
- 6.0%Divorced
- Females
- 44.9%Never married
- 36.7%Now married
- 0.0%Separated
- 0.0%Widowed
- 18.4%Divorced
Women who did not give birth in the past 12 months
| Now married: | 36.7% (15) |
| Unmarried: | 63.3% (26) |
Marital status - American Indian / Alaska Native population 15 years and over
- Males
- 0.0%Never married
- 12.5%Now married
- 0.0%Separated
- 0.0%Widowed
- 87.5%Divorced
- Females
- 0.0%Never married
- 0.0%Now married
- 0.0%Separated
- 0.0%Widowed
- 100.0%Divorced
Marital status - Asian population 15 years and over
- Males
- 55.8%Never married
- 21.2%Now married
- 0.0%Separated
- 23.1%Widowed
- 0.0%Divorced
- Females
- 77.2%Never married
- 22.8%Now married
- 0.0%Separated
- 0.0%Widowed
- 0.0%Divorced
Women who did not give birth in the past 12 months
| Now married: | 22.8% (14) |
| Unmarried: | 77.2% (46) |
Marital status - Other race population 15 years and over
- Males
- 33.9%Never married
- 55.3%Now married
- 1.3%Separated
- 1.7%Widowed
- 7.8%Divorced
- Females
- 34.4%Never married
- 52.0%Now married
- 3.9%Separated
- 2.8%Widowed
- 6.9%Divorced
Women who gave birth in the past 12 months
| Now married: | 56.9% (47) |
| Unmarried: | 43.1% (36) |
Women who did not give birth in the past 12 months
| Now married: | 52.8% (571) |
| Unmarried: | 47.2% (511) |
Marital status - Two or more races population 15 years and over
- Males
- 71.3%Never married
- 15.2%Now married
- 2.2%Separated
- 0.0%Widowed
- 11.2%Divorced
- Females
- 32.2%Never married
- 26.4%Now married
- 0.0%Separated
- 10.3%Widowed
- 31.0%Divorced
Women who did not give birth in the past 12 months
| Now married: | 0.0% (0) |
| Unmarried: | 100.0% (131) |
Marital status - White alone, not Hispanic / Latino population 15 years and over
- Males
- 26.7%Never married
- 54.6%Now married
- 1.7%Separated
- 6.4%Widowed
- 10.7%Divorced
- Females
- 24.3%Never married
- 56.1%Now married
- 2.8%Separated
- 8.4%Widowed
- 8.5%Divorced
Women who gave birth in the past 12 months
| Now married: | 100.0% (20) |
| Unmarried: | 0.0% (0) |
Women who did not give birth in the past 12 months
| Now married: | 53.8% (244) |
| Unmarried: | 46.2% (210) |
Marital status - Hispanic or Latino population 15 years and over
- Males
- 46.3%Never married
- 47.0%Now married
- 0.9%Separated
- 2.7%Widowed
- 3.1%Divorced
- Females
- 37.8%Never married
- 47.1%Now married
- 3.0%Separated
- 5.9%Widowed
- 6.2%Divorced
Women who gave birth in the past 12 months
| Now married: | 47.3% (137) |
| Unmarried: | 52.7% (153) |
Women who did not give birth in the past 12 months
| Now married: | 46.5% (1,964) |
| Unmarried: | 53.5% (2,264) |
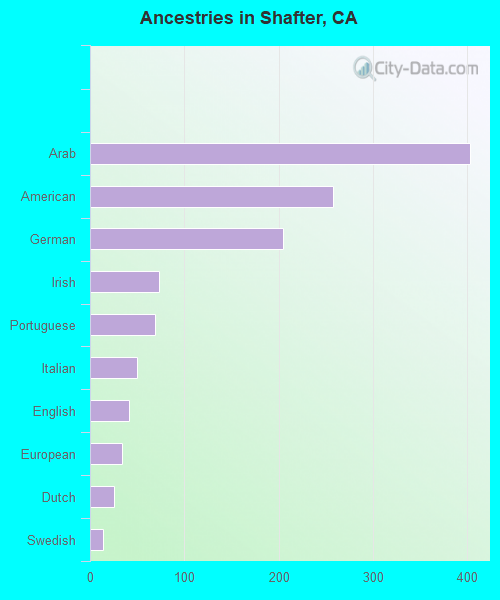
Ancestries in Shafter

- 2571.7%American
- 1521.0%German
- 1280.8%English
- 830.5%European
- 610.4%Portuguese
- 560.4%Irish
- 510.3%Russian
- 490.3%Afghan
- 260.2%Northern European
- 180.1%Dutch
- 170.1%Italian
- 80.05%Scotch-Irish
- 50.03%Scandinavian
- 40.03%Arab
- 40.03%Swedish
- 30.02%Scottish
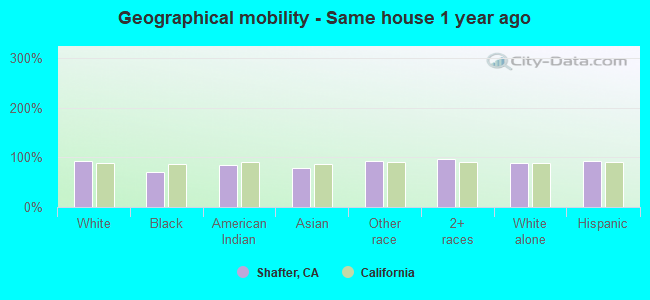
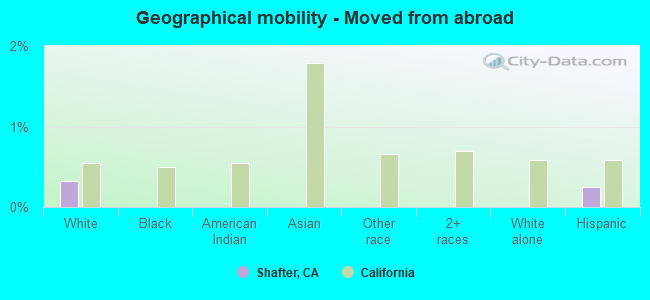
Geographical mobility in Shafter

- Same house 1 year ago
- 11,41992.8%White (Caucasian)
- 26469.6%Black or African American
- 3783.7%American Indian / Alaska Native
- 11479.1%Asian
- 2,93292.8%Other race
- 1,01496.4%Two or more races
- 2,04688.1%White alone, not Hispanic / Latino
- 15,43293.5%Hispanic or Latino
-
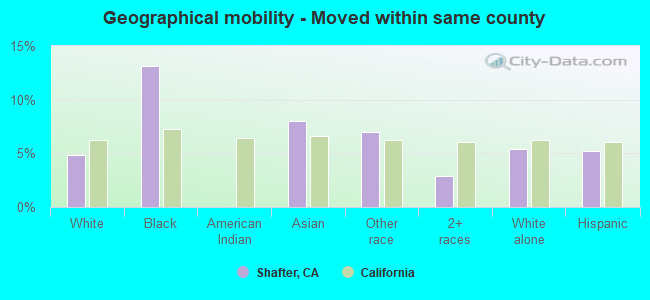
- Moved within same county
- 6014.9%White / Caucasian
- 5013.2%Black or African American
- 128.0%Asian
- 2217.0%Other race
- 302.9%Two or more races
- 1265.4%White alone, not Hispanic / Latino
- 8635.2%Hispanic or Latino
-
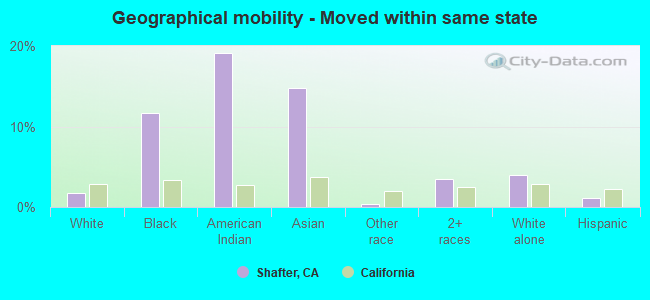
- Moved within same state
- 2071.7%White / Caucasian
- 4411.7%Black or African American
- 819.1%American Indian / Alaska Native
- 2114.7%Asian
- 100.3%Other race
- 373.5%Two or more races
- 913.9%White alone, not Hispanic / Latino
- 1821.1%Hispanic or Latino
-
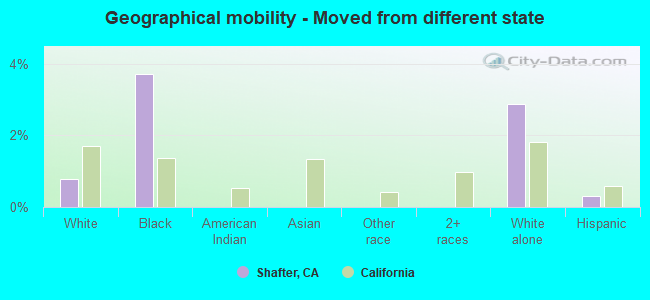
- Moved from different state
- 960.8%White / Caucasian
- 143.7%Black or African American
- 672.9%White alone, not Hispanic / Latino
- 490.3%Hispanic or Latino
-
- Moved from abroad
- 400.3%White
- 400.2%Hispanic or Latino
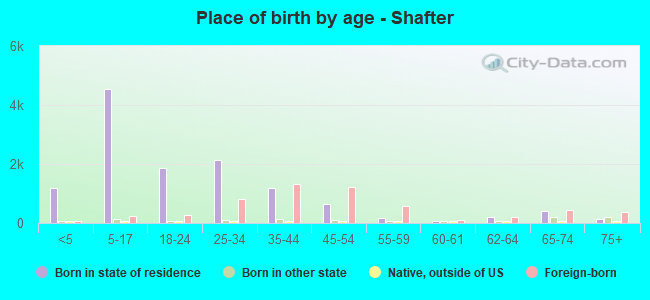
Children Nativity (place of birth) in Shafter
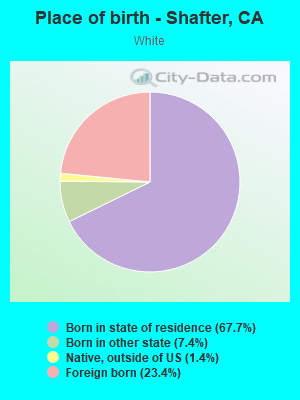
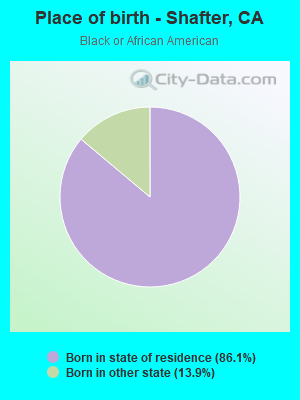
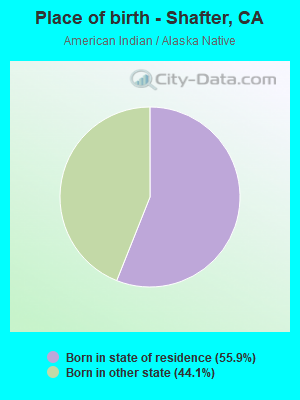
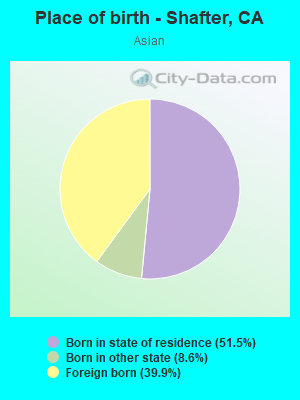
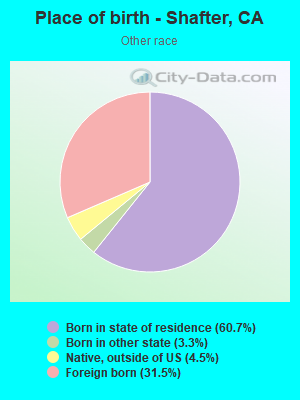
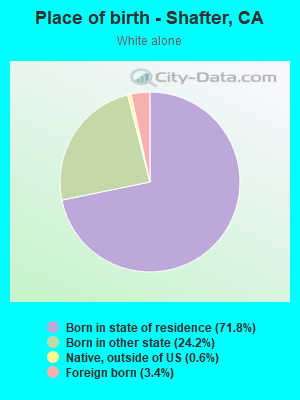
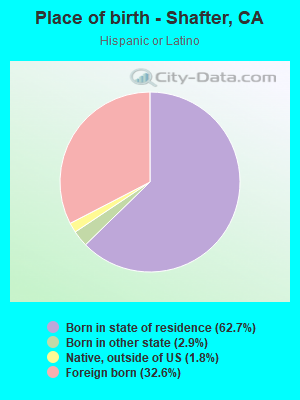
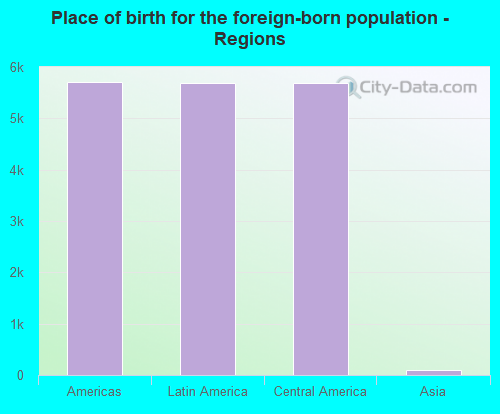
Place of birth for residents in Shafter
![Place of birth for the foreign-born population - Regions]()
- 5,707Americas
- 5,697Latin America
- 5,697Central America
- 89Asia
- 27South Central Asia
- 24Western Asia
- 19Eastern Asia
- 13Europe
- 13Western Europe
- 12South Eastern Asia
- 10Northern America
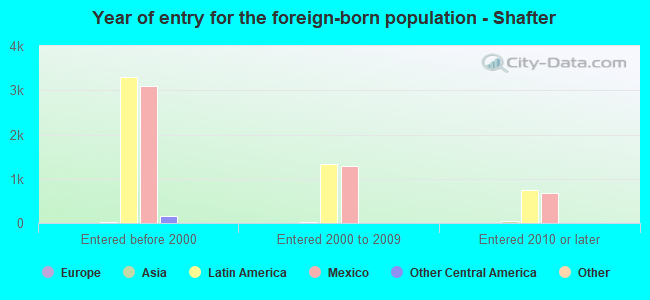
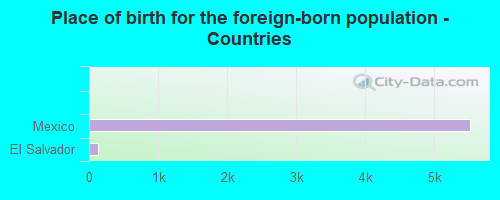
![Place of birth for the foreign-born population - Countries]()
- 5,515Mexico
- 127El Salvador
- 30Guatemala
- 24Yemen
- 24Honduras
- 19Korea
- 14India
- 13Germany
- 13Afghanistan
- 12Thailand
- 10Canada
Grandparents responsible for own grandchildren in Shafter
Zip codes: 93263.