Races in Shelton, Connecticut (CT) Detailed Stats
Data:
Races - White alone (%)
Races - White alone (% change since 2000)
Races - Black alone (%)
Races - Black alone (% change since 2000)
Races - American Indian alone (%)
Races - American Indian alone (% change since 2000)
Races - Asian alone (%)
Races - Asian alone (% change since 2000)
Races - Hispanic (%)
Races - Hispanic (% change since 2000)
Races - Native Hawaiian and Other Pacific Islander alone (%)
Races - Native Hawaiian and Other Pacific Islander alone (% change since 2000)
Races - Two or more races(%)
Races - Two or more races(% change since 2000)
Races - Other race alone (%)
Races - Other race alone (% change since 2000)
Racial diversity
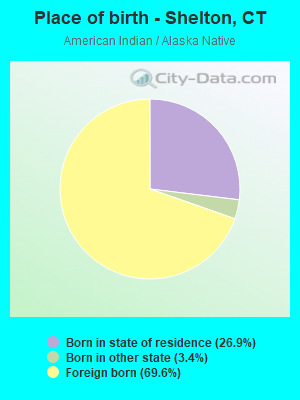
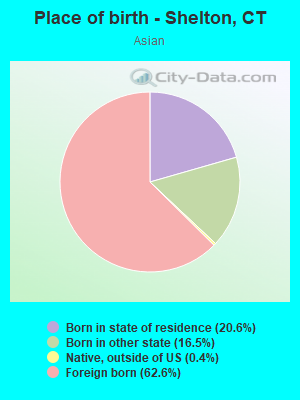
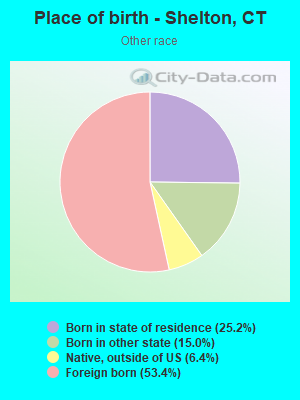
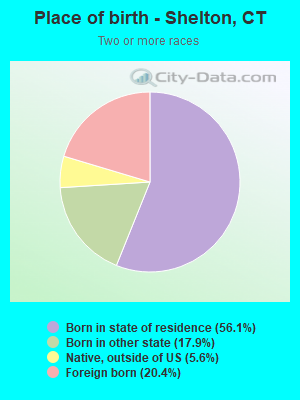
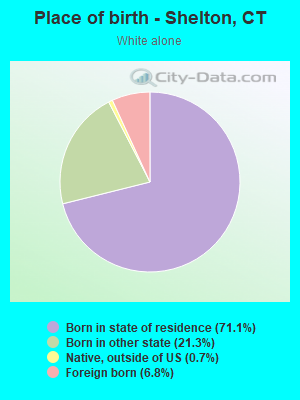
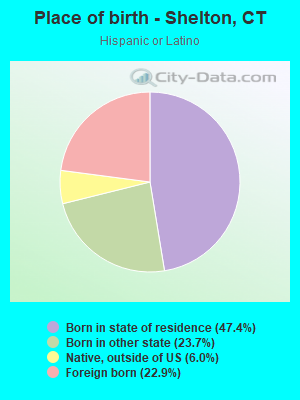
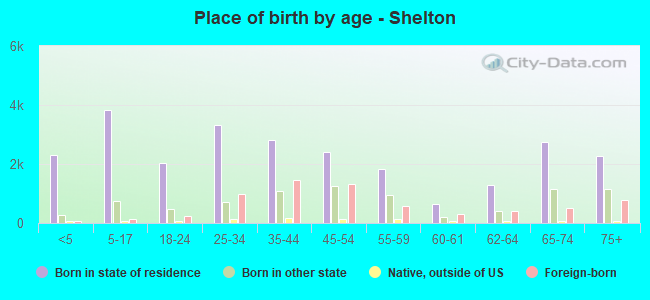
Place of birth - Born in state of residence (%)
Place of birth - Born in state of residence (%) - White
Place of birth - Born in state of residence (%) - Black or African American
Place of birth - Born in state of residence (%) - Asian
Place of birth - Born in state of residence (%) - Hispanic or Latino
Place of birth - Born in state of residence (%) - American Indian and Alaska Native
Place of birth - Born in state of residence (%) - Multirace
Place of birth - Born in state of residence (%) - Other Race
Place of birth - Born in other state (%)
Place of birth - Born in other state (%) - White
Place of birth - Born in other state (%) - Black or African American
Place of birth - Born in other state (%) - Asian
Place of birth - Born in other state (%) - Hispanic or Latino
Place of birth - Born in other state (%) - American Indian and Alaska Native
Place of birth - Born in other state (%) - Multirace
Place of birth - Born in other state (%) - Other Race
Place of birth - Native, outside of US (%)
Place of birth - Native, outside of US (%) - White
Place of birth - Native, outside of US (%) - Black or African American
Place of birth - Native, outside of US (%) - Asian
Place of birth - Native, outside of US (%) - Hispanic or Latino
Place of birth - Native, outside of US (%) - American Indian and Alaska Native
Place of birth - Native, outside of US (%) - Multirace
Place of birth - Native, outside of US (%) - Other Race
Place of birth - Foreign born (%)
Place of birth - Foreign born (%) - White
Place of birth - Foreign born (%) - Black or African American
Place of birth - Foreign born (%) - Asian
Place of birth - Foreign born (%) - Hispanic or Latino
Place of birth - Foreign born (%) - American Indian and Alaska Native
Place of birth - Foreign born (%) - Multirace
Place of birth - Foreign born (%) - Other Race
Residents speaking English at home (%)
Residents speaking English at home - Born in the United States (%)
Residents speaking English at home - Native, born elsewhere (%)
Residents speaking English at home - Foreign born (%)
Residents speaking Spanish at home (%)
Residents speaking Spanish at home - Born in the United States (%)
Residents speaking Spanish at home - Native, born elsewhere (%)
Residents speaking Spanish at home - Foreign born (%)
Residents speaking other language at home (%)
Residents speaking other language at home - Born in the United States (%)
Residents speaking other language at home - Native, born elsewhere (%)
Residents speaking other language at home - Foreign born (%)
Marital status - Never married (%)
Marital status - Now married (%)
Marital status - Separated (%)
Marital status - Widowed (%)
Marital status - Divorced (%)
Ancestries Reported - Arab (%)
Ancestries Reported - Czech (%)
Ancestries Reported - Danish (%)
Ancestries Reported - Dutch (%)
Ancestries Reported - English (%)
Ancestries Reported - French (%)
Ancestries Reported - French Canadian (%)
Ancestries Reported - German (%)
Ancestries Reported - Greek (%)
Ancestries Reported - Hungarian (%)
Ancestries Reported - Irish (%)
Ancestries Reported - Italian (%)
Ancestries Reported - Lithuanian (%)
Ancestries Reported - Norwegian (%)
Ancestries Reported - Polish (%)
Ancestries Reported - Portuguese (%)
Ancestries Reported - Russian (%)
Ancestries Reported - Scotch-Irish (%)
Ancestries Reported - Scottish (%)
Ancestries Reported - Slovak (%)
Ancestries Reported - Subsaharan African (%)
Ancestries Reported - Swedish (%)
Ancestries Reported - Swiss (%)
Ancestries Reported - Ukrainian (%)
Ancestries Reported - United States (%)
Ancestries Reported - Welsh (%)
Ancestries Reported - West Indian (%)
Ancestries Reported - Other (%)
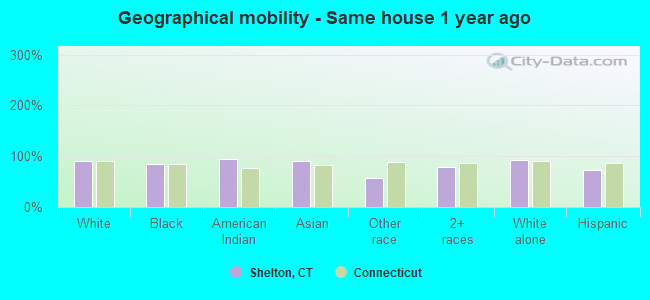
Geographical mobility - Same house 1 year ago (%)
Geographical mobility - Same house 1 year ago (%) - White
Geographical mobility - Same house 1 year ago (%) - Black or African American
Geographical mobility - Same house 1 year ago (%) - Asian
Geographical mobility - Same house 1 year ago (%) - Hispanic or Latino
Geographical mobility - Same house 1 year ago (%) - American Indian and Alaska Native
Geographical mobility - Same house 1 year ago (%) - Multirace
Geographical mobility - Same house 1 year ago (%) - Other Race
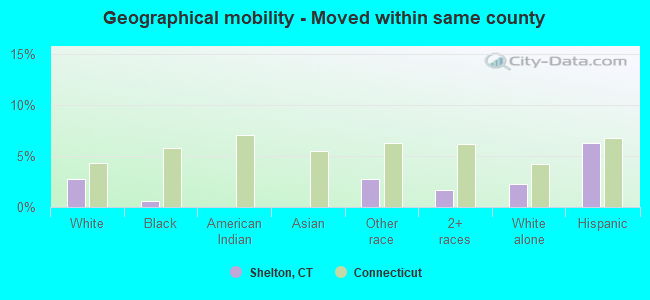
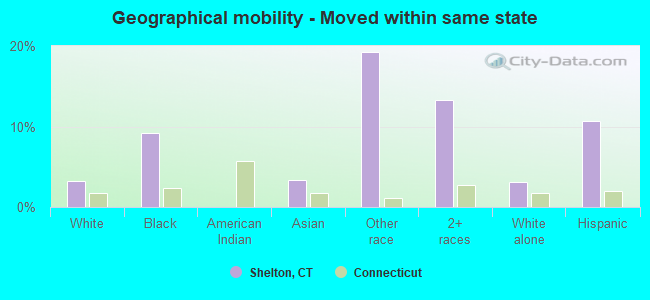
Geographical mobility - Moved within same county (%)
Geographical mobility - Moved within same county (%) - White
Geographical mobility - Moved within same county (%) - Black or African American
Geographical mobility - Moved within same county (%) - Asian
Geographical mobility - Moved within same county (%) - Hispanic or Latino
Geographical mobility - Moved within same county (%) - American Indian and Alaska Native
Geographical mobility - Moved within same county (%) - Multirace
Geographical mobility - Moved within same county (%) - Other Race
Geographical mobility - Moved from different county within same state (%)
Geographical mobility - Moved from different county within same state (%) - White
Geographical mobility - Moved from different county within same state (%) - Black or African American
Geographical mobility - Moved from different county within same state (%) - Asian
Geographical mobility - Moved from different county within same state (%) - Hispanic or Latino
Geographical mobility - Moved from different county within same state (%) - American Indian and Alaska Native
Geographical mobility - Moved from different county within same state (%) - Multirace
Geographical mobility - Moved from different county within same state (%) - Other Race
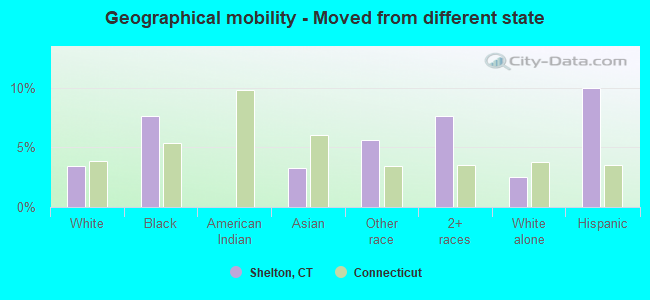
Geographical mobility - Moved from different state (%)
Geographical mobility - Moved from different state (%) - White
Geographical mobility - Moved from different state (%) - Black or African American
Geographical mobility - Moved from different state (%) - Asian
Geographical mobility - Moved from different state (%) - Hispanic or Latino
Geographical mobility - Moved from different state (%) - American Indian and Alaska Native
Geographical mobility - Moved from different state (%) - Multirace
Geographical mobility - Moved from different state (%) - Other Race
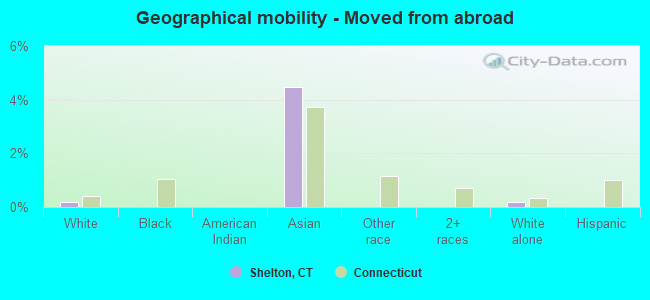
Geographical mobility - Moved from abroad (%)
Geographical mobility - Moved from abroad (%) - White
Geographical mobility - Moved from abroad (%) - Black or African American
Geographical mobility - Moved from abroad (%) - Asian
Geographical mobility - Moved from abroad (%) - Hispanic or Latino
Geographical mobility - Moved from abroad (%) - American Indian and Alaska Native
Geographical mobility - Moved from abroad (%) - Multirace
Geographical mobility - Moved from abroad (%) - Other Race
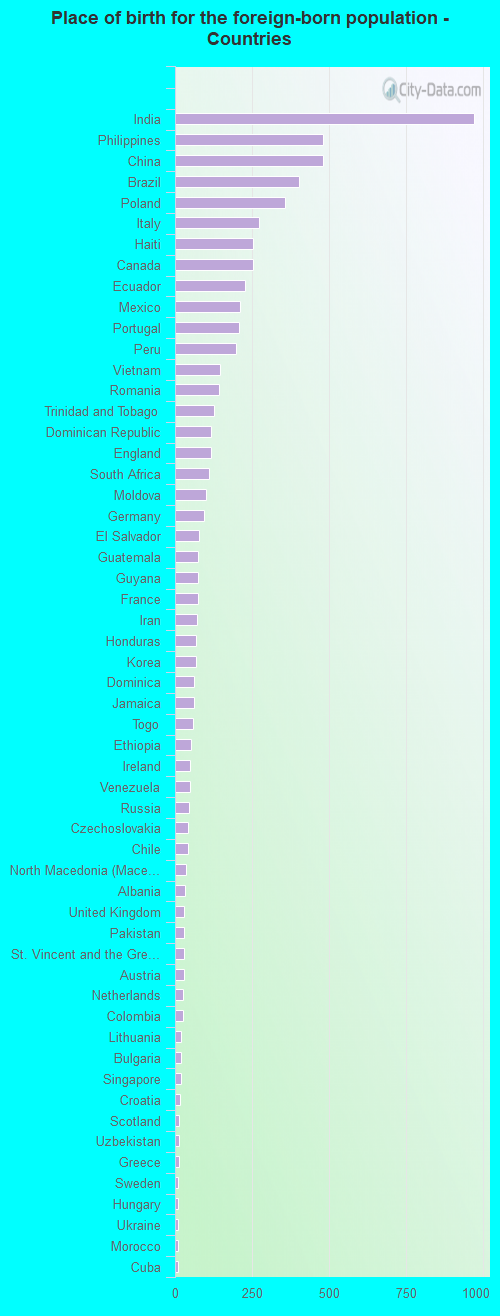
Place of birth for the foreign-born population - Ireland (%)
Place of birth for the foreign-born population - Denmark (%)
Place of birth for the foreign-born population - Norway (%)
Place of birth for the foreign-born population - Sweden (%)
Place of birth for the foreign-born population - United Kingdom (%)
Place of birth for the foreign-born population - England (%)
Place of birth for the foreign-born population - Scotland (%)
Place of birth for the foreign-born population - Other Northern Europe (%)
Place of birth for the foreign-born population - Austria (%)
Place of birth for the foreign-born population - Belgium (%)
Place of birth for the foreign-born population - France (%)
Place of birth for the foreign-born population - Germany (%)
Place of birth for the foreign-born population - Netherlands (%)
Place of birth for the foreign-born population - Switzerland (%)
Place of birth for the foreign-born population - Other Western Europe (%)
Place of birth for the foreign-born population - Greece (%)
Place of birth for the foreign-born population - Italy (%)
Place of birth for the foreign-born population - Portugal (%)
Place of birth for the foreign-born population - Spain (%)
Place of birth for the foreign-born population - Other Southern Europe (%)
Place of birth for the foreign-born population - Albania (%)
Place of birth for the foreign-born population - Belarus (%)
Place of birth for the foreign-born population - Bosnia and Herzegovina (%)
Place of birth for the foreign-born population - Bulgaria (%)
Place of birth for the foreign-born population - Croatia (%)
Place of birth for the foreign-born population - Czechoslovakia (%)
Place of birth for the foreign-born population - Hungary (%)
Place of birth for the foreign-born population - Latvia (%)
Place of birth for the foreign-born population - Lithuania (%)
Place of birth for the foreign-born population - North Macedonia (Macedonia) (%)
Place of birth for the foreign-born population - Moldova (%)
Place of birth for the foreign-born population - Poland (%)
Place of birth for the foreign-born population - Romania (%)
Place of birth for the foreign-born population - Russia (%)
Place of birth for the foreign-born population - Serbia (%)
Place of birth for the foreign-born population - Ukraine (%)
Place of birth for the foreign-born population - Other Eastern Europe (%)
Place of birth for the foreign-born population - China (%)
Place of birth for the foreign-born population - Hong Kong (%)
Place of birth for the foreign-born population - Taiwan (%)
Place of birth for the foreign-born population - Japan (%)
Place of birth for the foreign-born population - Korea (%)
Place of birth for the foreign-born population - Other Eastern Asia (%)
Place of birth for the foreign-born population - Afghanistan (%)
Place of birth for the foreign-born population - Bangladesh (%)
Place of birth for the foreign-born population - India (%)
Place of birth for the foreign-born population - Iran (%)
Place of birth for the foreign-born population - Kazakhstan (%)
Place of birth for the foreign-born population - Nepal (%)
Place of birth for the foreign-born population - Pakistan (%)
Place of birth for the foreign-born population - Sri Lanka (%)
Place of birth for the foreign-born population - Uzbekistan (%)
Place of birth for the foreign-born population - Other South Central Asia (%)
Place of birth for the foreign-born population - Burma (%)
Place of birth for the foreign-born population - Cambodia (%)
Place of birth for the foreign-born population - Indonesia (%)
Place of birth for the foreign-born population - Laos (%)
Place of birth for the foreign-born population - Malaysia (%)
Place of birth for the foreign-born population - Philippines (%)
Place of birth for the foreign-born population - Singapore (%)
Place of birth for the foreign-born population - Thailand (%)
Place of birth for the foreign-born population - Vietnam (%)
Place of birth for the foreign-born population - Other South Eastern Asia (%)
Place of birth for the foreign-born population - Armenia (%)
Place of birth for the foreign-born population - Iraq (%)
Place of birth for the foreign-born population - Israel (%)
Place of birth for the foreign-born population - Jordan (%)
Place of birth for the foreign-born population - Kuwait (%)
Place of birth for the foreign-born population - Lebanon (%)
Place of birth for the foreign-born population - Saudi Arabia (%)
Place of birth for the foreign-born population - Syria (%)
Place of birth for the foreign-born population - Turkey (%)
Place of birth for the foreign-born population - Yemen (%)
Place of birth for the foreign-born population - Other Western Asia (%)
Place of birth for the foreign-born population - Eritrea (%)
Place of birth for the foreign-born population - Ethiopia (%)
Place of birth for the foreign-born population - Kenya (%)
Place of birth for the foreign-born population - Somalia (%)
Place of birth for the foreign-born population - Uganda (%)
Place of birth for the foreign-born population - Zimbabwe (%)
Place of birth for the foreign-born population - Other Eastern Africa (%)
Place of birth for the foreign-born population - Cameroon (%)
Place of birth for the foreign-born population - Congo (%)
Place of birth for the foreign-born population - Democratic Republic of Congo (Zaire) (%)
Place of birth for the foreign-born population - Other Middle Africa (%)
Place of birth for the foreign-born population - Egypt (%)
Place of birth for the foreign-born population - Morocco (%)
Place of birth for the foreign-born population - Sudan (%)
Place of birth for the foreign-born population - Other Northern Africa (%)
Place of birth for the foreign-born population - South Africa (%)
Place of birth for the foreign-born population - Other Southern Africa (%)
Place of birth for the foreign-born population - Cabo Verde (%)
Place of birth for the foreign-born population - Ghana (%)
Place of birth for the foreign-born population - Liberia (%)
Place of birth for the foreign-born population - Nigeria (%)
Place of birth for the foreign-born population - Senegal (%)
Place of birth for the foreign-born population - Sierra Leone (%)
Place of birth for the foreign-born population - Other Western Africa (%)
Place of birth for the foreign-born population - Australia (%)
Place of birth for the foreign-born population - New Zealand (%)
Place of birth for the foreign-born population - Fiji (%)
Place of birth for the foreign-born population - Micronesia (%)
Place of birth for the foreign-born population - Bahamas (%)
Place of birth for the foreign-born population - Barbados (%)
Place of birth for the foreign-born population - Cuba (%)
Place of birth for the foreign-born population - Dominica (%)
Place of birth for the foreign-born population - Dominican Republic (%)
Place of birth for the foreign-born population - Grenada (%)
Place of birth for the foreign-born population - Haiti (%)
Place of birth for the foreign-born population - Jamaica (%)
Place of birth for the foreign-born population - St. Vincent and the Grenadines (%)
Place of birth for the foreign-born population - Trinidad and Tobago (%)
Place of birth for the foreign-born population - West Indies (%)
Place of birth for the foreign-born population - Other Caribbean (%)
Place of birth for the foreign-born population - Belize (%)
Place of birth for the foreign-born population - Costa Rica (%)
Place of birth for the foreign-born population - El Salvador (%)
Place of birth for the foreign-born population - Guatemala (%)
Place of birth for the foreign-born population - Honduras (%)
Place of birth for the foreign-born population - Mexico (%)
Place of birth for the foreign-born population - Nicaragua (%)
Place of birth for the foreign-born population - Panama (%)
Place of birth for the foreign-born population - Other Central America (%)
Place of birth for the foreign-born population - Argentina (%)
Place of birth for the foreign-born population - Bolivia (%)
Place of birth for the foreign-born population - Brazil (%)
Place of birth for the foreign-born population - Chile (%)
Place of birth for the foreign-born population - Colombia (%)
Place of birth for the foreign-born population - Ecuador (%)
Place of birth for the foreign-born population - Guyana (%)
Place of birth for the foreign-born population - Peru (%)
Place of birth for the foreign-born population - Uruguay (%)
Place of birth for the foreign-born population - Venezuela (%)
Place of birth for the foreign-born population - Other South America (%)
Place of birth for the foreign-born population - Canada (%)
Place of birth for the foreign-born population - Other Northern America (%)
Place of birth for the foreign-born population - Other (%)
Latest news about races in Shelton, CT collected exclusively by city-data.com from local newspapers, TV, and radio stations
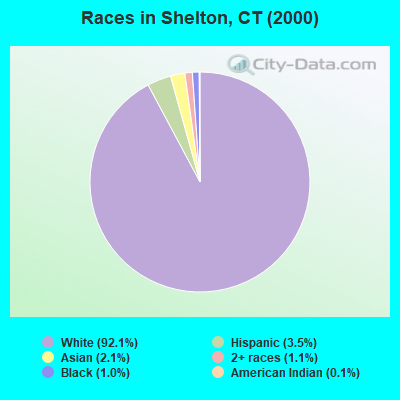
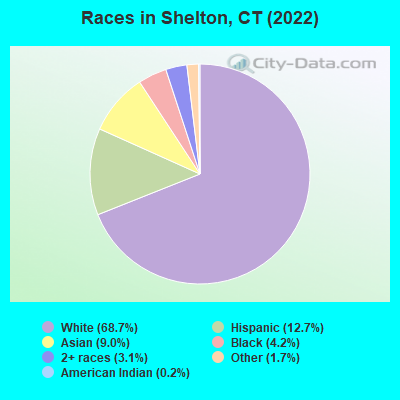
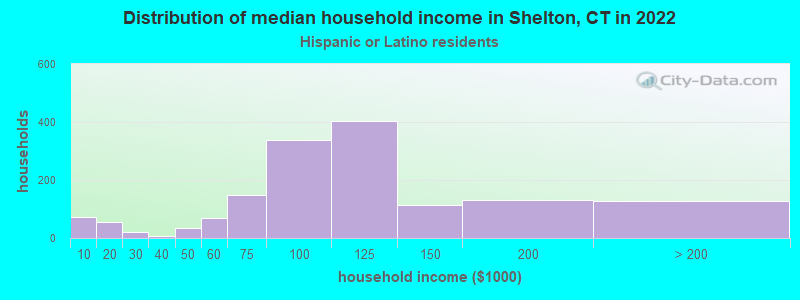
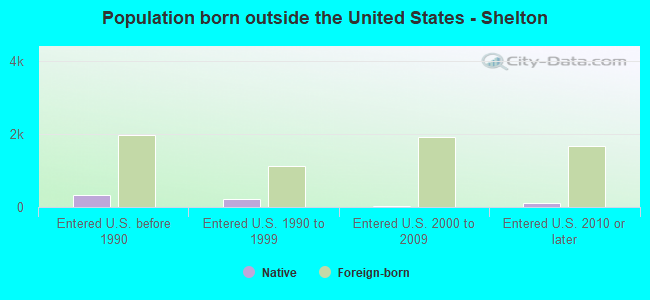
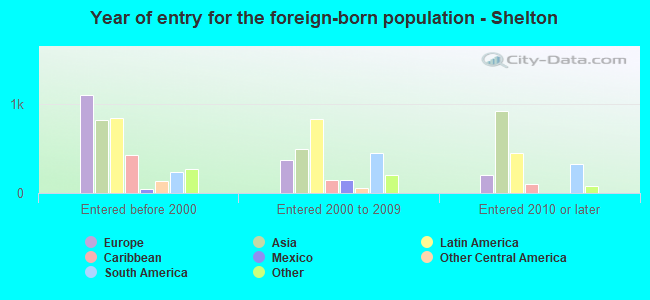
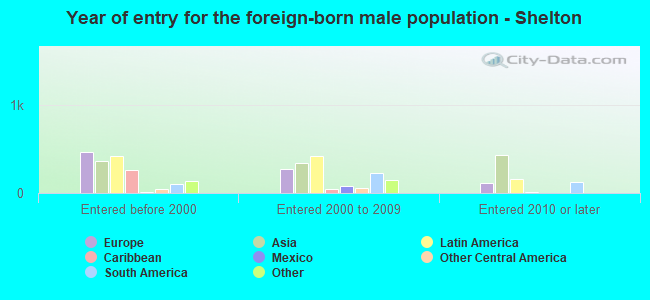
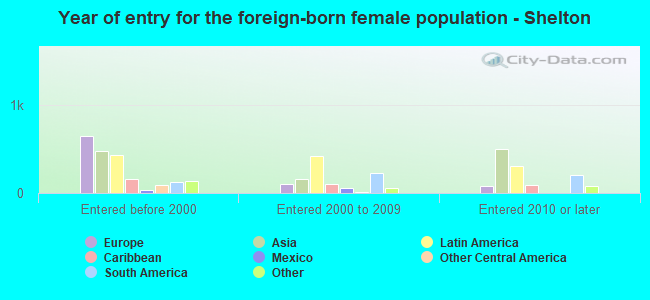
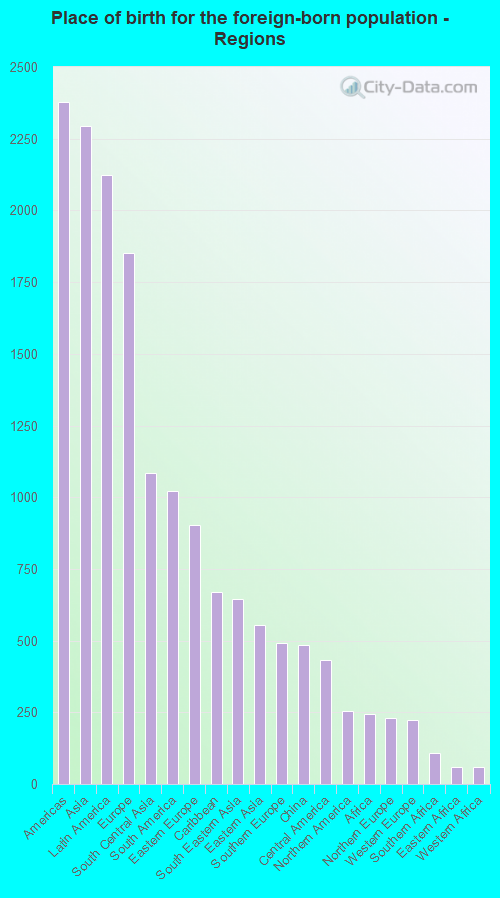
According to 2022 data, the most numerous races in Shelton, CT are White alone (28,432 residents), Hispanic (5,242 residents), and Black alone (1,734 residents). 77.6% of Shelton residents speak English at home. 16.4% of Shelton, CT residents are foreign-born (5.3% born in Asia, 4.9% born in Latin America, 4.3% born in Europe), which is 8.3% greater than the foreign-born rate of 15.0% across the entire state of Connecticut.
Race distribution in Shelton
2000 2022
2,638,845 77.5% White alone 320,323 9.4% Hispanic 295,571 8.7% Black alone 81,564 2.4% Asian alone 52,896 1.6% Two or more races 8,141 0.2% Other race alone 7,267 0.2% American Indian alone 958 0.03% Native Hawaiian and Other
2,246,913 62.0% White alone 658,978 18.2% Hispanic 353,973 9.8% Black alone 172,929 4.8% Asian alone 159,631 4.4% Two or more races 29,761 0.8% Other race alone 3,428 0.09% American Indian alone 592 0.02% Native Hawaiian and Other
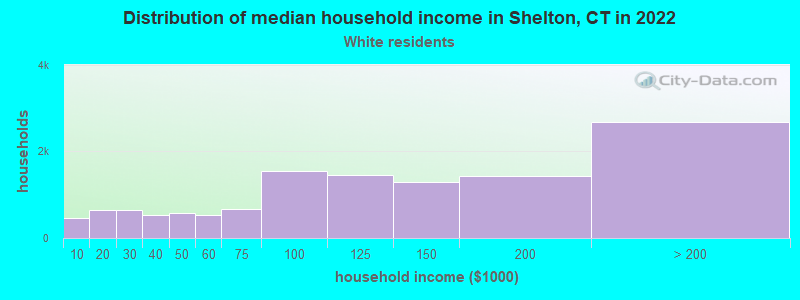
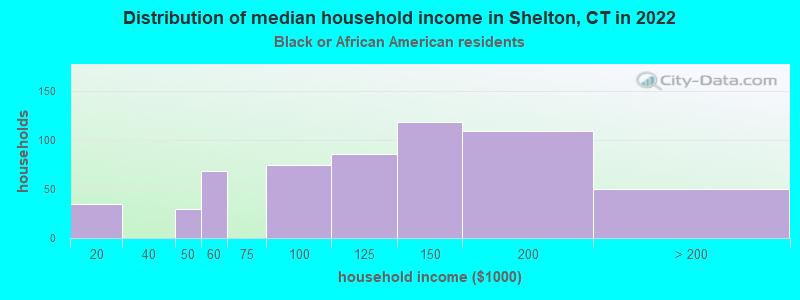
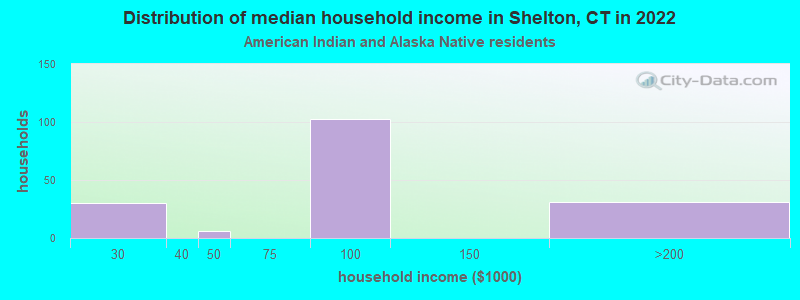
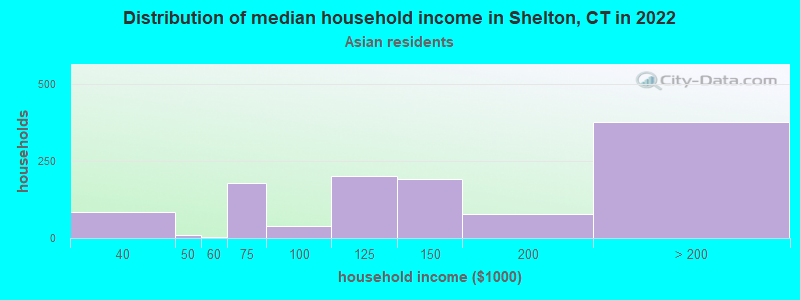
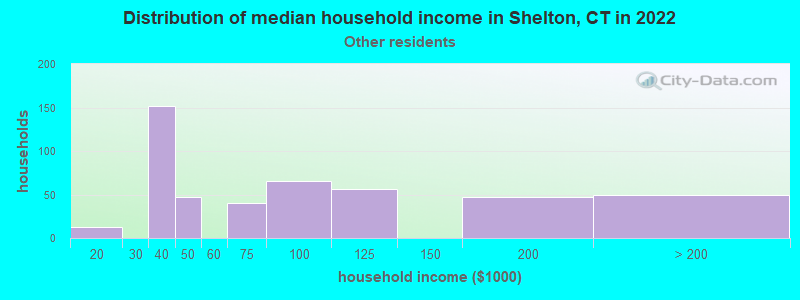
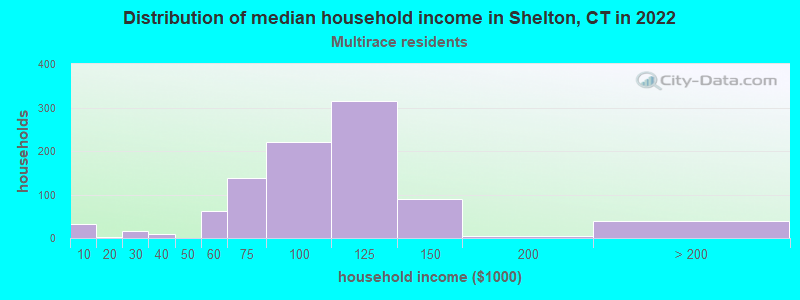
Income and house value in Shelton Median household income in 2022 $110,852 White non-Hispanic householders$115,946 Black householders$84,953 American Indian and Alaska Native householders$135,674 Asian householders$103,254 Two or more races householders$114,193 Hispanic or Latino race householdersMedian 2022 house value $457,246 White Non-Hispanic householders$536,822 Black or African American householders$394,722 American Indian or Alaska Native householders $413,879 Asian householders$513,244 Some other race householders$473,666 Two or more races householders$461,667 Hispanic or Latino householders
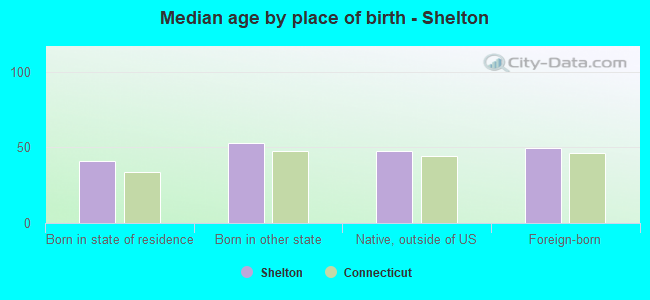
Median age by race in Shelton
51.2 Median age for White residents49.7 52.9 41.8 Median age for Black or African American residents33.3 44.3 59.7 Median age for American Indian / Alaska Native residents57.0 -704,477,611.2 36.5 Median age for Asian residents36.3 34.4 -641,269,840.6 Median age for Native Hawaiian / Pacific Islander residents-414,239,481.8 -691,588,784.4 34.6 Median age for Other race residents35.3 31.4 23.6 Median age for Two or more races residents21.2 25.0 51.3 Median age for White alone residents49.7 53.0 33.2 Median age for Hispanic or Latino residents30.7 35.1
Owner/renter occupied households by race in Shelton
House owners and renters - White residents 10,215 81.6% Owner occupied2,304 18.4% Renter occupiedHouse owners and renters - Black or African American residents 236 42.2% Owner occupied323 57.8% Renter occupiedHouse owners and renters - American Indian / Alaska Native residents 166 100.0% Owner occupiedHouse owners and renters - Asian residents 955 82.6% Owner occupied201 17.4% Renter occupiedHouse owners and renters - Other race residents 359 69.6% Owner occupied156 30.4% Renter occupiedHouse owners and renters - Two or more races residents 499 55.1% Owner occupied407 44.9% Renter occupiedHouse owners and renters - White alone residents 10,045 82.0% Owner occupied2,206 18.0% Renter occupiedHouse owners and renters - Hispanic or Latino residents 897 58.7% Owner occupied631 41.3% Renter occupied
Language usage in Shelton
English speakers - Total 77.6% of residents of Shelton speak English at home.
7.2% of residents speak Spanish at home 2,025 72.8% Speak English very well756 27.2% Speak English less than very well15.0% of residents speak other language at home 3,623 62.3% Speak English very well2,188 37.7% Speak English less than very well
English speakers - Born in the United States 82.9% of residents of Shelton speak English at home.
8.8% of residents speak Spanish at home 518 71.8% Speak English very well203 28.2% Speak English less than very well8.8% of residents speak other language at home 677 94.7% Speak English very well38 5.3% Speak English less than very well
English speakers - Native, born elsewhere 61.4% of residents of Shelton speak English at home.
41.5% of residents speak Spanish at home 243 87.7% Speak English very well34 12.3% Speak English less than very well1.6% of residents speak other language at home 11 100.0% Speak English very well
English speakers - Foreign-born 19.1% of residents of Shelton speak English at home.
15.6% of residents speak Spanish at home 650 61.8% Speak English very well402 38.2% Speak English less than very well64.3% of residents speak other language at home 2,458 56.5% Speak English very well1,892 43.5% Speak English less than very well
White (Caucasian) - Speak only English Native:
96.1% (25,199)Foreign-born:
31.3% (581)
White (Caucasian) - Speak another language Native:
4.3% (1,136)Foreign-born:
68.7% (1,274)
Black or African American - Speak only English Native:
83.3% (1,078)Foreign-born:
24.1% (135)
Black or African American - Speak another language Native:
17.7% (229)Foreign-born:
65.5% (367)
American Indian / Alaska Native - Speak another language Native:
41.2% (25)Foreign-born:
92.6% (208)
Asian - Speak only English Native:
51.9% (514)Foreign-born:
13.1% (303)
Asian - Speak another language Native:
48.0% (476)Foreign-born:
87.0% (2,010)
Other race - Speak only English Native:
54.1% (347)Foreign-born:
6.3% (59)
Other race - Speak another language Native:
48.4% (310)Foreign-born:
93.8% (883)
Two or more races - Speak only English Native:
60.6% (1,346)Foreign-born:
15.5% (122)
Two or more races - Speak another language Native:
39.8% (885)Foreign-born:
80.7% (638)
White alone - Speak only English Native:
96.4% (24,534)Foreign-born:
30.4% (591)
White alone - Speak another language Native:
3.6% (913)Foreign-born:
69.6% (1,353)
Hispanic or Latino - Speak only English Native:
54.3% (1,779)Foreign-born:
11.4% (137)
Hispanic or Latino - Speak another language Native:
46.6% (1,527)Foreign-born:
87.5% (1,054)
Foreign-born residents in Shelton 6,769 residents are foreign born (5.3% Asia , 4.9% Latin America , 4.3% Europe ).
This city:
16.4%Connecticut:
15.0%
Marital status for residents in Shelton Marital status - White (Caucasian) population 15 years and over
Males 31.0% Never married55.9% Now married0.6% Separated3.1% Widowed9.4% DivorcedFemales 22.3% Never married52.3% Now married1.4% Separated11.7% Widowed12.4% DivorcedWomen who gave birth in the past 12 months Now married:
85.6% (329)Unmarried:
14.4% (55)
Women who did not give birth in the past 12 months Now married:
43.9% (2,162)Unmarried:
56.1% (2,762)
Marital status - Black or African American population 15 years and over
Males 40.4% Never married45.2% Now married0.0% Separated0.0% Widowed14.4% DivorcedFemales 28.6% Never married33.4% Now married3.1% Separated2.4% Widowed32.5% DivorcedWomen who gave birth in the past 12 months Now married:
100.0% (3)Unmarried:
0.0% (0)
Women who did not give birth in the past 12 months Now married:
30.3% (236)Unmarried:
69.7% (543)
Marital status - American Indian / Alaska Native population 15 years and over
Males 0.0% Never married91.5% Now married0.0% Separated0.0% Widowed8.5% DivorcedFemales 0.0% Never married100.0% Now married0.0% Separated0.0% Widowed0.0% DivorcedWomen who did not give birth in the past 12 months Now married:
100.0% (19)Unmarried:
0.0% (0)
Marital status - Asian population 15 years and over
Males 23.0% Never married73.9% Now married0.0% Separated1.4% Widowed1.8% DivorcedFemales 24.8% Never married64.1% Now married0.0% Separated8.4% Widowed2.7% DivorcedWomen who gave birth in the past 12 months Now married:
100.0% (210)Unmarried:
0.0% (0)
Women who did not give birth in the past 12 months Now married:
51.6% (398)Unmarried:
48.4% (374)
Marital status - Other race population 15 years and over
Males 28.3% Never married69.5% Now married0.0% Separated0.0% Widowed2.2% DivorcedFemales 12.0% Never married82.6% Now married0.0% Separated2.1% Widowed3.4% DivorcedWomen who gave birth in the past 12 months Now married:
100.0% (135)Unmarried:
0.0% (0)
Women who did not give birth in the past 12 months Now married:
77.3% (359)Unmarried:
22.7% (105)
Marital status - Two or more races population 15 years and over
Males 47.9% Never married46.0% Now married0.0% Separated0.0% Widowed6.1% DivorcedFemales 54.5% Never married38.7% Now married1.0% Separated0.0% Widowed5.9% DivorcedWomen who gave birth in the past 12 months Now married:
100.0% (52)Unmarried:
0.0% (0)
Women who did not give birth in the past 12 months Now married:
22.6% (188)Unmarried:
77.4% (645)
Marital status - White alone, not Hispanic / Latino population 15 years and over
Males 30.7% Never married57.2% Now married0.6% Separated3.2% Widowed8.3% DivorcedFemales 21.0% Never married53.2% Now married1.4% Separated11.5% Widowed12.8% DivorcedWomen who gave birth in the past 12 months Now married:
85.6% (346)Unmarried:
14.4% (58)
Women who did not give birth in the past 12 months Now married:
44.8% (2,082)Unmarried:
55.2% (2,566)
Marital status - Hispanic or Latino population 15 years and over
Males 37.5% Never married49.2% Now married0.0% Separated0.0% Widowed13.3% DivorcedFemales 36.5% Never married50.3% Now married0.4% Separated7.8% Widowed5.0% DivorcedWomen who gave birth in the past 12 months Now married:
100.0% (127)Unmarried:
0.0% (0)
Women who did not give birth in the past 12 months Now married:
38.2% (429)Unmarried:
61.8% (693)
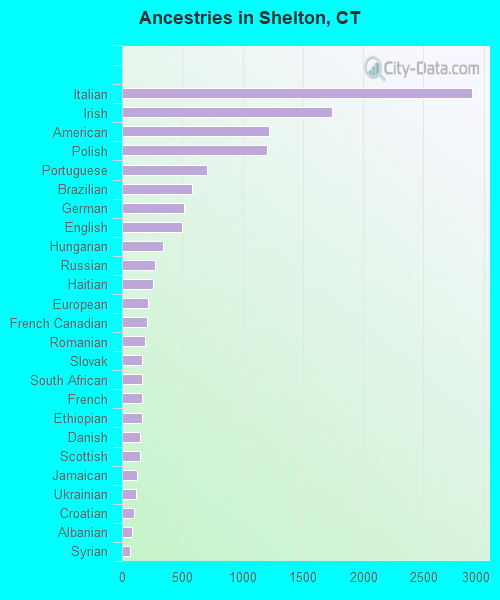
Ancestries in Shelton
2,900 15.1% Italian1,743 9.1% Irish1,223 6.4% American1,203 6.3% Polish702 3.7% Portuguese583 3.0% Brazilian511 2.7% German501 2.6% English338 1.8% Hungarian274 1.4% Russian261 1.4% Haitian217 1.1% European206 1.1% French Canadian191 1.0% Romanian169 0.9% Slovak165 0.9% South African164 0.9% French163 0.9% Ethiopian149 0.8% Danish148 0.8% Scottish124 0.6% Jamaican117 0.6% Ukrainian99 0.5% Croatian85 0.4% Albanian67 0.3% Syrian56 0.3% Guyanese55 0.3% Lithuanian52 0.3% Canadian48 0.3% Dutch48 0.3% Austrian46 0.2% Eastern European46 0.2% Bulgarian43 0.2% Swedish43 0.2% Scotch-Irish40 0.2% Greek39 0.2% Iranian38 0.2% Czech30 0.2% Egyptian28 0.1% Slavic25 0.1% British22 0.1% Czechoslovakian15 0.08% Norwegian8 0.04% Northern European7 0.04% Israeli5 0.03% Barbadian
Geographical mobility in Shelton Same house 1 year ago 26,165 90.5% White (Caucasian)1,617 84.7% Black or African American237 94.8% American Indian / Alaska Native3,120 90.0% Asian1,018 57.9% Other race2,801 79.3% Two or more races25,889 91.9% White alone, not Hispanic / Latino3,637 73.3% Hispanic or LatinoMoved within same county 794 2.7% White / Caucasian12 0.6% Black or African American48 2.7% Other race61 1.7% Two or more races625 2.2% White alone, not Hispanic / Latino313 6.3% Hispanic or LatinoMoved within same state 938 3.2% White / Caucasian175 9.1% Black or African American114 3.3% Asian338 19.2% Other race471 13.3% Two or more races863 3.1% White alone, not Hispanic / Latino527 10.6% Hispanic or LatinoMoved from different state 985 3.4% White / Caucasian146 7.7% Black or African American112 3.2% Asian99 5.6% Other race268 7.6% Two or more races707 2.5% White alone, not Hispanic / Latino494 10.0% Hispanic or LatinoMoved from abroad 51 0.2% White155 4.5% Asian55 0.2% White alone, not Hispanic / Latino
Children Nativity (place of birth) in Shelton
Children under 6 years - Living with two parents Both parents native 1,517 100.0% NativeBoth parents foreign-born 654 100.0% NativeOne native, one foreign-born parent 288 100.0% NativeChildren under 6 years - Living with one parent Native parent 436 100.0% NativeForeign-born parent 33 100.0% NativeChildren 6 to 17 years - Living with two parents Both parents native 2,175 99.9% Native1 0.1% Foreign-bornBoth parents foreign-born 496 81.5% Native112 18.5% Foreign-bornOne native, one foreign-born parent 367 100.0% NativeChildren 6 to 17 years - Living with one parent Native parent 982 100.0% NativeForeign-born parent 145 50.8% Native141 49.2% Foreign-born
Grandparents responsible for own grandchildren in Shelton
Grandparents (30 to 59 years) White / Caucasian 46 37.9% Responsible for grandchildren75 62.1% Not responsible for grandchildrenBlack or African American 34 100.0% Not responsible for grandchildrenAsian 45 100.0% Not responsible for grandchildrenTwo or more races 107 65.5% Responsible for grandchildren57 34.5% Not responsible for grandchildrenWhite alone, not Hispanic / Latino 52 34.1% Responsible for grandchildren100 65.9% Not responsible for grandchildrenHispanic or Latino 53 55.2% Responsible for grandchildren43 44.8% Not responsible for grandchildrenGrandparents (60 years and over) White / Caucasian 43 13.3% Responsible for grandchildren282 86.7% Not responsible for grandchildrenAsian 113 100.0% Not responsible for grandchildrenTwo or more races 29 100.0% Not responsible for grandchildrenWhite alone, not Hispanic / Latino 46 13.3% Responsible for grandchildren297 86.7% Not responsible for grandchildren