Races in Silver Lake, Wisconsin (WI) Detailed Stats
Ancestries, Foreign-born residents, place of birth

Recent posts about races in Silver Lake, Wisconsin on our local forum with over 2,400,000 registered users:
 | Where do we NOT want to live in the Kenosha area? (4 replies) |
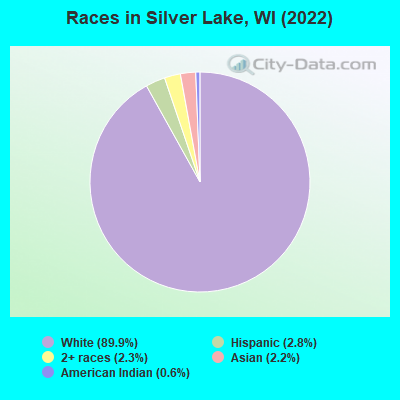
According to 2022 data, the most numerous races in Silver Lake, WI are White alone (2,388 residents), Hispanic (74 residents), and Black alone (0 residents). 93.4% of Silver Lake residents speak English at home. 2.8% of Silver Lake, WI residents are foreign-born (1.6% born in Asia, 0.9% born in Europe), which is 77.6% less than the foreign-born rate of 5.0% across the entire state of Wisconsin.
Race distribution in Silver Lake
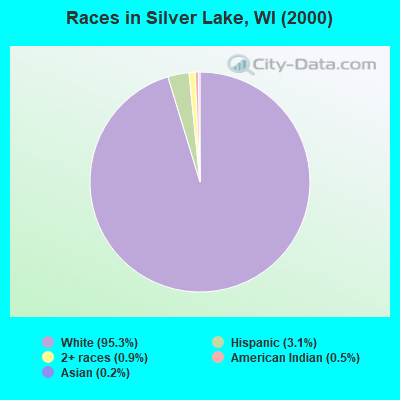
2000
2022

- 4,681,63087.3%White alone
- 300,2455.6%Black alone
- 192,9213.6%Hispanic
- 87,9951.6%Asian alone
- 51,9211.0%Two or more races
- 43,9800.8%American Indian alone
- 3,6370.07%Other race alone
- 1,3460.03%Native Hawaiian and Other
Pacific Islander alone

-
- 4,654,03179.0%White alone
- 447,0227.6%Hispanic
- 345,6785.9%Black alone
- 217,5323.7%Two or more races
- 172,2422.9%Asian alone
- 33,7620.6%American Indian alone
- 19,6800.3%Other race alone
- 2,5920.04%Native Hawaiian and Other
Pacific Islander alone

Income and house value in Silver Lake
- Median household income in 2022
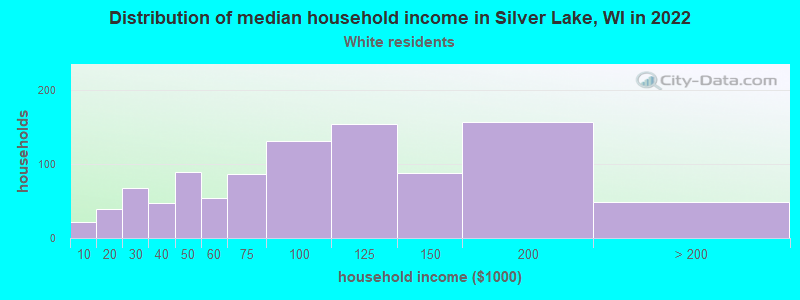
- $84,668White non-Hispanic householders
- $19,914American Indian and Alaska Native householders
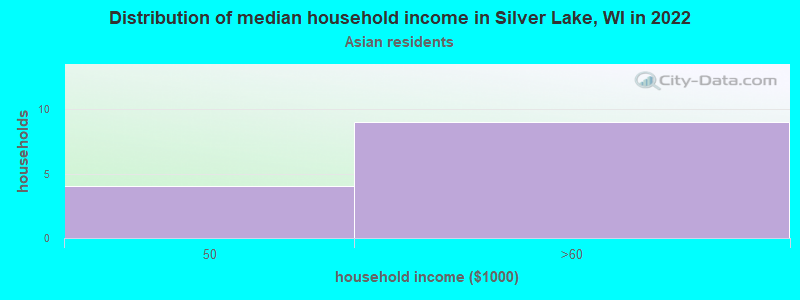
- over $200,000Asian householders
- $52,673Some other race householders
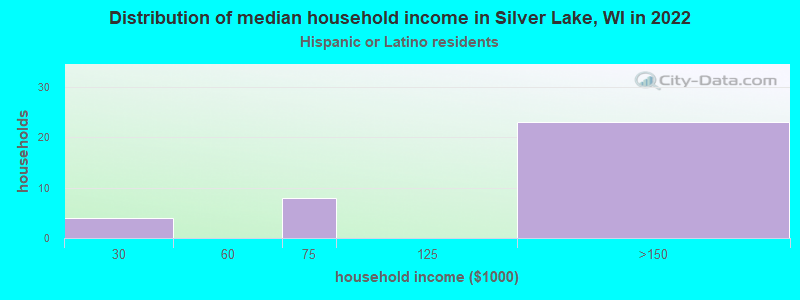
- $24,685Hispanic or Latino race householders
- Median 2022 house value
- $251,486White Non-Hispanic householders
- $749,746Asian householders
- $240,989Some other race householders
- $240,989Hispanic or Latino householders
Household income for White non-Hispanic householders
Household income for Asian householders
Household income for Hispanic or Latino race householders
Median age by race in Silver Lake
- 36.8Median age for White residents
- 41.3Males
- 35.2Females
- 34.6Median age for Asian residents
- 49.7Males
- 33.9Females
- 22.8Median age for Other race residents
- 11.4Median age for Two or more races residents
- 36.3Median age for White alone residents
- 40.5Males
- 35.5Females
- 22.4Median age for Hispanic or Latino residents
- 23.4Males
- 56.3Females
Owner/renter occupied households by race in Silver Lake
- House owners and renters - White residents
- 70776.6%Owner occupied
- 21623.4%Renter occupied
- House owners and renters - Asian residents
- 955.2%Owner occupied
- 844.8%Renter occupied
- House owners and renters - White alone residents
- 70076.4%Owner occupied
- 21723.6%Renter occupied
- House owners and renters - Hispanic or Latino residents
- 2073.2%Owner occupied
- 726.8%Renter occupied
Language usage in Silver Lake
- English speakers - Total
- 93.4% of residents of Silver Lake speak English at home.
- 0.7% of residents speak Spanish at home
- 1694.1%Speak English very well
- 15.9%Speak English less than very well
- 6.5% of residents speak other language at home
- 9257.5%Speak English very well
- 6842.5%Speak English less than very well
- English speakers - Born in the United States
- 97.1% of residents of Silver Lake speak English at home.
- 1.1% of residents speak Spanish at home
- 15100.0%Speak English very well
- 2.8% of residents speak other language at home
- 38100.0%Speak English very well
All residents speak only English at home
- English speakers - Foreign-born
- 12.4% of residents of Silver Lake speak English at home.
- 1.0% of residents speak Spanish at home
- 1100.0%Speak English less than very well
- 87.6% of residents speak other language at home
- 1416.5%Speak English very well
- 7183.5%Speak English less than very well
White (Caucasian) - Speak only English
| Native: | 99.0% (2,163) |
| Foreign-born: | 33.1% (9) |
White (Caucasian) - Speak another language
| Native: | 1.9% (41) |
| Foreign-born: | 62.4% (18) |
White alone - Speak only English
| Native: | 97.7% (2,152) |
| Foreign-born: | 37.2% (11) |
White alone - Speak another language
| Native: | 2.2% (49) |
| Foreign-born: | 62.3% (18) |
Hispanic or Latino - Speak another language
| Native: | 14.6% (11) |
| Foreign-born: | 98.4% (1) |
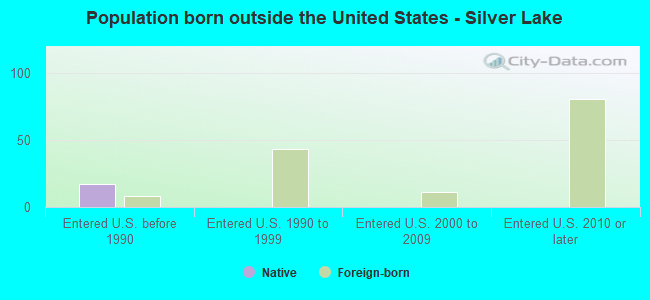
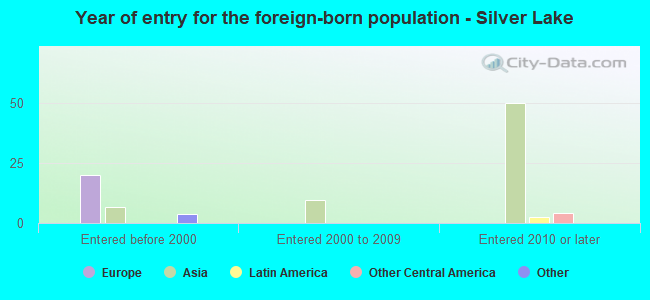
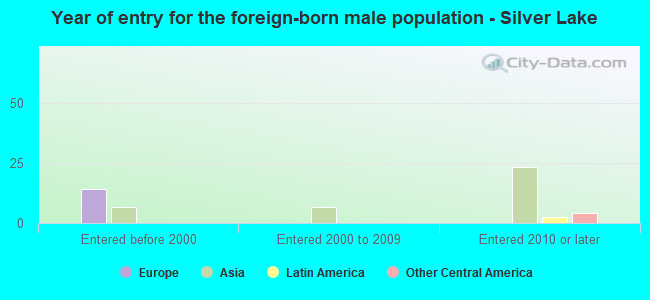
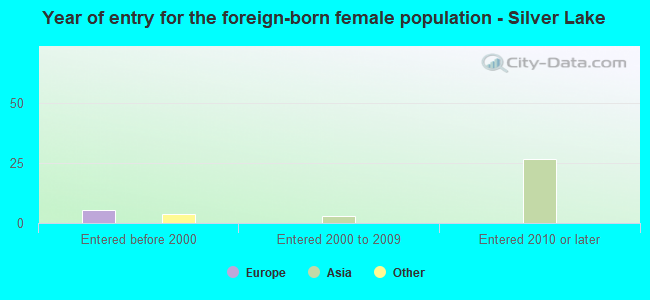
Foreign-born residents in Silver Lake
74 residents are foreign born (1.6% Asia, 0.9% Europe).
| This city: | 2.8% |
| Wisconsin: | 100.0% |

Marital status for residents in Silver Lake
Marital status - White (Caucasian) population 15 years and over
- Males
- 32.9%Never married
- 47.5%Now married
- 0.0%Separated
- 3.0%Widowed
- 16.6%Divorced
- Females
- 28.7%Never married
- 54.1%Now married
- 0.7%Separated
- 4.3%Widowed
- 12.3%Divorced
Women who gave birth in the past 12 months
| Now married: | 72.2% (12) |
| Unmarried: | 27.8% (5) |
Women who did not give birth in the past 12 months
| Now married: | 49.0% (238) |
| Unmarried: | 51.0% (247) |
Marital status - American Indian / Alaska Native population 15 years and over
- Males
- 0.0%Never married
- 0.0%Now married
- 0.0%Separated
- 0.0%Widowed
- 100.0%Divorced
- Females
- 0.0%Never married
- 100.0%Now married
- 0.0%Separated
- 0.0%Widowed
- 0.0%Divorced
Women who did not give birth in the past 12 months
| Now married: | 100.0% (11) |
| Unmarried: | 0.0% (0) |
Marital status - Asian population 15 years and over
- Males
- 0.0%Never married
- 71.4%Now married
- 28.6%Separated
- 0.0%Widowed
- 0.0%Divorced
- Females
- 0.0%Never married
- 45.8%Now married
- 0.0%Separated
- 0.0%Widowed
- 54.2%Divorced
Women who did not give birth in the past 12 months
| Now married: | 23.5% (5) |
| Unmarried: | 76.5% (15) |
Marital status - White alone, not Hispanic / Latino population 15 years and over
- Males
- 32.1%Never married
- 47.5%Now married
- 0.0%Separated
- 3.1%Widowed
- 17.2%Divorced
- Females
- 29.1%Never married
- 54.8%Now married
- 0.7%Separated
- 4.4%Widowed
- 11.1%Divorced
Women who gave birth in the past 12 months
| Now married: | 72.2% (12) |
| Unmarried: | 27.8% (5) |
Women who did not give birth in the past 12 months
| Now married: | 49.0% (242) |
| Unmarried: | 51.0% (251) |
Marital status - Hispanic or Latino population 15 years and over
- Males
- 54.1%Never married
- 45.9%Now married
- 0.0%Separated
- 0.0%Widowed
- 0.0%Divorced
- Females
- 0.0%Never married
- 0.0%Now married
- 0.0%Separated
- 0.0%Widowed
- 100.0%Divorced
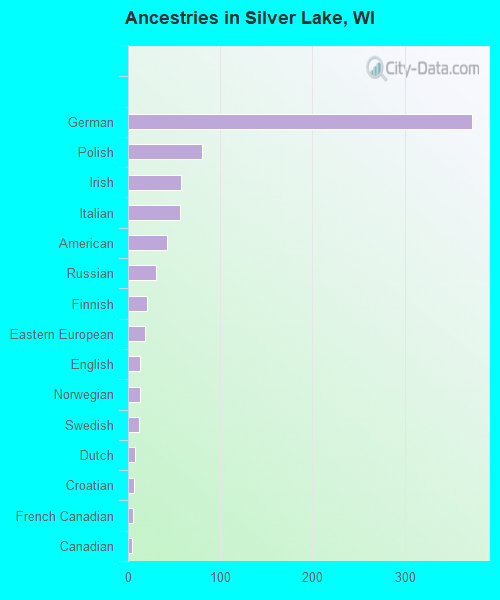
Ancestries in Silver Lake

- 37337.6%German
- 808.1%Polish
- 575.7%Irish
- 565.6%Italian
- 424.2%American
- 303.0%Russian
- 212.1%Finnish
- 181.8%Eastern European
- 131.3%English
- 131.3%Norwegian
- 121.2%Swedish
- 80.8%Dutch
- 60.6%Croatian
- 50.5%French Canadian
- 40.4%Canadian
- 30.3%French
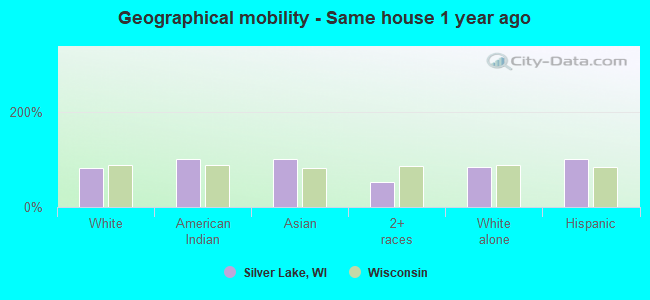
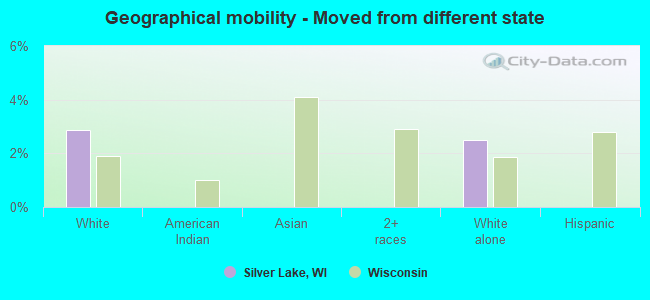
Geographical mobility in Silver Lake

- Same house 1 year ago
- 1,95382.1%White (Caucasian)
- 20100.0%American Indian / Alaska Native
- 60100.0%Asian
- 5052.7%Two or more races
- 1,96082.7%White alone, not Hispanic / Latino
- 75100.0%Hispanic or Latino
-
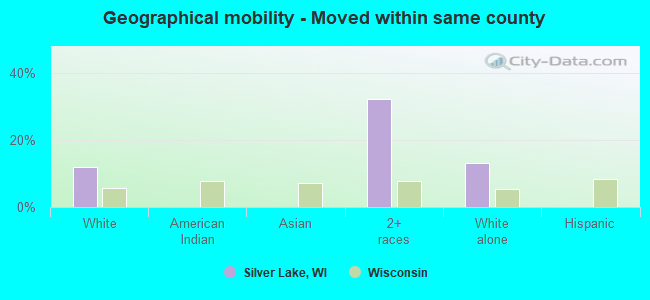
- Moved within same county
- 28712.1%White / Caucasian
- 3132.3%Two or more races
- 30713.0%White alone, not Hispanic / Latino
-
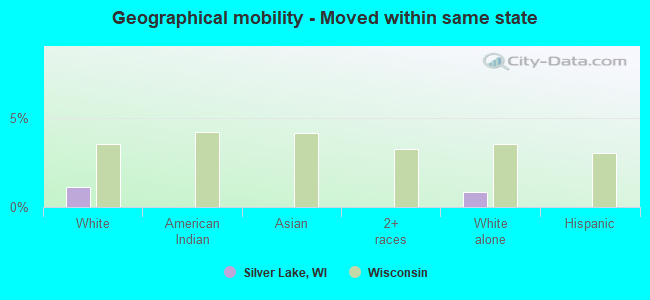
- Moved within same state
- 261.1%White / Caucasian
- 200.8%White alone, not Hispanic / Latino
-
- Moved from different state
- 692.9%White / Caucasian
- 592.5%White alone, not Hispanic / Latino
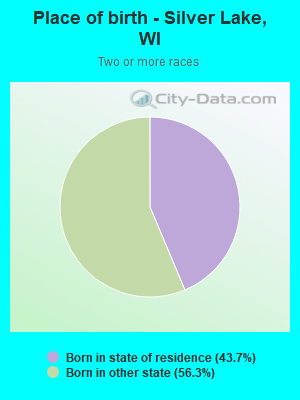
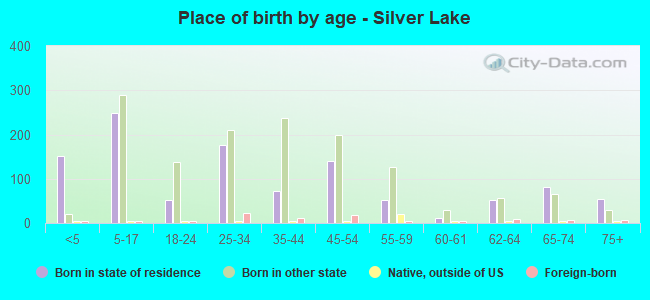
Children Nativity (place of birth) in Silver Lake
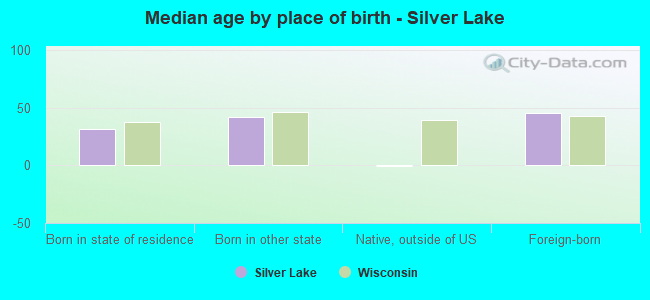
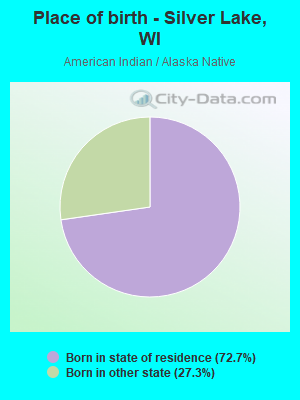
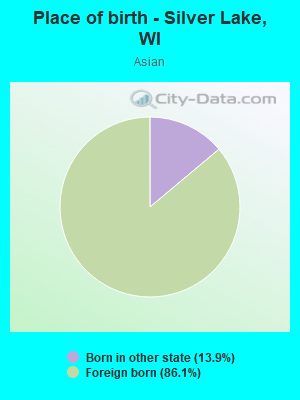
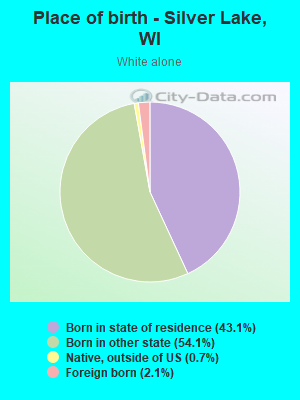
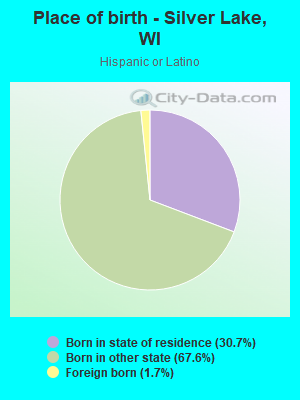
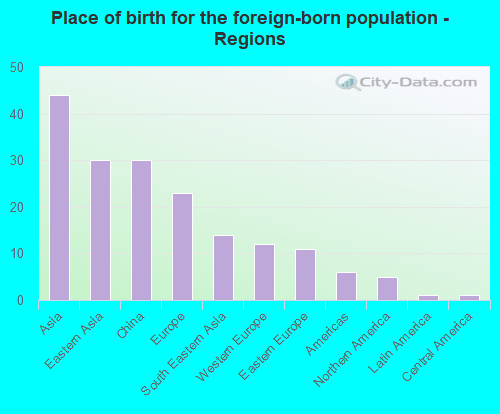
Place of birth for residents in Silver Lake
![Place of birth for the foreign-born population - Regions]()
- 44Asia
- 30Eastern Asia
- 30China
- 23Europe
- 14South Eastern Asia
- 12Western Europe
- 11Eastern Europe
- 6Americas
- 5Northern America
- 1Latin America
- 1Central America
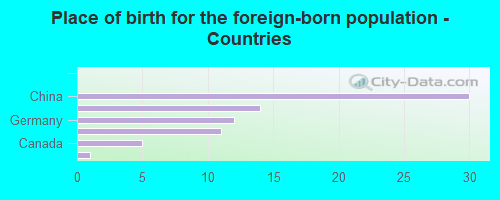
![Place of birth for the foreign-born population - Countries]()
- 30China
- 14Burma
- 12Germany
- 11Poland
- 5Canada
- 1Honduras
Grandparents responsible for own grandchildren in Silver Lake
Zip codes: 53170.