Races in Smithfield, Virginia (VA) Detailed Stats
Ancestries, Foreign-born residents, place of birth
Settings
X


Recent posts about races in Smithfield, Virginia on our local forum with over 2,400,000 registered users:
 | Trying to buy in the Norfolk Area (14 replies) |
| Williamsburg, Yorktown, Smithfield, Gloucester for retirement? (53 replies) |
| Publix coming to Richmond (134 replies) |
| Checking out New River Valley to relocate (5 replies) |
| Best Family Neighborhoods near Langley AFB, VA (50 replies) |
| Lurker with Suffolk house questions (4 replies) |
Latest news about races in Smithfield, VA collected exclusively by city-data.com from local newspapers, TV, and radio stations
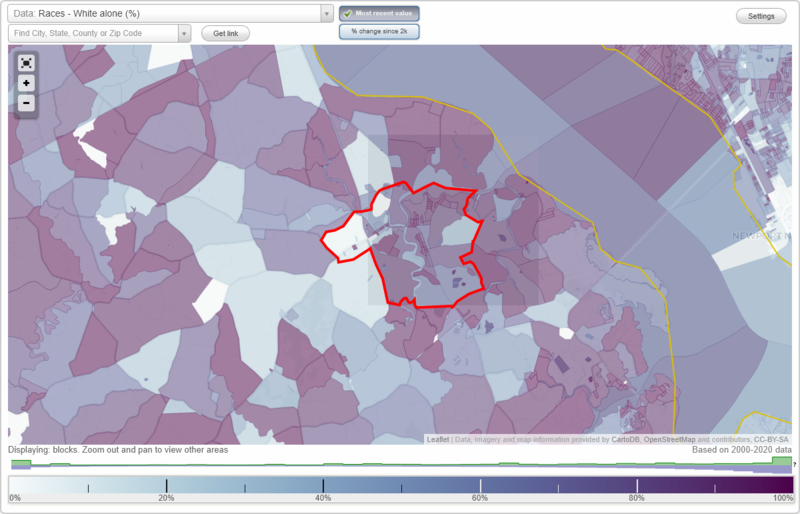
According to 2022 data, the most numerous races in Smithfield, VA are White alone (5,878 residents), Black alone (1,867 residents), and Hispanic (485 residents). 95.1% of Smithfield residents speak English at home. 3.5% of Smithfield, VA residents are foreign-born (1.6% born in Latin America, 1.4% born in Europe), which is 242.8% less than the foreign-born rate of 12.0% across the entire state of Virginia.
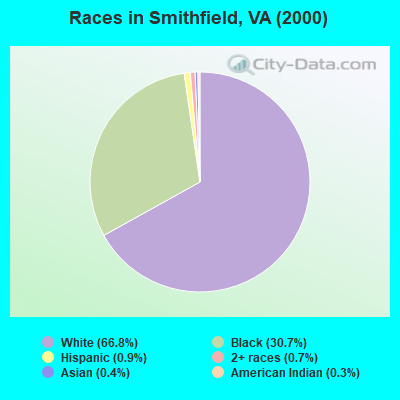
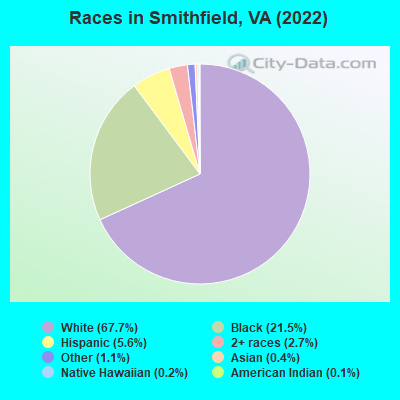
Race distribution in Smithfield
2000
2022

- 4,22366.8%White alone
- 1,94130.7%Black alone
- 590.9%Hispanic
- 460.7%Two or more races
- 260.4%Asian alone
- 220.3%American Indian alone
- 60.09%Other race alone
- 10.02%Native Hawaiian and Other
Pacific Islander alone
-
- 5,87867.7%White alone
- 1,86721.5%Black alone
- 4855.6%Hispanic
- 2362.7%Two or more races
- 951.1%Other race alone
- 330.4%Asian alone
- 150.2%Native Hawaiian and Other
Pacific Islander alone - 90.1%American Indian alone
2000
2022
-
- 4,965,63770.2%White alone
- 1,376,37819.4%Black alone
- 329,5404.7%Hispanic
- 259,2773.7%Asian alone
- 114,0221.6%Two or more races
- 18,5960.3%American Indian alone
- 11,6850.2%Other race alone
- 3,3800.05%Native Hawaiian and Other
Pacific Islander alone

-
- 5,095,13058.7%White alone
- 1,594,78518.4%Black alone
- 905,75010.4%Hispanic
- 602,8816.9%Asian alone
- 406,0474.7%Two or more races
- 60,4190.7%Other race alone
- 11,7380.1%American Indian alone
- 6,8690.08%Native Hawaiian and Other
Pacific Islander alone

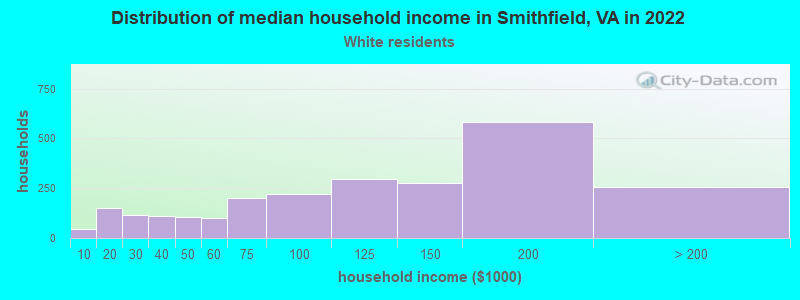
Income and house value in Smithfield
- Median household income in 2022
- $105,821White non-Hispanic householders
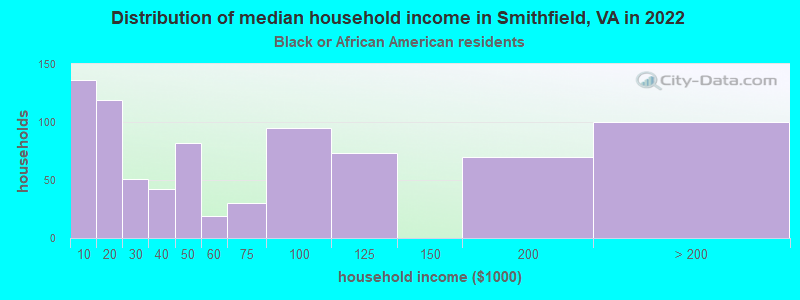
- $42,158Black householders
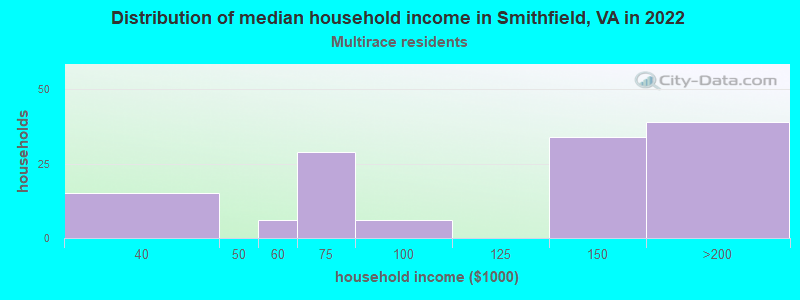
- $142,240Two or more races householders
- Median 2022 house value
- $395,268White Non-Hispanic householders
- $229,028Black or African American householders
- $449,483Two or more races householders
Household income for White non-Hispanic householders
Household income for Black householders
Household income for Some other race householders
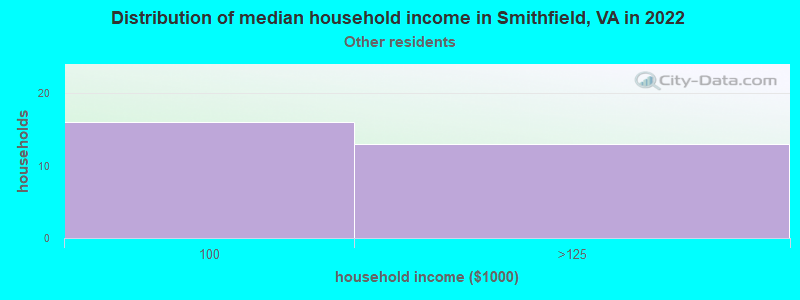
Household income for Two or more races householders
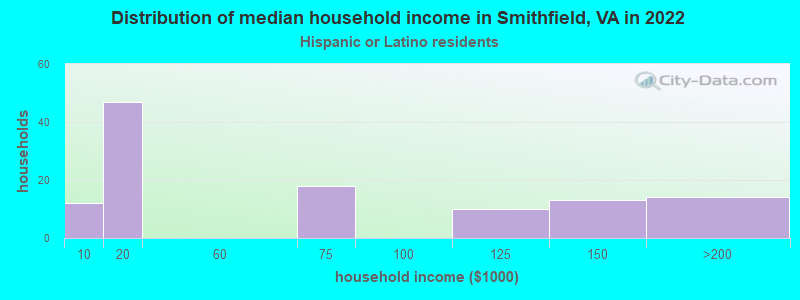
Household income for Hispanic or Latino race householders
Median age by race in Smithfield
- 48.0Median age for White residents
- 45.6Males
- 49.3Females
- 47.1Median age for Black or African American residents
- 50.1Males
- 39.5Females
- -682,215,742.8Median age for American Indian / Alaska Native residents
- -682,352,940.5Males
- -687,861,271.0Females
- 40.2Median age for Asian residents
- -681,198,909.4Males
- -676,870,747.6Females
- -611,955,419.9Median age for Native Hawaiian / Pacific Islander residents
- -541,531,822.5Males
- -714,150,046.8Females
- 17.6Median age for Other race residents
- 2.7Males
- 37.9Females
- 31.0Median age for Two or more races residents
- 30.4Males
- 31.2Females
- 47.9Median age for White alone residents
- 45.2Males
- 50.4Females
- 26.9Median age for Hispanic or Latino residents
- 26.7Males
- 27.1Females
Owner/renter occupied households by race in Smithfield
- House owners and renters - White residents
- 2,20188.5%Owner occupied
- 28611.5%Renter occupied
- House owners and renters - Black or African American residents
- 35243.9%Owner occupied
- 44956.1%Renter occupied
- House owners and renters - American Indian / Alaska Native residents
- 10100.0%Renter occupied
- House owners and renters - Native Hawaiian / Pacific Islander residents
- 12100.0%Owner occupied
- House owners and renters - Other race residents
- 31100.0%Owner occupied
- House owners and renters - Two or more races residents
- 12196.6%Owner occupied
- 43.4%Renter occupied
- House owners and renters - White alone residents
- 2,19988.6%Owner occupied
- 28411.4%Renter occupied
- House owners and renters - Hispanic or Latino residents
- 6460.1%Owner occupied
- 4339.9%Renter occupied
Language usage in Smithfield
- English speakers - Total
- 95.1% of residents of Smithfield speak English at home.
- 3.3% of residents speak Spanish at home
- 16762.3%Speak English very well
- 10137.7%Speak English less than very well
- 1.2% of residents speak other language at home
- 7979.8%Speak English very well
- 2020.2%Speak English less than very well
- English speakers - Born in the United States
- 96.7% of residents of Smithfield speak English at home.
- 1.2% of residents speak Spanish at home
- 42100.0%Speak English very well
- 1.7% of residents speak other language at home
- 4475.9%Speak English very well
- 1424.1%Speak English less than very well
- English speakers - Native, born elsewhere
- 67.5% of residents of Smithfield speak English at home.
- 29.0% of residents speak Spanish at home
- 2449.0%Speak English very well
- 2551.0%Speak English less than very well
- English speakers - Foreign-born
- 42.8% of residents of Smithfield speak English at home.
- 42.4% of residents speak Spanish at home
- 7558.1%Speak English very well
- 5441.9%Speak English less than very well
- 13.8% of residents speak other language at home
- 3685.7%Speak English very well
- 614.3%Speak English less than very well
White (Caucasian) - Speak only English
| Native: | 97.8% (5,290) |
| Foreign-born: | 62.5% (100) |
White (Caucasian) - Speak another language
| Native: | 2.4% (129) |
| Foreign-born: | 45.2% (72) |
Black or African American - Speak only English
| Native: | 99.8% (1,852) |
| Foreign-born: | 89.0% (10) |
White alone - Speak only English
| Native: | 98.4% (5,294) |
| Foreign-born: | 72.2% (107) |
White alone - Speak another language
| Native: | 1.6% (87) |
| Foreign-born: | 24.1% (36) |
Hispanic or Latino - Speak another language
| Native: | 31.2% (109) |
| Foreign-born: | 99.6% (128) |
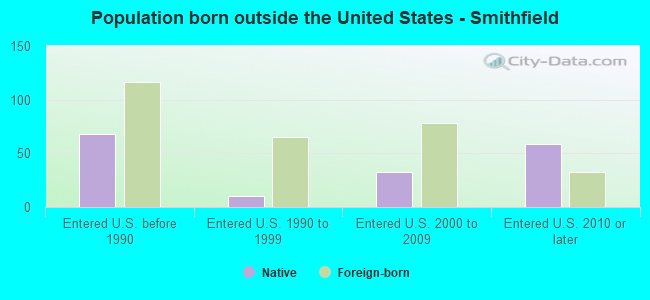
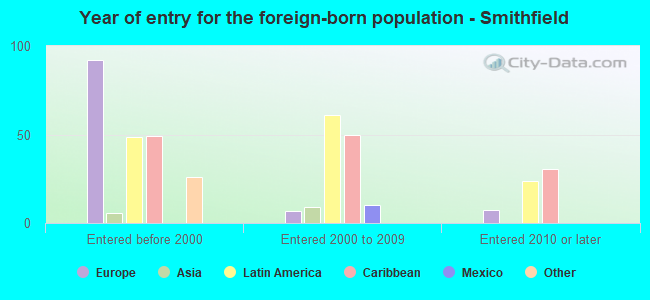
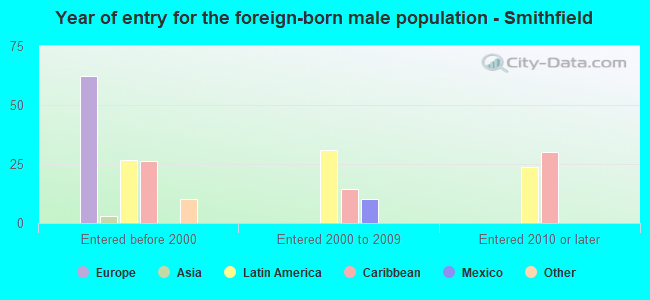
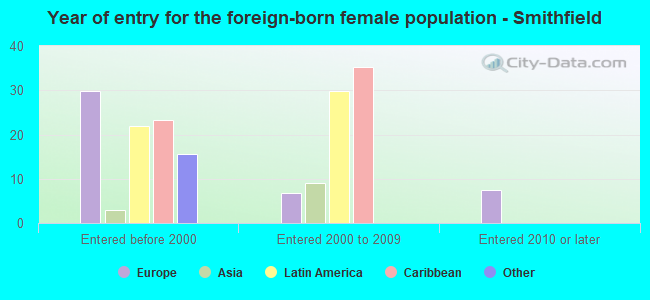
Foreign-born residents in Smithfield
304 residents are foreign born (1.6% Latin America, 1.4% Europe).
| This city: | 3.5% |
| Virginia: | 12.6% |

Marital status for residents in Smithfield
Marital status - White (Caucasian) population 15 years and over
- Males
- 19.9%Never married
- 62.6%Now married
- 2.9%Separated
- 2.3%Widowed
- 12.3%Divorced
- Females
- 11.6%Never married
- 64.0%Now married
- 1.1%Separated
- 15.4%Widowed
- 7.8%Divorced
Women who gave birth in the past 12 months
| Now married: | 72.1% (104) |
| Unmarried: | 27.9% (40) |
Women who did not give birth in the past 12 months
| Now married: | 75.1% (637) |
| Unmarried: | 24.9% (211) |
Marital status - Black or African American population 15 years and over
- Males
- 29.9%Never married
- 50.2%Now married
- 2.1%Separated
- 0.9%Widowed
- 16.9%Divorced
- Females
- 55.1%Never married
- 26.5%Now married
- 3.6%Separated
- 3.0%Widowed
- 11.8%Divorced
Women who did not give birth in the past 12 months
| Now married: | 15.8% (80) |
| Unmarried: | 84.2% (428) |
Marital status - Asian population 15 years and over
- Males
- 0.0%Never married
- 100.0%Now married
- 0.0%Separated
- 0.0%Widowed
- 0.0%Divorced
- Females
- 0.0%Never married
- 100.0%Now married
- 0.0%Separated
- 0.0%Widowed
- 0.0%Divorced
Women who did not give birth in the past 12 months
| Now married: | 100.0% (28) |
| Unmarried: | 0.0% (0) |
Marital status - Other race population 15 years and over
- Males
- 20.7%Never married
- 79.3%Now married
- 0.0%Separated
- 0.0%Widowed
- 0.0%Divorced
- Females
- 0.0%Never married
- 100.0%Now married
- 0.0%Separated
- 0.0%Widowed
- 0.0%Divorced
Women who gave birth in the past 12 months
| Now married: | 100.0% (9) |
| Unmarried: | 0.0% (0) |
Women who did not give birth in the past 12 months
| Now married: | 100.0% (13) |
| Unmarried: | 0.0% (0) |
Marital status - Two or more races population 15 years and over
- Males
- 55.7%Never married
- 30.0%Now married
- 0.0%Separated
- 0.0%Widowed
- 14.3%Divorced
- Females
- 29.9%Never married
- 35.9%Now married
- 0.0%Separated
- 0.0%Widowed
- 34.2%Divorced
Women who did not give birth in the past 12 months
| Now married: | 28.8% (31) |
| Unmarried: | 71.2% (78) |
Marital status - White alone, not Hispanic / Latino population 15 years and over
- Males
- 20.7%Never married
- 61.7%Now married
- 2.7%Separated
- 2.4%Widowed
- 12.5%Divorced
- Females
- 11.5%Never married
- 63.7%Now married
- 1.2%Separated
- 15.7%Widowed
- 8.0%Divorced
Women who gave birth in the past 12 months
| Now married: | 70.1% (99) |
| Unmarried: | 29.9% (42) |
Women who did not give birth in the past 12 months
| Now married: | 75.1% (637) |
| Unmarried: | 24.9% (211) |
Marital status - Hispanic or Latino population 15 years and over
- Males
- 31.7%Never married
- 51.4%Now married
- 3.7%Separated
- 0.0%Widowed
- 13.3%Divorced
- Females
- 40.8%Never married
- 29.6%Now married
- 0.0%Separated
- 0.0%Widowed
- 29.6%Divorced
Women who gave birth in the past 12 months
| Now married: | 100.0% (11) |
| Unmarried: | 0.0% (0) |
Women who did not give birth in the past 12 months
| Now married: | 24.6% (37) |
| Unmarried: | 75.4% (114) |
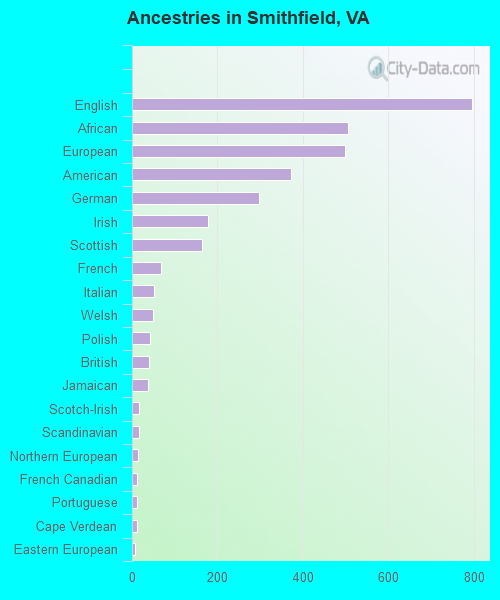
Ancestries in Smithfield

- 79618.9%English
- 50512.0%African
- 49911.9%European
- 3738.9%American
- 2977.1%German
- 1774.2%Irish
- 1633.9%Scottish
- 691.6%French
- 521.2%Italian
- 491.2%Welsh
- 431.0%Polish
- 401.0%British
- 380.9%Jamaican
- 170.4%Scotch-Irish
- 160.4%Scandinavian
- 130.3%Northern European
- 120.3%French Canadian
- 110.3%Portuguese
- 110.3%Cape Verdean
- 80.2%Eastern European
- 70.2%Hungarian
- 50.1%Norwegian
- 50.1%Russian
- 40.10%Pennsylvania German
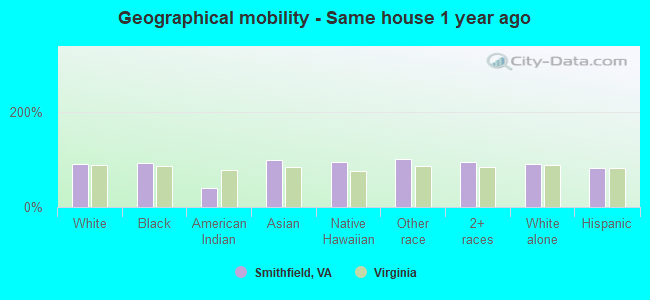
Geographical mobility in Smithfield

- Same house 1 year ago
- 5,14590.0%White (Caucasian)
- 1,82391.9%Black or African American
- 939.3%American Indian / Alaska Native
- 3498.7%Asian
- 1495.3%Native Hawaiian / Pacific Islander
- 90100.0%Other race
- 38695.1%Two or more races
- 5,17590.5%White alone, not Hispanic / Latino
- 38181.2%Hispanic or Latino
-
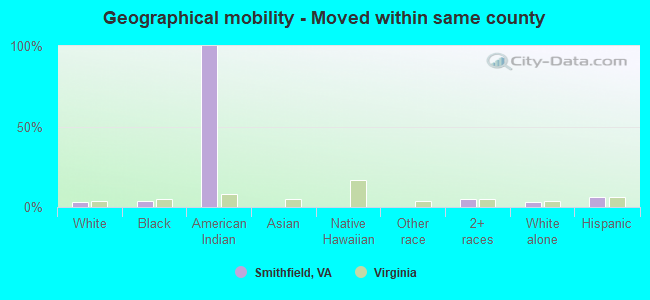
- Moved within same county
- 1612.8%White / Caucasian
- 804.0%Black or African American
- 27100.0%American Indian / Alaska Native
- 194.8%Two or more races
- 1662.9%White alone, not Hispanic / Latino
- 285.9%Hispanic or Latino
-
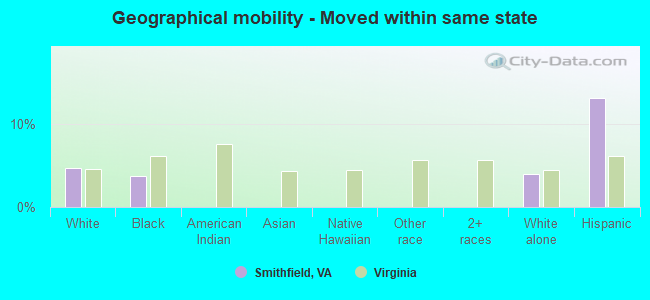
- Moved within same state
- 2734.8%White / Caucasian
- 743.7%Black or African American
- 2264.0%White alone, not Hispanic / Latino
- 6213.2%Hispanic or Latino
-
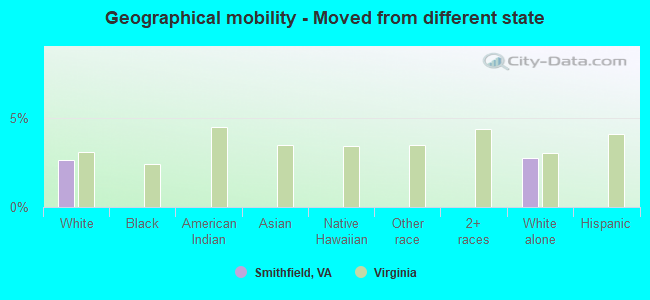
- Moved from different state
- 1512.6%White / Caucasian
- 1572.7%White alone, not Hispanic / Latino
-
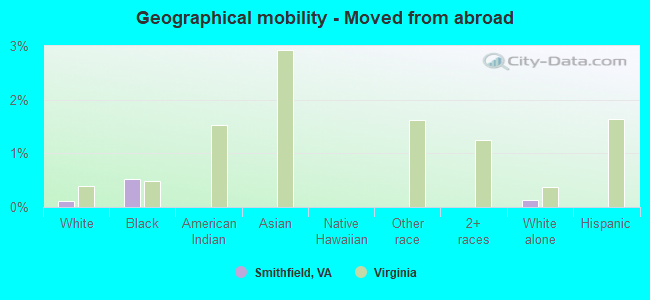
- Moved from abroad
- 70.1%White
- 100.5%Black or African American
- 70.1%White alone, not Hispanic / Latino
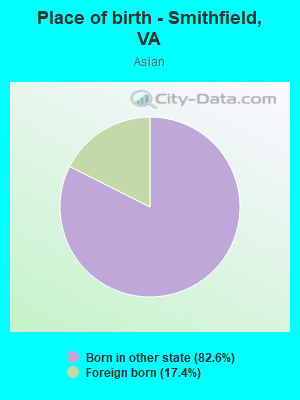
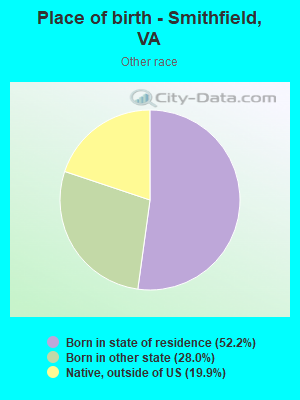
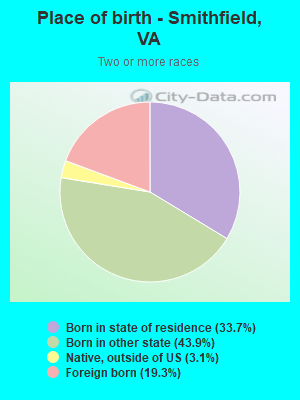
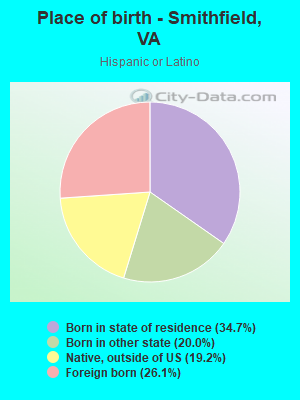
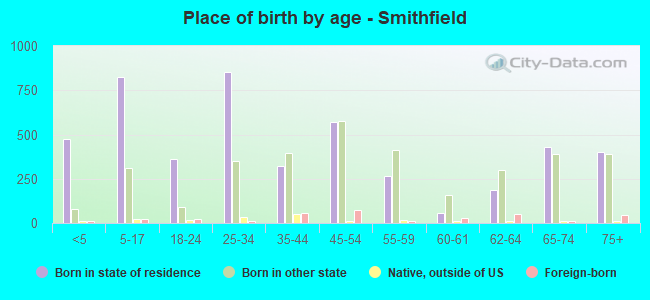
Children Nativity (place of birth) in Smithfield
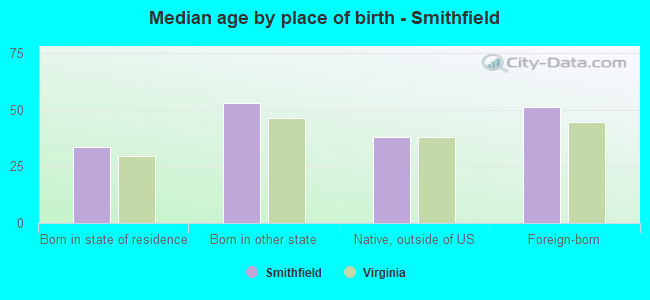
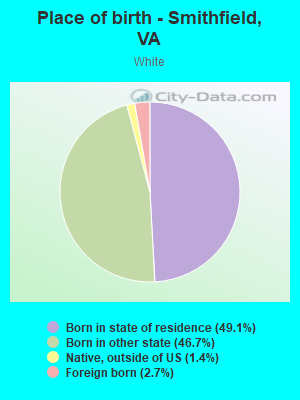
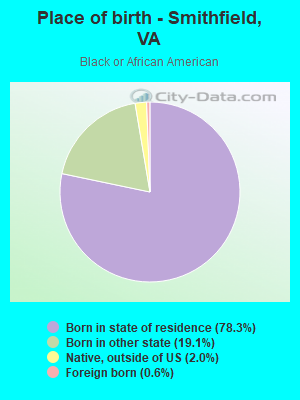
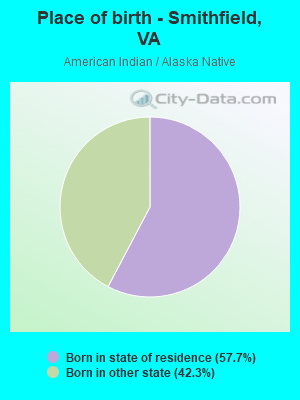
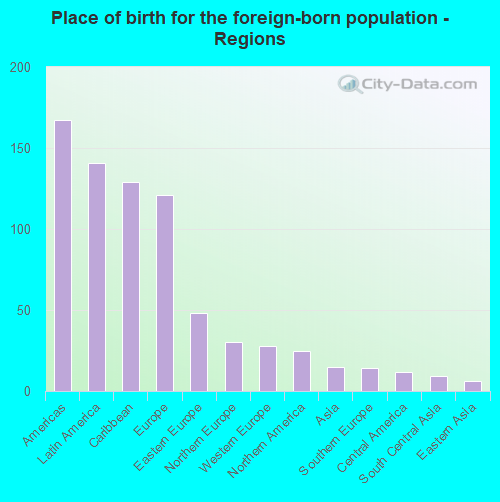
Place of birth for residents in Smithfield
![Place of birth for the foreign-born population - Regions]()
- 167Americas
- 141Latin America
- 129Caribbean
- 121Europe
- 48Eastern Europe
- 30Northern Europe
- 28Western Europe
- 25Northern America
- 15Asia
- 14Southern Europe
- 12Central America
- 9South Central Asia
- 6Eastern Asia
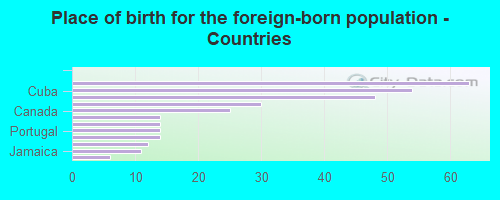
![Place of birth for the foreign-born population - Countries]()
- 63Dominican Republic
- 54Cuba
- 48Russia
- 30England
- 25Canada
- 14Germany
- 14Switzerland
- 14Portugal
- 14Azores Islands
- 12Mexico
- 11Jamaica
- 6Korea
Grandparents responsible for own grandchildren in Smithfield
Zip codes: 23430.