Races in Solana Beach, California (CA) Detailed Stats
Data:
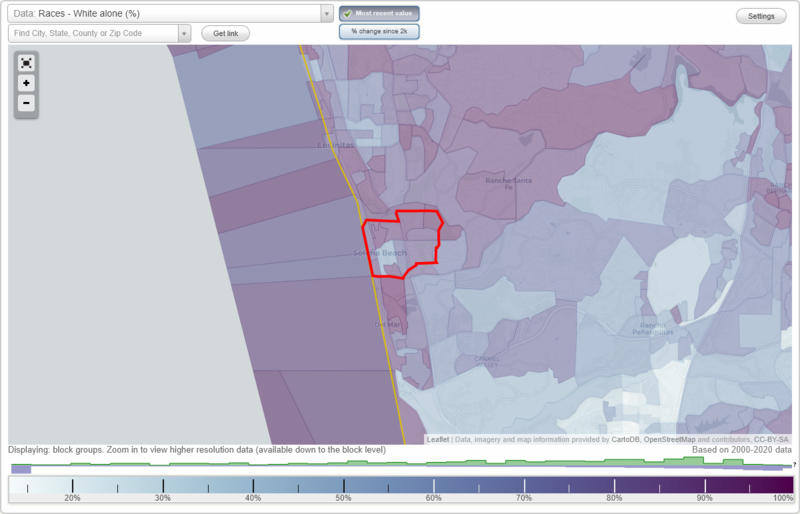
Races - White alone (%)
Races - White alone (% change since 2000)
Races - Black alone (%)
Races - Black alone (% change since 2000)
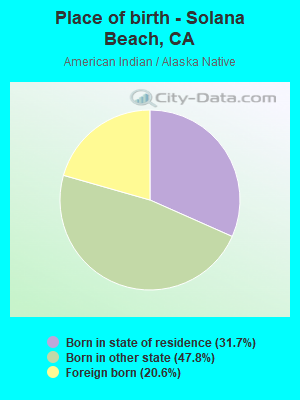
Races - American Indian alone (%)
Races - American Indian alone (% change since 2000)
Races - Asian alone (%)
Races - Asian alone (% change since 2000)
Races - Hispanic (%)
Races - Hispanic (% change since 2000)
Races - Native Hawaiian and Other Pacific Islander alone (%)
Races - Native Hawaiian and Other Pacific Islander alone (% change since 2000)
Races - Two or more races(%)
Races - Two or more races(% change since 2000)
Races - Other race alone (%)
Races - Other race alone (% change since 2000)
Racial diversity
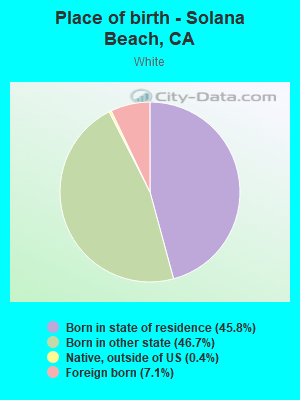
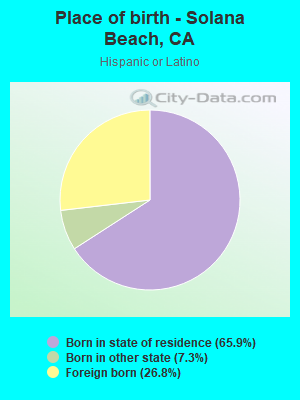
Place of birth - Born in state of residence (%)
Place of birth - Born in state of residence (%) - White
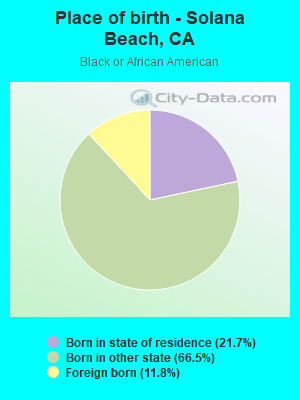
Place of birth - Born in state of residence (%) - Black or African American
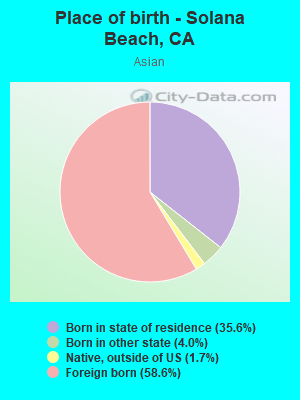
Place of birth - Born in state of residence (%) - Asian
Place of birth - Born in state of residence (%) - Hispanic or Latino
Place of birth - Born in state of residence (%) - American Indian and Alaska Native
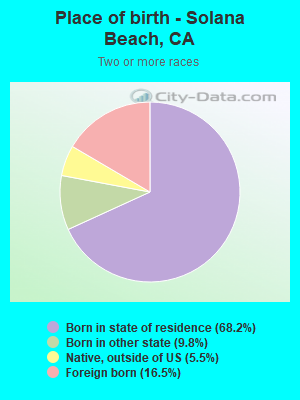
Place of birth - Born in state of residence (%) - Multirace
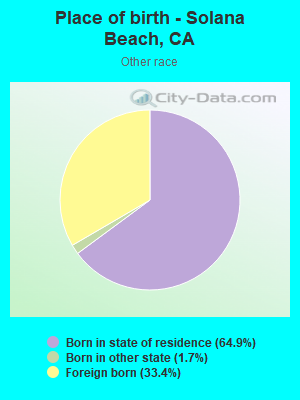
Place of birth - Born in state of residence (%) - Other Race
Place of birth - Born in other state (%)
Place of birth - Born in other state (%) - White
Place of birth - Born in other state (%) - Black or African American
Place of birth - Born in other state (%) - Asian
Place of birth - Born in other state (%) - Hispanic or Latino
Place of birth - Born in other state (%) - American Indian and Alaska Native
Place of birth - Born in other state (%) - Multirace
Place of birth - Born in other state (%) - Other Race
Place of birth - Native, outside of US (%)
Place of birth - Native, outside of US (%) - White
Place of birth - Native, outside of US (%) - Black or African American
Place of birth - Native, outside of US (%) - Asian
Place of birth - Native, outside of US (%) - Hispanic or Latino
Place of birth - Native, outside of US (%) - American Indian and Alaska Native
Place of birth - Native, outside of US (%) - Multirace
Place of birth - Native, outside of US (%) - Other Race
Place of birth - Foreign born (%)
Place of birth - Foreign born (%) - White
Place of birth - Foreign born (%) - Black or African American
Place of birth - Foreign born (%) - Asian
Place of birth - Foreign born (%) - Hispanic or Latino
Place of birth - Foreign born (%) - American Indian and Alaska Native
Place of birth - Foreign born (%) - Multirace
Place of birth - Foreign born (%) - Other Race
Residents speaking English at home (%)
Residents speaking English at home - Born in the United States (%)
Residents speaking English at home - Native, born elsewhere (%)
Residents speaking English at home - Foreign born (%)
Residents speaking Spanish at home (%)
Residents speaking Spanish at home - Born in the United States (%)
Residents speaking Spanish at home - Native, born elsewhere (%)
Residents speaking Spanish at home - Foreign born (%)
Residents speaking other language at home (%)
Residents speaking other language at home - Born in the United States (%)
Residents speaking other language at home - Native, born elsewhere (%)
Residents speaking other language at home - Foreign born (%)
Marital status - Never married (%)
Marital status - Now married (%)
Marital status - Separated (%)
Marital status - Widowed (%)
Marital status - Divorced (%)
Ancestries Reported - Arab (%)
Ancestries Reported - Czech (%)
Ancestries Reported - Danish (%)
Ancestries Reported - Dutch (%)
Ancestries Reported - English (%)
Ancestries Reported - French (%)
Ancestries Reported - French Canadian (%)
Ancestries Reported - German (%)
Ancestries Reported - Greek (%)
Ancestries Reported - Hungarian (%)
Ancestries Reported - Irish (%)
Ancestries Reported - Italian (%)
Ancestries Reported - Lithuanian (%)
Ancestries Reported - Norwegian (%)
Ancestries Reported - Polish (%)
Ancestries Reported - Portuguese (%)
Ancestries Reported - Russian (%)
Ancestries Reported - Scotch-Irish (%)
Ancestries Reported - Scottish (%)
Ancestries Reported - Slovak (%)
Ancestries Reported - Subsaharan African (%)
Ancestries Reported - Swedish (%)
Ancestries Reported - Swiss (%)
Ancestries Reported - Ukrainian (%)
Ancestries Reported - United States (%)
Ancestries Reported - Welsh (%)
Ancestries Reported - West Indian (%)
Ancestries Reported - Other (%)
Geographical mobility - Same house 1 year ago (%)
Geographical mobility - Same house 1 year ago (%) - White
Geographical mobility - Same house 1 year ago (%) - Black or African American
Geographical mobility - Same house 1 year ago (%) - Asian
Geographical mobility - Same house 1 year ago (%) - Hispanic or Latino
Geographical mobility - Same house 1 year ago (%) - American Indian and Alaska Native
Geographical mobility - Same house 1 year ago (%) - Multirace
Geographical mobility - Same house 1 year ago (%) - Other Race
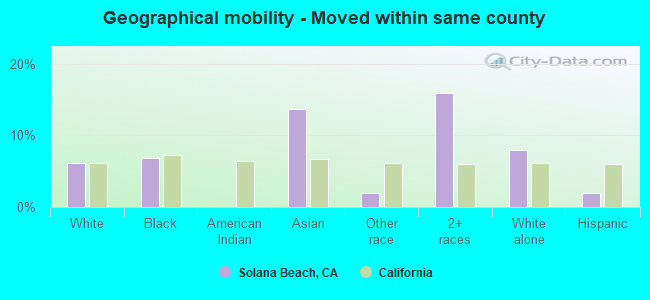
Geographical mobility - Moved within same county (%)
Geographical mobility - Moved within same county (%) - White
Geographical mobility - Moved within same county (%) - Black or African American
Geographical mobility - Moved within same county (%) - Asian
Geographical mobility - Moved within same county (%) - Hispanic or Latino
Geographical mobility - Moved within same county (%) - American Indian and Alaska Native
Geographical mobility - Moved within same county (%) - Multirace
Geographical mobility - Moved within same county (%) - Other Race
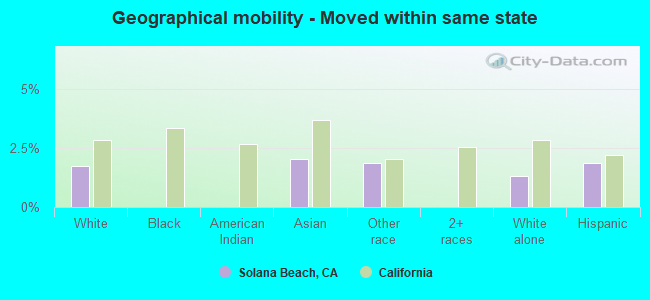
Geographical mobility - Moved from different county within same state (%)
Geographical mobility - Moved from different county within same state (%) - White
Geographical mobility - Moved from different county within same state (%) - Black or African American
Geographical mobility - Moved from different county within same state (%) - Asian
Geographical mobility - Moved from different county within same state (%) - Hispanic or Latino
Geographical mobility - Moved from different county within same state (%) - American Indian and Alaska Native
Geographical mobility - Moved from different county within same state (%) - Multirace
Geographical mobility - Moved from different county within same state (%) - Other Race
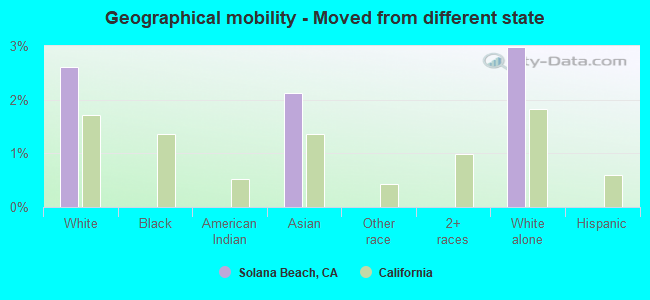
Geographical mobility - Moved from different state (%)
Geographical mobility - Moved from different state (%) - White
Geographical mobility - Moved from different state (%) - Black or African American
Geographical mobility - Moved from different state (%) - Asian
Geographical mobility - Moved from different state (%) - Hispanic or Latino
Geographical mobility - Moved from different state (%) - American Indian and Alaska Native
Geographical mobility - Moved from different state (%) - Multirace
Geographical mobility - Moved from different state (%) - Other Race
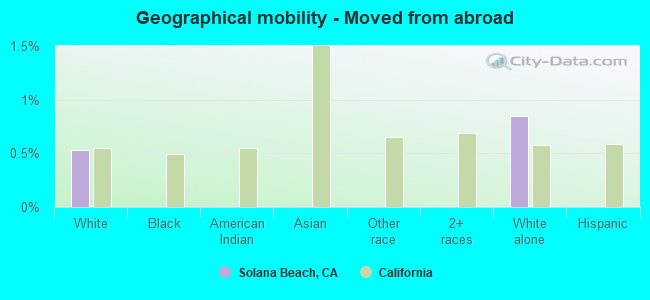
Geographical mobility - Moved from abroad (%)
Geographical mobility - Moved from abroad (%) - White
Geographical mobility - Moved from abroad (%) - Black or African American
Geographical mobility - Moved from abroad (%) - Asian
Geographical mobility - Moved from abroad (%) - Hispanic or Latino
Geographical mobility - Moved from abroad (%) - American Indian and Alaska Native
Geographical mobility - Moved from abroad (%) - Multirace
Geographical mobility - Moved from abroad (%) - Other Race
Place of birth for the foreign-born population - Ireland (%)
Place of birth for the foreign-born population - Denmark (%)
Place of birth for the foreign-born population - Norway (%)
Place of birth for the foreign-born population - Sweden (%)
Place of birth for the foreign-born population - United Kingdom (%)
Place of birth for the foreign-born population - England (%)
Place of birth for the foreign-born population - Scotland (%)
Place of birth for the foreign-born population - Other Northern Europe (%)
Place of birth for the foreign-born population - Austria (%)
Place of birth for the foreign-born population - Belgium (%)
Place of birth for the foreign-born population - France (%)
Place of birth for the foreign-born population - Germany (%)
Place of birth for the foreign-born population - Netherlands (%)
Place of birth for the foreign-born population - Switzerland (%)
Place of birth for the foreign-born population - Other Western Europe (%)
Place of birth for the foreign-born population - Greece (%)
Place of birth for the foreign-born population - Italy (%)
Place of birth for the foreign-born population - Portugal (%)
Place of birth for the foreign-born population - Spain (%)
Place of birth for the foreign-born population - Other Southern Europe (%)
Place of birth for the foreign-born population - Albania (%)
Place of birth for the foreign-born population - Belarus (%)
Place of birth for the foreign-born population - Bosnia and Herzegovina (%)
Place of birth for the foreign-born population - Bulgaria (%)
Place of birth for the foreign-born population - Croatia (%)
Place of birth for the foreign-born population - Czechoslovakia (%)
Place of birth for the foreign-born population - Hungary (%)
Place of birth for the foreign-born population - Latvia (%)
Place of birth for the foreign-born population - Lithuania (%)
Place of birth for the foreign-born population - North Macedonia (Macedonia) (%)
Place of birth for the foreign-born population - Moldova (%)
Place of birth for the foreign-born population - Poland (%)
Place of birth for the foreign-born population - Romania (%)
Place of birth for the foreign-born population - Russia (%)
Place of birth for the foreign-born population - Serbia (%)
Place of birth for the foreign-born population - Ukraine (%)
Place of birth for the foreign-born population - Other Eastern Europe (%)
Place of birth for the foreign-born population - China (%)
Place of birth for the foreign-born population - Hong Kong (%)
Place of birth for the foreign-born population - Taiwan (%)
Place of birth for the foreign-born population - Japan (%)
Place of birth for the foreign-born population - Korea (%)
Place of birth for the foreign-born population - Other Eastern Asia (%)
Place of birth for the foreign-born population - Afghanistan (%)
Place of birth for the foreign-born population - Bangladesh (%)
Place of birth for the foreign-born population - India (%)
Place of birth for the foreign-born population - Iran (%)
Place of birth for the foreign-born population - Kazakhstan (%)
Place of birth for the foreign-born population - Nepal (%)
Place of birth for the foreign-born population - Pakistan (%)
Place of birth for the foreign-born population - Sri Lanka (%)
Place of birth for the foreign-born population - Uzbekistan (%)
Place of birth for the foreign-born population - Other South Central Asia (%)
Place of birth for the foreign-born population - Burma (%)
Place of birth for the foreign-born population - Cambodia (%)
Place of birth for the foreign-born population - Indonesia (%)
Place of birth for the foreign-born population - Laos (%)
Place of birth for the foreign-born population - Malaysia (%)
Place of birth for the foreign-born population - Philippines (%)
Place of birth for the foreign-born population - Singapore (%)
Place of birth for the foreign-born population - Thailand (%)
Place of birth for the foreign-born population - Vietnam (%)
Place of birth for the foreign-born population - Other South Eastern Asia (%)
Place of birth for the foreign-born population - Armenia (%)
Place of birth for the foreign-born population - Iraq (%)
Place of birth for the foreign-born population - Israel (%)
Place of birth for the foreign-born population - Jordan (%)
Place of birth for the foreign-born population - Kuwait (%)
Place of birth for the foreign-born population - Lebanon (%)
Place of birth for the foreign-born population - Saudi Arabia (%)
Place of birth for the foreign-born population - Syria (%)
Place of birth for the foreign-born population - Turkey (%)
Place of birth for the foreign-born population - Yemen (%)
Place of birth for the foreign-born population - Other Western Asia (%)
Place of birth for the foreign-born population - Eritrea (%)
Place of birth for the foreign-born population - Ethiopia (%)
Place of birth for the foreign-born population - Kenya (%)
Place of birth for the foreign-born population - Somalia (%)
Place of birth for the foreign-born population - Uganda (%)
Place of birth for the foreign-born population - Zimbabwe (%)
Place of birth for the foreign-born population - Other Eastern Africa (%)
Place of birth for the foreign-born population - Cameroon (%)
Place of birth for the foreign-born population - Congo (%)
Place of birth for the foreign-born population - Democratic Republic of Congo (Zaire) (%)
Place of birth for the foreign-born population - Other Middle Africa (%)
Place of birth for the foreign-born population - Egypt (%)
Place of birth for the foreign-born population - Morocco (%)
Place of birth for the foreign-born population - Sudan (%)
Place of birth for the foreign-born population - Other Northern Africa (%)
Place of birth for the foreign-born population - South Africa (%)
Place of birth for the foreign-born population - Other Southern Africa (%)
Place of birth for the foreign-born population - Cabo Verde (%)
Place of birth for the foreign-born population - Ghana (%)
Place of birth for the foreign-born population - Liberia (%)
Place of birth for the foreign-born population - Nigeria (%)
Place of birth for the foreign-born population - Senegal (%)
Place of birth for the foreign-born population - Sierra Leone (%)
Place of birth for the foreign-born population - Other Western Africa (%)
Place of birth for the foreign-born population - Australia (%)
Place of birth for the foreign-born population - New Zealand (%)
Place of birth for the foreign-born population - Fiji (%)
Place of birth for the foreign-born population - Micronesia (%)
Place of birth for the foreign-born population - Bahamas (%)
Place of birth for the foreign-born population - Barbados (%)
Place of birth for the foreign-born population - Cuba (%)
Place of birth for the foreign-born population - Dominica (%)
Place of birth for the foreign-born population - Dominican Republic (%)
Place of birth for the foreign-born population - Grenada (%)
Place of birth for the foreign-born population - Haiti (%)
Place of birth for the foreign-born population - Jamaica (%)
Place of birth for the foreign-born population - St. Vincent and the Grenadines (%)
Place of birth for the foreign-born population - Trinidad and Tobago (%)
Place of birth for the foreign-born population - West Indies (%)
Place of birth for the foreign-born population - Other Caribbean (%)
Place of birth for the foreign-born population - Belize (%)
Place of birth for the foreign-born population - Costa Rica (%)
Place of birth for the foreign-born population - El Salvador (%)
Place of birth for the foreign-born population - Guatemala (%)
Place of birth for the foreign-born population - Honduras (%)
Place of birth for the foreign-born population - Mexico (%)
Place of birth for the foreign-born population - Nicaragua (%)
Place of birth for the foreign-born population - Panama (%)
Place of birth for the foreign-born population - Other Central America (%)
Place of birth for the foreign-born population - Argentina (%)
Place of birth for the foreign-born population - Bolivia (%)
Place of birth for the foreign-born population - Brazil (%)
Place of birth for the foreign-born population - Chile (%)
Place of birth for the foreign-born population - Colombia (%)
Place of birth for the foreign-born population - Ecuador (%)
Place of birth for the foreign-born population - Guyana (%)
Place of birth for the foreign-born population - Peru (%)
Place of birth for the foreign-born population - Uruguay (%)
Place of birth for the foreign-born population - Venezuela (%)
Place of birth for the foreign-born population - Other South America (%)
Place of birth for the foreign-born population - Canada (%)
Place of birth for the foreign-born population - Other Northern America (%)
Place of birth for the foreign-born population - Other (%)
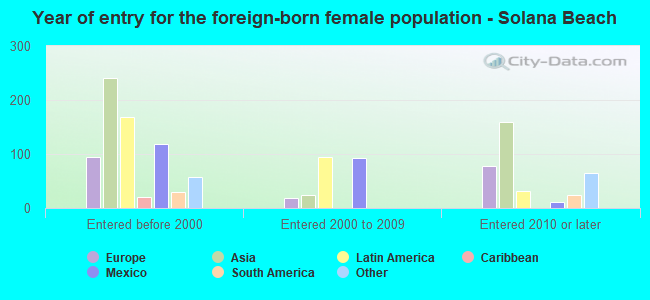
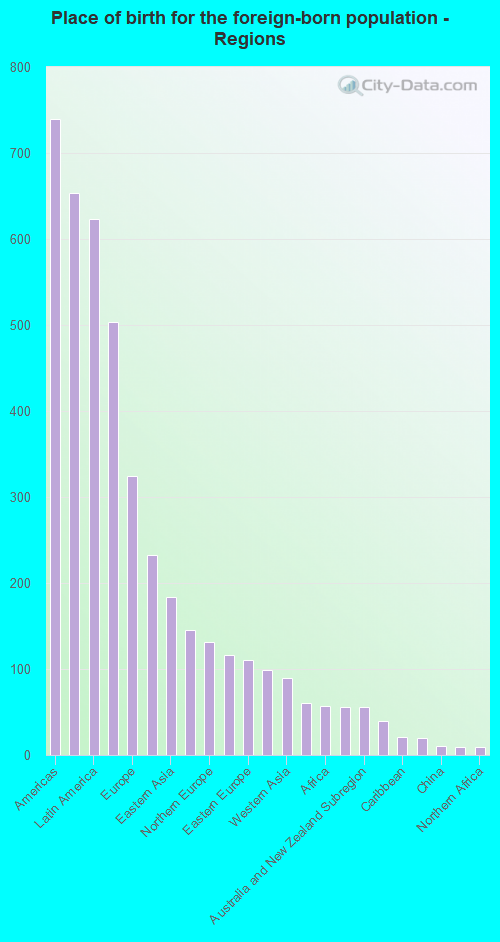
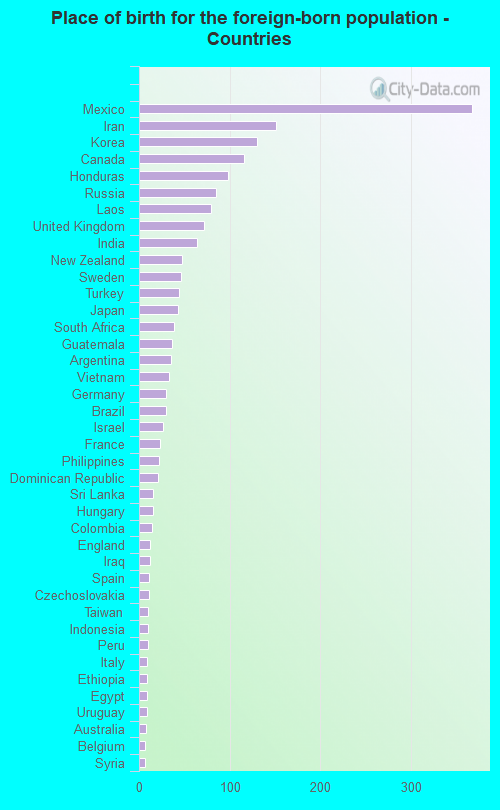
According to 2022 data, the most numerous races in Solana Beach, CA are Hispanic (2,149 residents), White alone (9,545 residents), and Asian alone (700 residents). 83.8% of Solana Beach residents speak English at home. 13.6% of Solana Beach, CA residents are foreign-born (4.8% born in Asia, 4.6% born in Latin America, 2.4% born in Europe), which is 91.2% less than the foreign-born rate of 26.0% across the entire state of California.
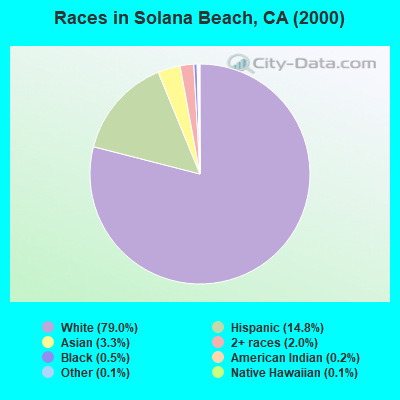
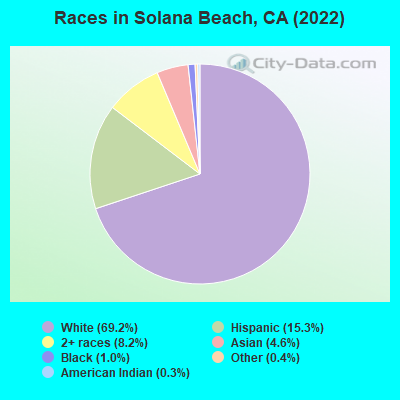
Race distribution in Solana Beach
2000 2022
15,816,790 46.7% White alone 10,966,556 32.4% Hispanic 3,648,860 10.8% Asian alone 2,181,926 6.4% Black alone 903,115 2.7% Two or more races 178,984 0.5% American Indian alone 103,736 0.3% Native Hawaiian and Other 71,681 0.2% Other race alone
15,732,184 40.3% Hispanic 13,160,426 33.7% White alone 5,957,867 15.3% Asian alone 2,025,218 5.2% Black alone 1,663,222 4.3% Two or more races 251,618 0.6% Other race alone 135,777 0.3% Native Hawaiian and Other 103,030 0.3% American Indian alone
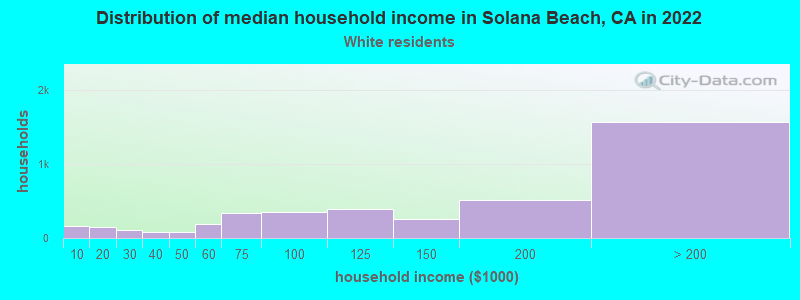
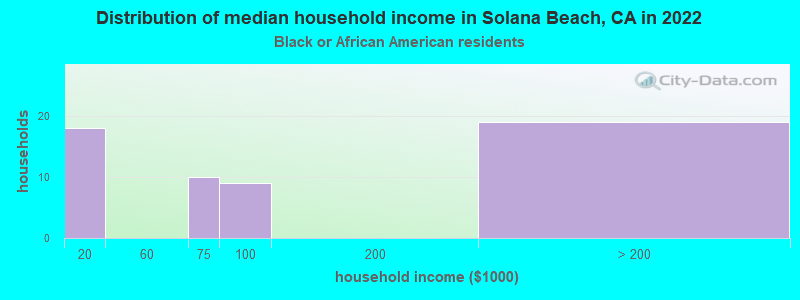
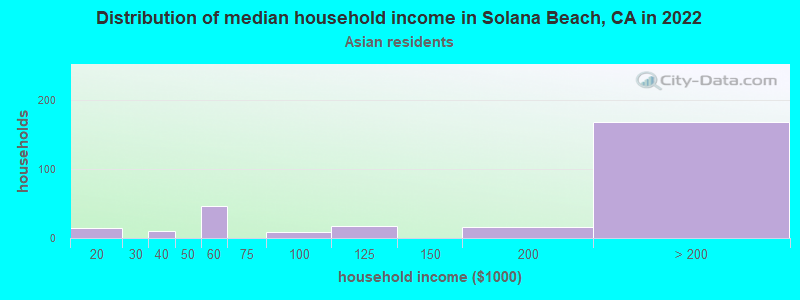
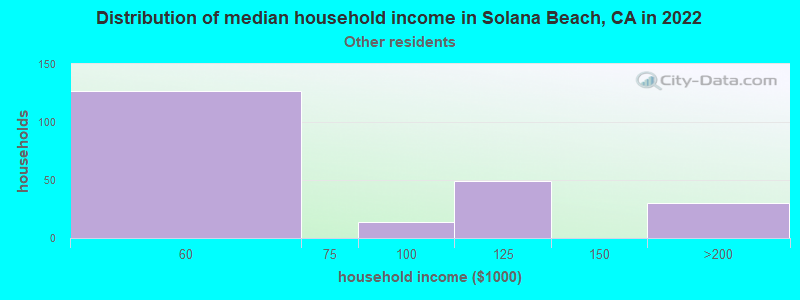
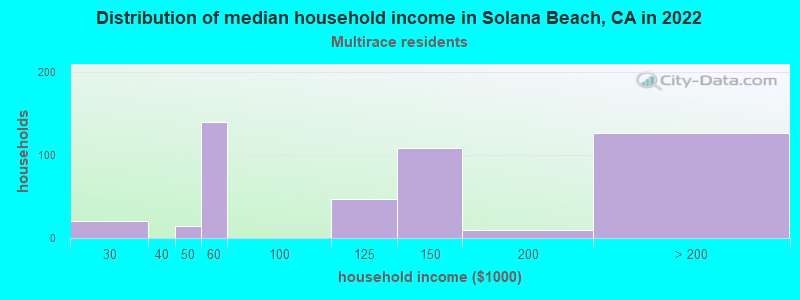
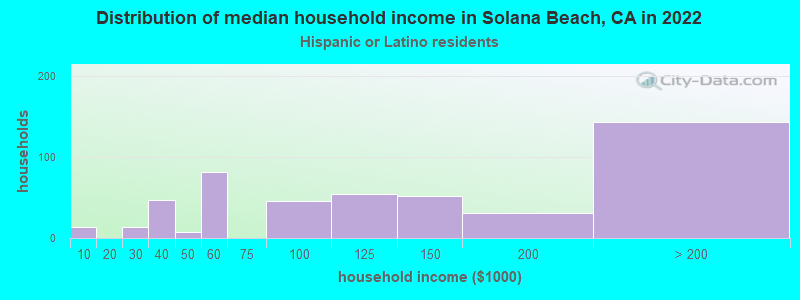
Income and house value in Solana Beach Median household income in 2022 $141,945 White non-Hispanic householdersover $200,000 Black householders$19,109 American Indian and Alaska Native householders$147,115 Asian householders$126,571 Some other race householders$80,728 Two or more races householders$116,090 Hispanic or Latino race householdersMedian 2022 house value over $1,000,000 White Non-Hispanic householders$854,832 American Indian or Alaska Native householders over $1,000,000 Asian householdersover $1,000,000 Some other race householdersover $1,000,000 Two or more races householdersover $1,000,000 Hispanic or Latino householders
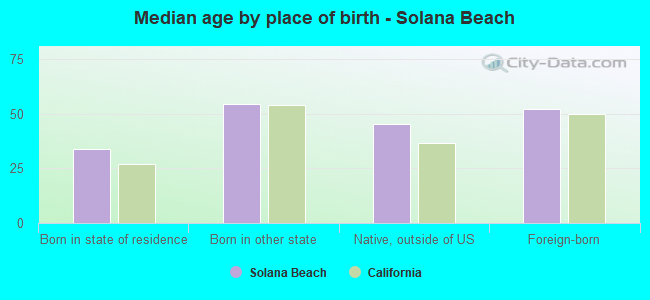
Median age by race in Solana Beach
51.6 Median age for White residents52.2 51.1 50.9 Median age for Black or African American residents41.6 Median age for American Indian / Alaska Native residents47.6 Median age for Asian residents53.8 45.7 42.0 Median age for Other race residents40.5 43.9 20.0 Median age for Two or more races residents20.4 20.6 50.9 Median age for White alone residents51.7 50.2 39.4 Median age for Hispanic or Latino residents41.0 34.7
Owner/renter occupied households by race in Solana Beach
House owners and renters - White residents 2,771 64.0% Owner occupied1,556 36.0% Renter occupiedHouse owners and renters - Black or African American residents 37 66.5% Owner occupied18 33.5% Renter occupiedHouse owners and renters - Asian residents 187 61.9% Owner occupied115 38.1% Renter occupiedHouse owners and renters - Other race residents 136 60.0% Owner occupied91 40.0% Renter occupiedHouse owners and renters - Two or more races residents 39 13.1% Owner occupied259 86.9% Renter occupiedHouse owners and renters - White alone residents 2,926 64.6% Owner occupied1,604 35.4% Renter occupiedHouse owners and renters - Hispanic or Latino residents 182 43.6% Owner occupied236 56.4% Renter occupied
Language usage in Solana Beach
English speakers - Total 83.8% of residents of Solana Beach speak English at home.
9.5% of residents speak Spanish at home 896 73.2% Speak English very well328 26.8% Speak English less than very well7.2% of residents speak other language at home 612 66.7% Speak English very well306 33.3% Speak English less than very well
English speakers - Born in the United States 97.6% of residents of Solana Beach speak English at home.
1.0% of residents speak Spanish at home 25 51.0% Speak English very well24 49.0% Speak English less than very well1.1% of residents speak other language at home 53 100.0% Speak English very well
All residents speak only English at home
English speakers - Foreign-born 34.3% of residents of Solana Beach speak English at home.
29.1% of residents speak Spanish at home 244 46.7% Speak English very well278 53.3% Speak English less than very well39.8% of residents speak other language at home 436 61.2% Speak English very well276 38.8% Speak English less than very well
White (Caucasian) - Speak only English Native:
100.0% (8,127)Foreign-born:
59.7% (389)
White (Caucasian) - Speak another language Native:
2.9% (236)Foreign-born:
55.2% (360)
American Indian / Alaska Native - Speak another language Native:
22.0% (29)Foreign-born:
100.0% (30)
Asian - Speak only English Native:
90.3% (273)Foreign-born:
35.0% (142)
Asian - Speak another language Native:
15.0% (45)Foreign-born:
68.8% (280)
Other race - Speak only English Native:
39.3% (295)Foreign-born:
17.6% (56)
Other race - Speak another language Native:
61.5% (461)Foreign-born:
86.6% (273)
Two or more races - Speak another language Native:
16.8% (213)Foreign-born:
100.0% (245)
White alone - Speak only English Native:
96.4% (8,119)Foreign-born:
47.3% (380)
White alone - Speak another language Native:
3.5% (296)Foreign-born:
52.5% (422)
Hispanic or Latino - Speak only English Native:
68.6% (1,037)Foreign-born:
15.2% (82)
Hispanic or Latino - Speak another language Native:
36.0% (544)Foreign-born:
88.2% (474)
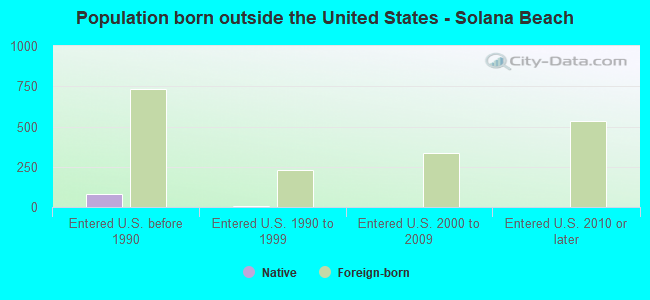
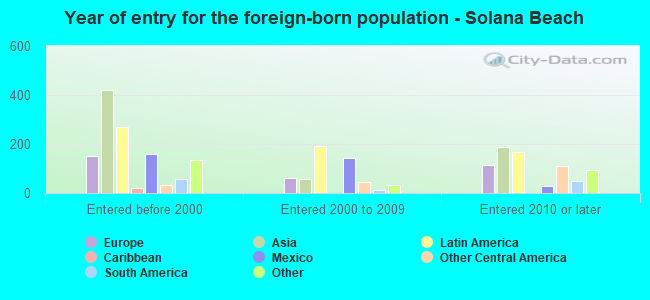
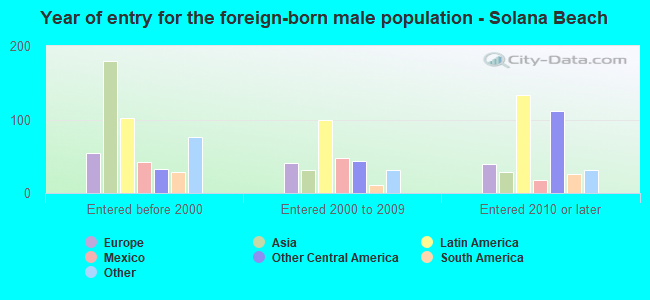
Foreign-born residents in Solana Beach 1,832 residents are foreign born (4.8% Asia , 4.6% Latin America , 2.4% Europe ).
This city:
13.6%California:
100.0%
Marital status for residents in Solana Beach Marital status - White (Caucasian) population 15 years and over
Males 26.7% Never married58.2% Now married0.3% Separated2.1% Widowed12.7% DivorcedFemales 28.3% Never married48.2% Now married0.0% Separated9.3% Widowed14.3% DivorcedWomen who gave birth in the past 12 months Now married:
77.2% (110)Unmarried:
22.8% (32)
Women who did not give birth in the past 12 months Now married:
30.7% (559)Unmarried:
69.3% (1,265)
Marital status - Black or African American population 15 years and over
Males 0.0% Never married100.0% Now married0.0% Separated0.0% Widowed0.0% DivorcedFemales 50.6% Never married0.0% Now married0.0% Separated36.4% Widowed13.0% DivorcedWomen who did not give birth in the past 12 months Now married:
0.0% (0)Unmarried:
100.0% (35)
Marital status - Asian population 15 years and over
Males 32.0% Never married68.0% Now married0.0% Separated0.0% Widowed0.0% DivorcedFemales 32.1% Never married50.4% Now married2.5% Separated5.4% Widowed9.6% DivorcedWomen who gave birth in the past 12 months Now married:
100.0% (17)Unmarried:
0.0% (0)
Women who did not give birth in the past 12 months Now married:
47.0% (130)Unmarried:
53.0% (146)
Marital status - Other race population 15 years and over
Males 39.2% Never married40.1% Now married0.0% Separated2.6% Widowed18.0% DivorcedFemales 40.2% Never married40.8% Now married0.0% Separated3.2% Widowed15.8% DivorcedWomen who did not give birth in the past 12 months Now married:
49.5% (136)Unmarried:
50.5% (139)
Marital status - Two or more races population 15 years and over
Males 79.0% Never married16.5% Now married0.0% Separated0.0% Widowed4.5% DivorcedFemales 39.2% Never married10.8% Now married0.0% Separated0.0% Widowed50.0% DivorcedWomen who did not give birth in the past 12 months Now married:
16.0% (39)Unmarried:
84.0% (203)
Marital status - White alone, not Hispanic / Latino population 15 years and over
Males 27.1% Never married58.1% Now married0.3% Separated2.2% Widowed12.3% DivorcedFemales 28.1% Never married47.4% Now married0.0% Separated9.8% Widowed14.7% DivorcedWomen who gave birth in the past 12 months Now married:
72.7% (100)Unmarried:
27.3% (37)
Women who did not give birth in the past 12 months Now married:
28.7% (561)Unmarried:
71.3% (1,393)
Marital status - Hispanic or Latino population 15 years and over
Males 46.3% Never married36.0% Now married1.7% Separated1.3% Widowed14.6% DivorcedFemales 37.2% Never married46.8% Now married0.0% Separated1.8% Widowed14.2% DivorcedWomen who gave birth in the past 12 months Now married:
100.0% (31)Unmarried:
0.0% (0)
Women who did not give birth in the past 12 months Now married:
47.2% (239)Unmarried:
52.8% (267)
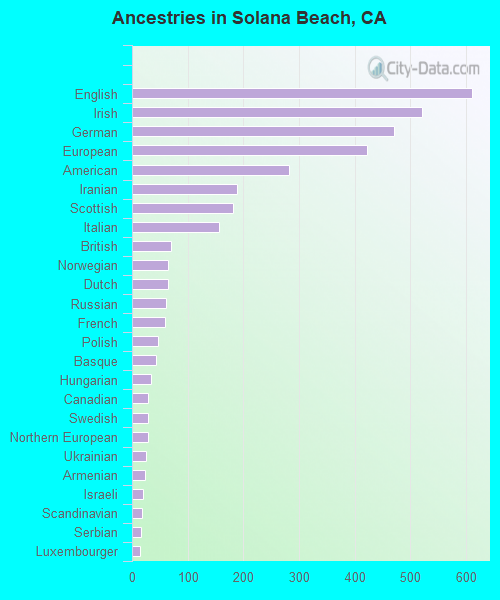
Ancestries in Solana Beach
531 8.9% English528 8.8% European422 7.0% Irish404 6.7% American337 5.6% Italian217 3.6% German182 3.0% Iranian101 1.7% Polish89 1.5% Northern European80 1.3% British76 1.3% Russian69 1.2% Swedish58 1.0% Dutch44 0.7% Greek41 0.7% Turkish40 0.7% Norwegian40 0.7% Scandinavian40 0.7% Slavic37 0.6% Armenian31 0.5% Scottish27 0.5% French Canadian26 0.4% French23 0.4% Scotch-Irish16 0.3% Portuguese14 0.2% Lebanese13 0.2% Czech13 0.2% Ukrainian12 0.2% Palestinian12 0.2% Hungarian12 0.2% Slovak10 0.2% Canadian9 0.2% Brazilian9 0.2% Croatian8 0.1% Czechoslovakian8 0.1% Romanian6 0.1% Belgian6 0.1% Latvian6 0.1% Lithuanian6 0.1% South African
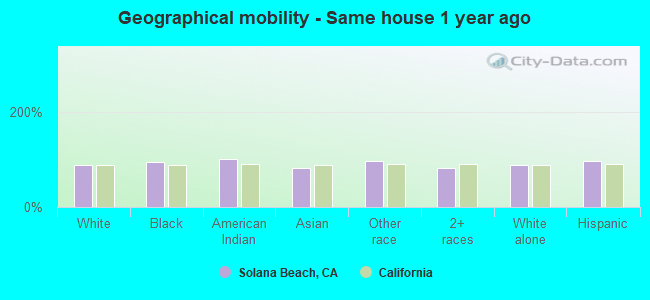
Geographical mobility in Solana Beach Same house 1 year ago 7,800 89.2% White (Caucasian)86 94.1% Black or African American170 100.0% American Indian / Alaska Native576 81.9% Asian1,017 96.2% Other race1,285 81.1% Two or more races8,191 86.6% White alone, not Hispanic / Latino2,052 97.1% Hispanic or LatinoMoved within same county 538 6.2% White / Caucasian6 6.8% Black or African American97 13.7% Asian21 2.0% Other race253 16.0% Two or more races754 8.0% White alone, not Hispanic / Latino43 2.0% Hispanic or LatinoMoved within same state 153 1.7% White / Caucasian14 2.0% Asian20 1.9% Other race124 1.3% White alone, not Hispanic / Latino39 1.9% Hispanic or LatinoMoved from different state 229 2.6% White / Caucasian15 2.1% Asian282 3.0% White alone, not Hispanic / LatinoMoved from abroad 46 0.5% White80 0.9% White alone, not Hispanic / Latino
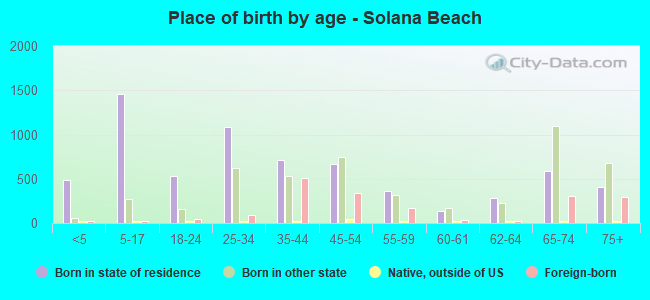
Children Nativity (place of birth) in Solana Beach
Children under 6 years - Living with two parents Both parents native 357 100.0% NativeBoth parents foreign-born 29 100.0% NativeOne native, one foreign-born parent 140 100.0% NativeChildren under 6 years - Living with one parent Native parent 125 100.0% NativeChildren 6 to 17 years - Living with two parents Both parents native 728 98.4% Native12 1.6% Foreign-bornBoth parents foreign-born 184 94.2% Native11 5.8% Foreign-bornOne native, one foreign-born parent 195 100.0% NativeChildren 6 to 17 years - Living with one parent Native parent 486 100.0% NativeForeign-born parent 33 50.2% Native33 49.8% Foreign-born