Races in South Bay, Florida (FL) Detailed Stats
Data:
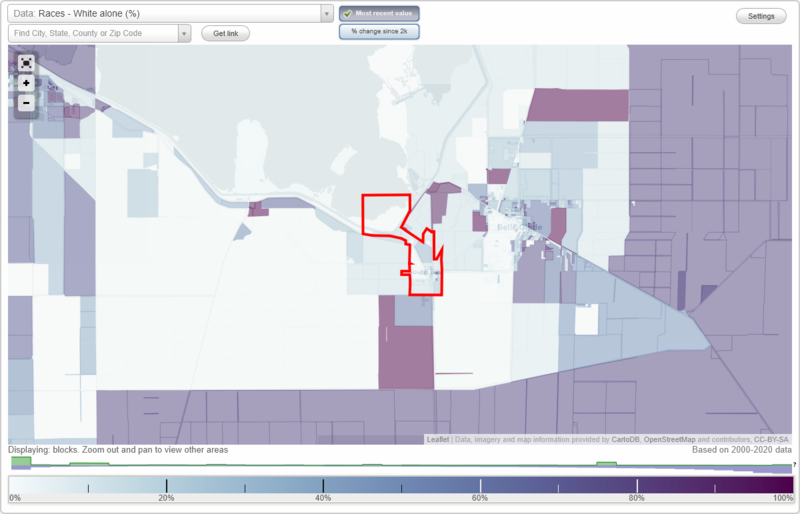
Races - White alone (%)
Races - White alone (% change since 2000)
Races - Black alone (%)
Races - Black alone (% change since 2000)
Races - American Indian alone (%)
Races - American Indian alone (% change since 2000)
Races - Asian alone (%)
Races - Asian alone (% change since 2000)
Races - Hispanic (%)
Races - Hispanic (% change since 2000)
Races - Native Hawaiian and Other Pacific Islander alone (%)
Races - Native Hawaiian and Other Pacific Islander alone (% change since 2000)
Races - Two or more races(%)
Races - Two or more races(% change since 2000)
Races - Other race alone (%)
Races - Other race alone (% change since 2000)
Racial diversity
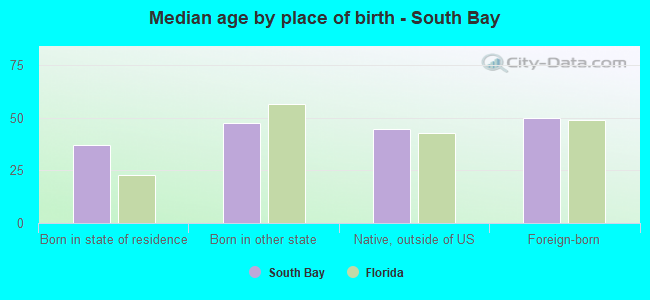
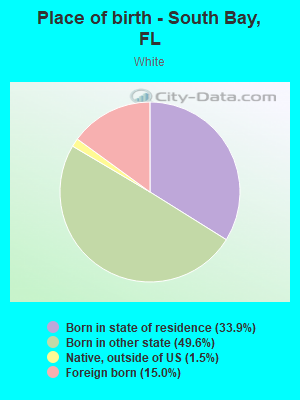
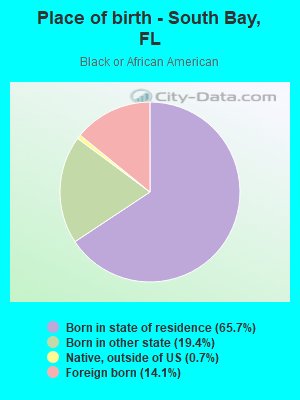
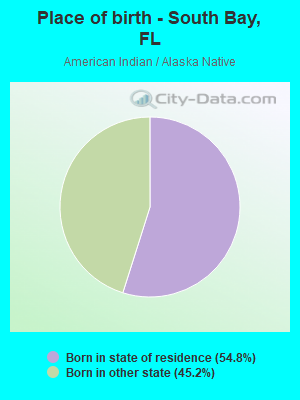
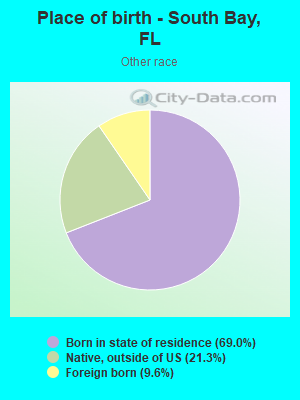
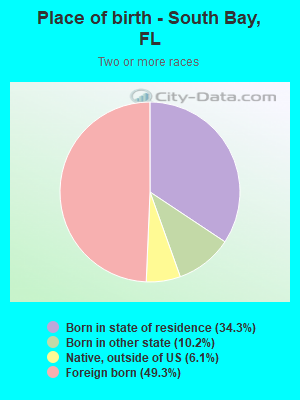
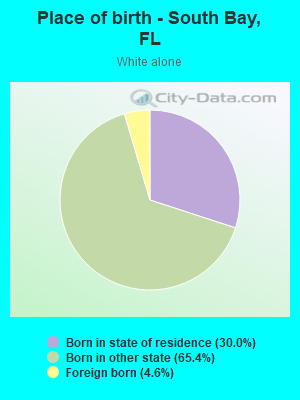
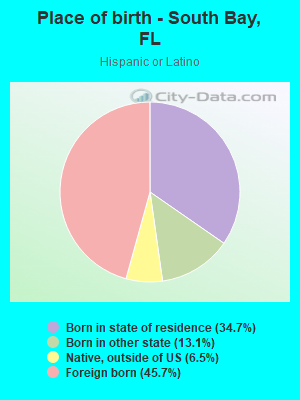
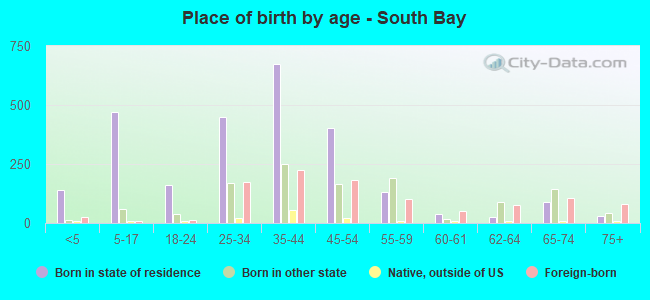
Place of birth - Born in state of residence (%)
Place of birth - Born in state of residence (%) - White
Place of birth - Born in state of residence (%) - Black or African American
Place of birth - Born in state of residence (%) - Asian
Place of birth - Born in state of residence (%) - Hispanic or Latino
Place of birth - Born in state of residence (%) - American Indian and Alaska Native
Place of birth - Born in state of residence (%) - Multirace
Place of birth - Born in state of residence (%) - Other Race
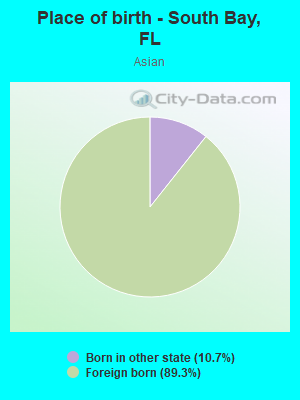
Place of birth - Born in other state (%)
Place of birth - Born in other state (%) - White
Place of birth - Born in other state (%) - Black or African American
Place of birth - Born in other state (%) - Asian
Place of birth - Born in other state (%) - Hispanic or Latino
Place of birth - Born in other state (%) - American Indian and Alaska Native
Place of birth - Born in other state (%) - Multirace
Place of birth - Born in other state (%) - Other Race
Place of birth - Native, outside of US (%)
Place of birth - Native, outside of US (%) - White
Place of birth - Native, outside of US (%) - Black or African American
Place of birth - Native, outside of US (%) - Asian
Place of birth - Native, outside of US (%) - Hispanic or Latino
Place of birth - Native, outside of US (%) - American Indian and Alaska Native
Place of birth - Native, outside of US (%) - Multirace
Place of birth - Native, outside of US (%) - Other Race
Place of birth - Foreign born (%)
Place of birth - Foreign born (%) - White
Place of birth - Foreign born (%) - Black or African American
Place of birth - Foreign born (%) - Asian
Place of birth - Foreign born (%) - Hispanic or Latino
Place of birth - Foreign born (%) - American Indian and Alaska Native
Place of birth - Foreign born (%) - Multirace
Place of birth - Foreign born (%) - Other Race
Residents speaking English at home (%)
Residents speaking English at home - Born in the United States (%)
Residents speaking English at home - Native, born elsewhere (%)
Residents speaking English at home - Foreign born (%)
Residents speaking Spanish at home (%)
Residents speaking Spanish at home - Born in the United States (%)
Residents speaking Spanish at home - Native, born elsewhere (%)
Residents speaking Spanish at home - Foreign born (%)
Residents speaking other language at home (%)
Residents speaking other language at home - Born in the United States (%)
Residents speaking other language at home - Native, born elsewhere (%)
Residents speaking other language at home - Foreign born (%)
Marital status - Never married (%)
Marital status - Now married (%)
Marital status - Separated (%)
Marital status - Widowed (%)
Marital status - Divorced (%)
Ancestries Reported - Arab (%)
Ancestries Reported - Czech (%)
Ancestries Reported - Danish (%)
Ancestries Reported - Dutch (%)
Ancestries Reported - English (%)
Ancestries Reported - French (%)
Ancestries Reported - French Canadian (%)
Ancestries Reported - German (%)
Ancestries Reported - Greek (%)
Ancestries Reported - Hungarian (%)
Ancestries Reported - Irish (%)
Ancestries Reported - Italian (%)
Ancestries Reported - Lithuanian (%)
Ancestries Reported - Norwegian (%)
Ancestries Reported - Polish (%)
Ancestries Reported - Portuguese (%)
Ancestries Reported - Russian (%)
Ancestries Reported - Scotch-Irish (%)
Ancestries Reported - Scottish (%)
Ancestries Reported - Slovak (%)
Ancestries Reported - Subsaharan African (%)
Ancestries Reported - Swedish (%)
Ancestries Reported - Swiss (%)
Ancestries Reported - Ukrainian (%)
Ancestries Reported - United States (%)
Ancestries Reported - Welsh (%)
Ancestries Reported - West Indian (%)
Ancestries Reported - Other (%)
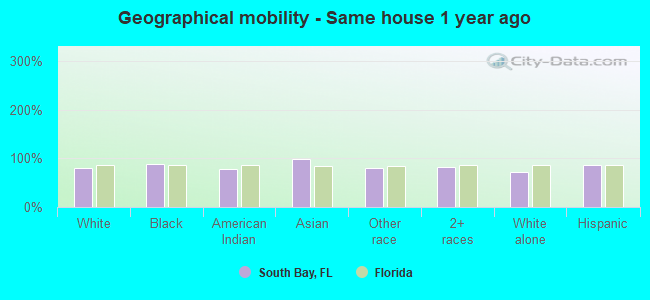
Geographical mobility - Same house 1 year ago (%)
Geographical mobility - Same house 1 year ago (%) - White
Geographical mobility - Same house 1 year ago (%) - Black or African American
Geographical mobility - Same house 1 year ago (%) - Asian
Geographical mobility - Same house 1 year ago (%) - Hispanic or Latino
Geographical mobility - Same house 1 year ago (%) - American Indian and Alaska Native
Geographical mobility - Same house 1 year ago (%) - Multirace
Geographical mobility - Same house 1 year ago (%) - Other Race
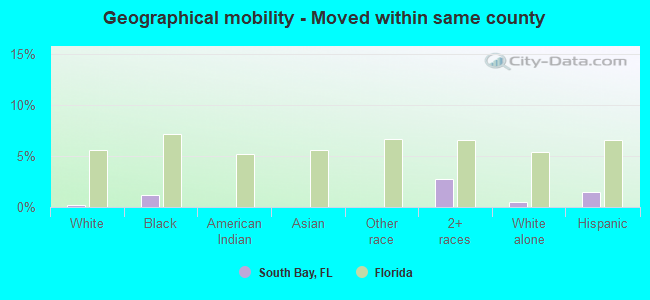
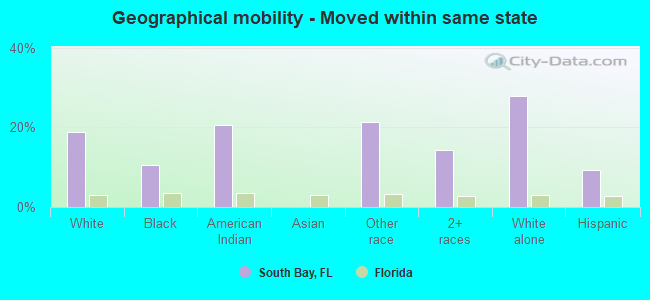
Geographical mobility - Moved within same county (%)
Geographical mobility - Moved within same county (%) - White
Geographical mobility - Moved within same county (%) - Black or African American
Geographical mobility - Moved within same county (%) - Asian
Geographical mobility - Moved within same county (%) - Hispanic or Latino
Geographical mobility - Moved within same county (%) - American Indian and Alaska Native
Geographical mobility - Moved within same county (%) - Multirace
Geographical mobility - Moved within same county (%) - Other Race
Geographical mobility - Moved from different county within same state (%)
Geographical mobility - Moved from different county within same state (%) - White
Geographical mobility - Moved from different county within same state (%) - Black or African American
Geographical mobility - Moved from different county within same state (%) - Asian
Geographical mobility - Moved from different county within same state (%) - Hispanic or Latino
Geographical mobility - Moved from different county within same state (%) - American Indian and Alaska Native
Geographical mobility - Moved from different county within same state (%) - Multirace
Geographical mobility - Moved from different county within same state (%) - Other Race
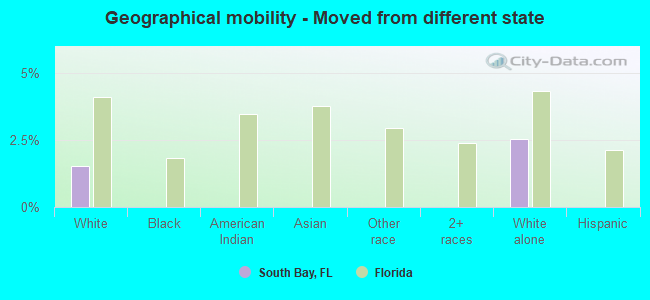
Geographical mobility - Moved from different state (%)
Geographical mobility - Moved from different state (%) - White
Geographical mobility - Moved from different state (%) - Black or African American
Geographical mobility - Moved from different state (%) - Asian
Geographical mobility - Moved from different state (%) - Hispanic or Latino
Geographical mobility - Moved from different state (%) - American Indian and Alaska Native
Geographical mobility - Moved from different state (%) - Multirace
Geographical mobility - Moved from different state (%) - Other Race
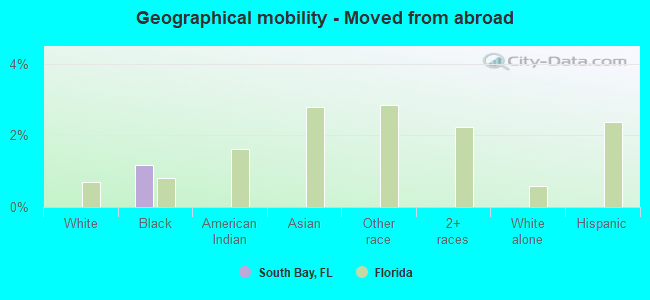
Geographical mobility - Moved from abroad (%)
Geographical mobility - Moved from abroad (%) - White
Geographical mobility - Moved from abroad (%) - Black or African American
Geographical mobility - Moved from abroad (%) - Asian
Geographical mobility - Moved from abroad (%) - Hispanic or Latino
Geographical mobility - Moved from abroad (%) - American Indian and Alaska Native
Geographical mobility - Moved from abroad (%) - Multirace
Geographical mobility - Moved from abroad (%) - Other Race
Place of birth for the foreign-born population - Ireland (%)
Place of birth for the foreign-born population - Denmark (%)
Place of birth for the foreign-born population - Norway (%)
Place of birth for the foreign-born population - Sweden (%)
Place of birth for the foreign-born population - United Kingdom (%)
Place of birth for the foreign-born population - England (%)
Place of birth for the foreign-born population - Scotland (%)
Place of birth for the foreign-born population - Other Northern Europe (%)
Place of birth for the foreign-born population - Austria (%)
Place of birth for the foreign-born population - Belgium (%)
Place of birth for the foreign-born population - France (%)
Place of birth for the foreign-born population - Germany (%)
Place of birth for the foreign-born population - Netherlands (%)
Place of birth for the foreign-born population - Switzerland (%)
Place of birth for the foreign-born population - Other Western Europe (%)
Place of birth for the foreign-born population - Greece (%)
Place of birth for the foreign-born population - Italy (%)
Place of birth for the foreign-born population - Portugal (%)
Place of birth for the foreign-born population - Spain (%)
Place of birth for the foreign-born population - Other Southern Europe (%)
Place of birth for the foreign-born population - Albania (%)
Place of birth for the foreign-born population - Belarus (%)
Place of birth for the foreign-born population - Bosnia and Herzegovina (%)
Place of birth for the foreign-born population - Bulgaria (%)
Place of birth for the foreign-born population - Croatia (%)
Place of birth for the foreign-born population - Czechoslovakia (%)
Place of birth for the foreign-born population - Hungary (%)
Place of birth for the foreign-born population - Latvia (%)
Place of birth for the foreign-born population - Lithuania (%)
Place of birth for the foreign-born population - North Macedonia (Macedonia) (%)
Place of birth for the foreign-born population - Moldova (%)
Place of birth for the foreign-born population - Poland (%)
Place of birth for the foreign-born population - Romania (%)
Place of birth for the foreign-born population - Russia (%)
Place of birth for the foreign-born population - Serbia (%)
Place of birth for the foreign-born population - Ukraine (%)
Place of birth for the foreign-born population - Other Eastern Europe (%)
Place of birth for the foreign-born population - China (%)
Place of birth for the foreign-born population - Hong Kong (%)
Place of birth for the foreign-born population - Taiwan (%)
Place of birth for the foreign-born population - Japan (%)
Place of birth for the foreign-born population - Korea (%)
Place of birth for the foreign-born population - Other Eastern Asia (%)
Place of birth for the foreign-born population - Afghanistan (%)
Place of birth for the foreign-born population - Bangladesh (%)
Place of birth for the foreign-born population - India (%)
Place of birth for the foreign-born population - Iran (%)
Place of birth for the foreign-born population - Kazakhstan (%)
Place of birth for the foreign-born population - Nepal (%)
Place of birth for the foreign-born population - Pakistan (%)
Place of birth for the foreign-born population - Sri Lanka (%)
Place of birth for the foreign-born population - Uzbekistan (%)
Place of birth for the foreign-born population - Other South Central Asia (%)
Place of birth for the foreign-born population - Burma (%)
Place of birth for the foreign-born population - Cambodia (%)
Place of birth for the foreign-born population - Indonesia (%)
Place of birth for the foreign-born population - Laos (%)
Place of birth for the foreign-born population - Malaysia (%)
Place of birth for the foreign-born population - Philippines (%)
Place of birth for the foreign-born population - Singapore (%)
Place of birth for the foreign-born population - Thailand (%)
Place of birth for the foreign-born population - Vietnam (%)
Place of birth for the foreign-born population - Other South Eastern Asia (%)
Place of birth for the foreign-born population - Armenia (%)
Place of birth for the foreign-born population - Iraq (%)
Place of birth for the foreign-born population - Israel (%)
Place of birth for the foreign-born population - Jordan (%)
Place of birth for the foreign-born population - Kuwait (%)
Place of birth for the foreign-born population - Lebanon (%)
Place of birth for the foreign-born population - Saudi Arabia (%)
Place of birth for the foreign-born population - Syria (%)
Place of birth for the foreign-born population - Turkey (%)
Place of birth for the foreign-born population - Yemen (%)
Place of birth for the foreign-born population - Other Western Asia (%)
Place of birth for the foreign-born population - Eritrea (%)
Place of birth for the foreign-born population - Ethiopia (%)
Place of birth for the foreign-born population - Kenya (%)
Place of birth for the foreign-born population - Somalia (%)
Place of birth for the foreign-born population - Uganda (%)
Place of birth for the foreign-born population - Zimbabwe (%)
Place of birth for the foreign-born population - Other Eastern Africa (%)
Place of birth for the foreign-born population - Cameroon (%)
Place of birth for the foreign-born population - Congo (%)
Place of birth for the foreign-born population - Democratic Republic of Congo (Zaire) (%)
Place of birth for the foreign-born population - Other Middle Africa (%)
Place of birth for the foreign-born population - Egypt (%)
Place of birth for the foreign-born population - Morocco (%)
Place of birth for the foreign-born population - Sudan (%)
Place of birth for the foreign-born population - Other Northern Africa (%)
Place of birth for the foreign-born population - South Africa (%)
Place of birth for the foreign-born population - Other Southern Africa (%)
Place of birth for the foreign-born population - Cabo Verde (%)
Place of birth for the foreign-born population - Ghana (%)
Place of birth for the foreign-born population - Liberia (%)
Place of birth for the foreign-born population - Nigeria (%)
Place of birth for the foreign-born population - Senegal (%)
Place of birth for the foreign-born population - Sierra Leone (%)
Place of birth for the foreign-born population - Other Western Africa (%)
Place of birth for the foreign-born population - Australia (%)
Place of birth for the foreign-born population - New Zealand (%)
Place of birth for the foreign-born population - Fiji (%)
Place of birth for the foreign-born population - Micronesia (%)
Place of birth for the foreign-born population - Bahamas (%)
Place of birth for the foreign-born population - Barbados (%)
Place of birth for the foreign-born population - Cuba (%)
Place of birth for the foreign-born population - Dominica (%)
Place of birth for the foreign-born population - Dominican Republic (%)
Place of birth for the foreign-born population - Grenada (%)
Place of birth for the foreign-born population - Haiti (%)
Place of birth for the foreign-born population - Jamaica (%)
Place of birth for the foreign-born population - St. Vincent and the Grenadines (%)
Place of birth for the foreign-born population - Trinidad and Tobago (%)
Place of birth for the foreign-born population - West Indies (%)
Place of birth for the foreign-born population - Other Caribbean (%)
Place of birth for the foreign-born population - Belize (%)
Place of birth for the foreign-born population - Costa Rica (%)
Place of birth for the foreign-born population - El Salvador (%)
Place of birth for the foreign-born population - Guatemala (%)
Place of birth for the foreign-born population - Honduras (%)
Place of birth for the foreign-born population - Mexico (%)
Place of birth for the foreign-born population - Nicaragua (%)
Place of birth for the foreign-born population - Panama (%)
Place of birth for the foreign-born population - Other Central America (%)
Place of birth for the foreign-born population - Argentina (%)
Place of birth for the foreign-born population - Bolivia (%)
Place of birth for the foreign-born population - Brazil (%)
Place of birth for the foreign-born population - Chile (%)
Place of birth for the foreign-born population - Colombia (%)
Place of birth for the foreign-born population - Ecuador (%)
Place of birth for the foreign-born population - Guyana (%)
Place of birth for the foreign-born population - Peru (%)
Place of birth for the foreign-born population - Uruguay (%)
Place of birth for the foreign-born population - Venezuela (%)
Place of birth for the foreign-born population - Other South America (%)
Place of birth for the foreign-born population - Canada (%)
Place of birth for the foreign-born population - Other Northern America (%)
Place of birth for the foreign-born population - Other (%)
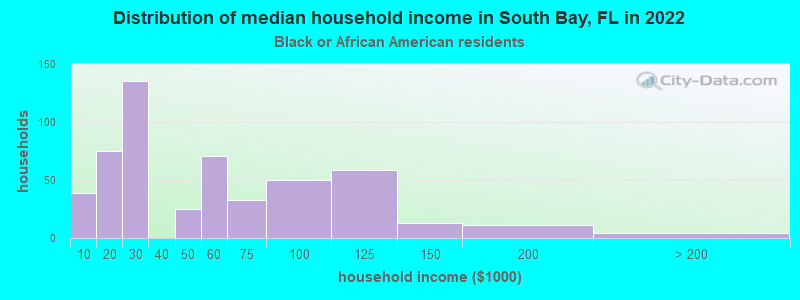
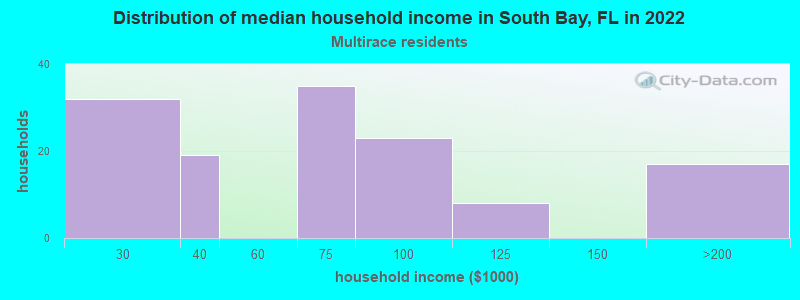
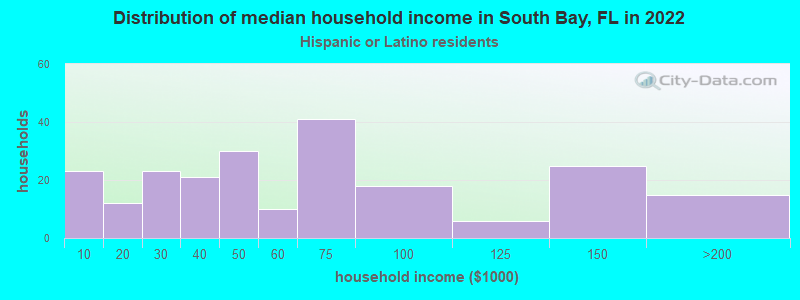
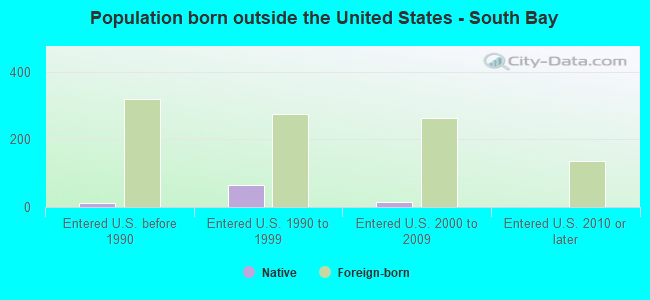
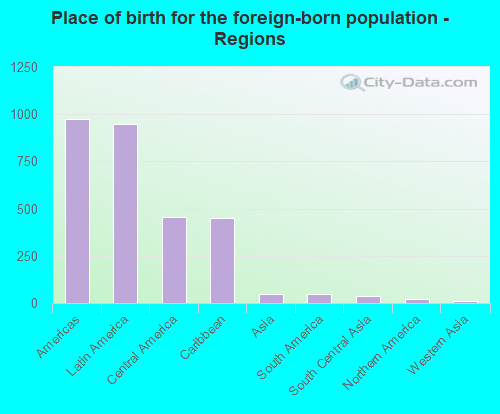
According to 2022 data, the most numerous races in South Bay, FL are White alone (703 residents), Hispanic (1,228 residents), and Black alone (2,781 residents). 73.0% of South Bay residents speak English at home. 20.9% of South Bay, FL residents are foreign-born (19.0% born in Latin America), which is about the same as the foreign-born rate of 21.0% across the entire state of Florida.
Race distribution in South Bay
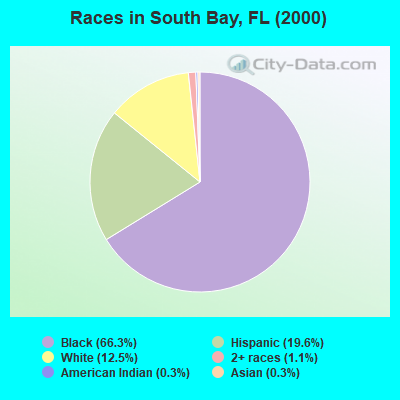
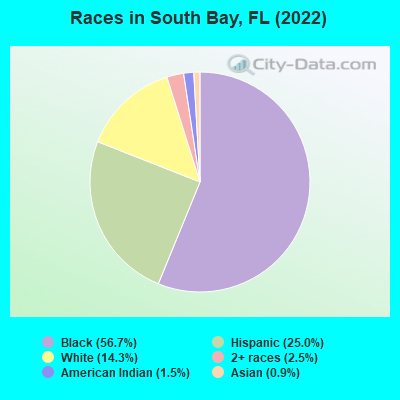
2000 2022
10,458,509 65.4% White alone 2,682,715 16.8% Hispanic 2,264,268 14.2% Black alone 261,693 1.6% Asian alone 236,954 1.5% Two or more races 42,358 0.3% American Indian alone 28,994 0.2% Other race alone 6,887 0.04% Native Hawaiian and Other
11,309,403 50.8% White alone 6,025,039 27.1% Hispanic 3,241,015 14.6% Black alone 861,630 3.9% Two or more races 623,692 2.8% Asian alone 152,054 0.7% Other race alone 22,504 0.1% American Indian alone 9,486 0.04% Native Hawaiian and Other
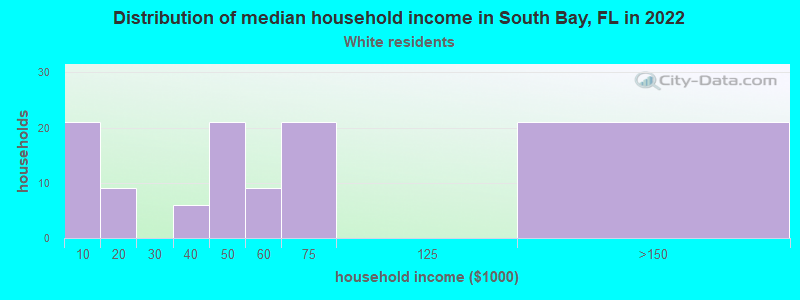
Income and house value in South Bay Median household income in 2022 $44,422 Black householders$62,019 Two or more races householders$54,532 Hispanic or Latino race householdersMedian 2022 house value $117,023 White Non-Hispanic householders$153,014 Black or African American householders$96,980 American Indian or Alaska Native householders$161,634 Some other race householders$167,022 Two or more races householders$118,531 Hispanic or Latino householders
Median age by race in South Bay
43.8 Median age for White residents45.6 29.3 42.4 Median age for Black or African American residents42.5 36.7 46.1 Median age for American Indian / Alaska Native residents51.3 -660,098,521.5 45.1 Median age for Asian residents47.6 23.8 -674,285,713.6 Median age for Native Hawaiian / Pacific Islander residents-674,264,006.9 -672,397,325.0 38.7 Median age for Other race residents40.6 3.7 38.2 Median age for Two or more races residents37.5 38.5 43.7 Median age for White alone residents43.5 67.0 36.6 Median age for Hispanic or Latino residents37.7 32.0
Owner/renter occupied households by race in South Bay
House owners and renters - White residents 96 85.0% Owner occupied17 15.0% Renter occupiedHouse owners and renters - Black or African American residents 298 57.7% Owner occupied218 42.3% Renter occupiedHouse owners and renters - Asian residents 6 100.0% Renter occupiedHouse owners and renters - Other race residents 5 100.0% Owner occupiedHouse owners and renters - Two or more races residents 51 36.3% Owner occupied90 63.7% Renter occupiedHouse owners and renters - White alone residents 12 100.0% Owner occupiedHouse owners and renters - Hispanic or Latino residents 138 61.8% Owner occupied85 38.2% Renter occupied
Language usage in South Bay
English speakers - Total 73.0% of residents of South Bay speak English at home.
21.6% of residents speak Spanish at home 484 47.2% Speak English very well541 52.8% Speak English less than very well5.4% of residents speak other language at home 111 43.5% Speak English very well144 56.5% Speak English less than very well
English speakers - Born in the United States 87.4% of residents of South Bay speak English at home.
9.4% of residents speak Spanish at home 97 87.4% Speak English very well14 12.6% Speak English less than very well2.9% of residents speak other language at home 34 100.0% Speak English very well
English speakers - Native, born elsewhere 13.7% of residents of South Bay speak English at home.
62.7% of residents speak Spanish at home 48 75.0% Speak English very well16 25.0% Speak English less than very well14.7% of residents speak other language at home 15 100.0% Speak English very well
English speakers - Foreign-born 27.0% of residents of South Bay speak English at home.
54.3% of residents speak Spanish at home 122 22.3% Speak English very well425 77.7% Speak English less than very well18.5% of residents speak other language at home 51 27.4% Speak English very well135 72.6% Speak English less than very well
White (Caucasian) - Speak only English Native:
77.4% (694)Foreign-born:
15.1% (24)
White (Caucasian) - Speak another language Native:
16.2% (146)Foreign-born:
76.5% (124)
Black or African American - Speak only English Native:
95.9% (2,184)Foreign-born:
60.6% (227)
Black or African American - Speak another language Native:
3.3% (76)Foreign-born:
36.9% (138)
Asian - Speak another language Native:
88.1% (4)Foreign-born:
99.2% (29)
Other race - Speak another language Native:
97.7% (48)Foreign-born:
100.0% (8)
Two or more races - Speak only English Native:
44.4% (205)Foreign-born:
4.0% (19)
Two or more races - Speak another language Native:
56.5% (260)Foreign-born:
96.7% (455)
White alone - Speak only English Native:
99.4% (671)Foreign-born:
65.9% (21)
White alone - Speak another language Native:
1.0% (7)Foreign-born:
37.1% (12)
Hispanic or Latino - Speak only English Native:
18.9% (112)Foreign-born:
1.6% (9)
Hispanic or Latino - Speak another language Native:
80.5% (475)Foreign-born:
98.5% (552)
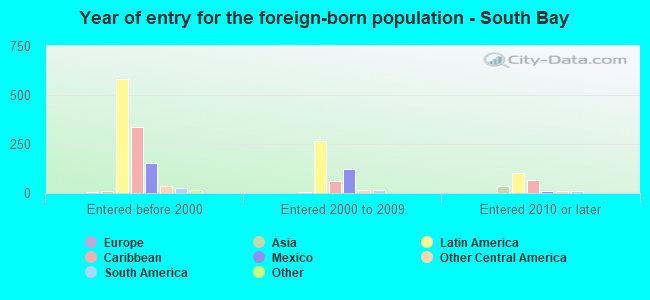
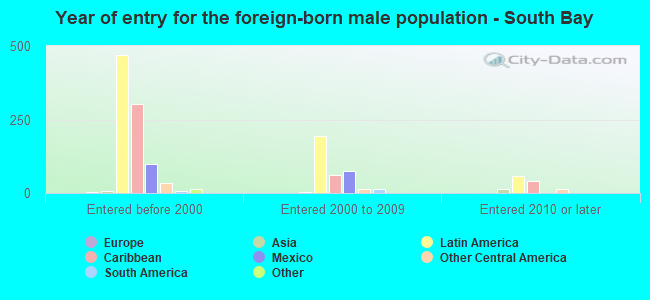
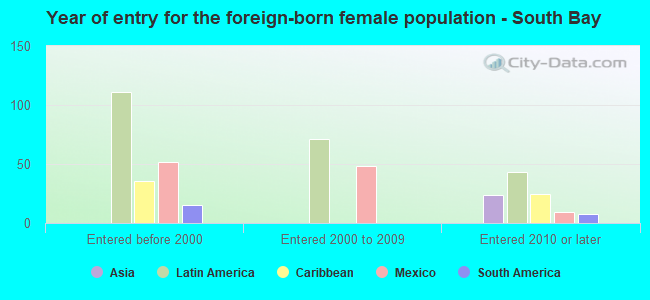
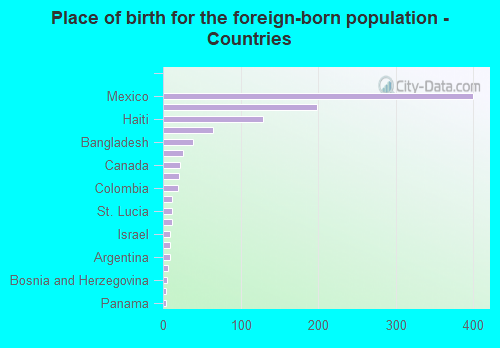
Foreign-born residents in South Bay 1,027 residents are foreign born (19.0% Latin America ).
This city:
20.9%Florida:
21.1%
Marital status for residents in South Bay Marital status - White (Caucasian) population 15 years and over
Males 49.8% Never married26.6% Now married2.5% Separated3.3% Widowed17.7% DivorcedFemales 35.9% Never married44.2% Now married5.0% Separated0.0% Widowed14.9% DivorcedWomen who gave birth in the past 12 months Now married:
100.0% (3)Unmarried:
0.0% (0)
Women who did not give birth in the past 12 months Now married:
43.2% (40)Unmarried:
56.8% (52)
Marital status - Black or African American population 15 years and over
Males 63.0% Never married22.5% Now married1.1% Separated2.1% Widowed11.4% DivorcedFemales 36.5% Never married32.8% Now married13.6% Separated11.2% Widowed5.9% DivorcedWomen who gave birth in the past 12 months Now married:
0.0% (0)Unmarried:
100.0% (5)
Women who did not give birth in the past 12 months Now married:
46.9% (151)Unmarried:
53.1% (171)
Marital status - Asian population 15 years and over
Males 0.0% Never married100.0% Now married0.0% Separated0.0% Widowed0.0% DivorcedFemales 0.0% Never married100.0% Now married0.0% Separated0.0% Widowed0.0% DivorcedWomen who did not give birth in the past 12 months Now married:
100.0% (5)Unmarried:
0.0% (0)
Marital status - Other race population 15 years and over
Males 16.7% Never married10.0% Now married0.0% Separated0.0% Widowed73.3% DivorcedFemales 60.0% Never married40.0% Now married0.0% Separated0.0% Widowed0.0% DivorcedWomen who did not give birth in the past 12 months Now married:
40.0% (3)Unmarried:
60.0% (5)
Marital status - Two or more races population 15 years and over
Males 59.4% Never married15.6% Now married4.4% Separated0.0% Widowed20.6% DivorcedFemales 48.6% Never married32.4% Now married0.0% Separated0.0% Widowed19.0% DivorcedWomen who did not give birth in the past 12 months Now married:
18.1% (18)Unmarried:
81.9% (82)
Marital status - White alone, not Hispanic / Latino population 15 years and over
Males 54.7% Never married20.0% Now married1.9% Separated3.6% Widowed19.9% DivorcedFemales 33.3% Never married0.0% Now married0.0% Separated0.0% Widowed66.7% DivorcedWomen who did not give birth in the past 12 months Now married:
0.0% (0)Unmarried:
100.0% (4)
Marital status - Hispanic or Latino population 15 years and over
Males 53.1% Never married25.4% Now married4.1% Separated1.1% Widowed16.3% DivorcedFemales 41.4% Never married42.5% Now married3.3% Separated0.0% Widowed12.8% DivorcedWomen who gave birth in the past 12 months Now married:
100.0% (4)Unmarried:
0.0% (0)
Women who did not give birth in the past 12 months Now married:
34.2% (65)Unmarried:
65.8% (125)
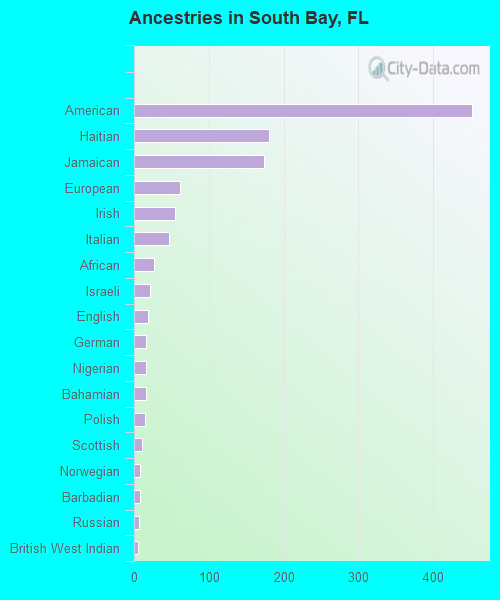
Ancestries in South Bay
452 11.9% American180 4.7% Haitian174 4.6% Jamaican62 1.6% European55 1.4% Irish47 1.2% Italian27 0.7% African21 0.6% Israeli19 0.5% English16 0.4% German16 0.4% Nigerian16 0.4% Bahamian15 0.4% Polish11 0.3% Scottish8 0.2% Norwegian8 0.2% Barbadian7 0.2% Russian5 0.1% British West Indian4 0.1% Yugoslavian3 0.08% Brazilian2 0.05% Dutch
Children Nativity (place of birth) in South Bay
Children under 6 years - Living with two parents Both parents native 30 99.3% Native0 0.7% Foreign-bornBoth parents foreign-born 51 80.2% Native13 19.8% Foreign-bornOne native, one foreign-born parent 13 100.0% NativeChildren under 6 years - Living with one parent Native parent 17 100.0% NativeForeign-born parent 30 76.9% Native9 23.1% Foreign-bornChildren 6 to 17 years - Living with two parents Both parents native 109 100.0% NativeBoth parents foreign-born 43 100.0% NativeOne native, one foreign-born parent 13 100.0% NativeChildren 6 to 17 years - Living with one parent Native parent 161 100.0% NativeForeign-born parent 103 50.8% Native100 49.2% Foreign-born
Grandparents responsible for own grandchildren in South Bay
Grandparents (30 to 59 years) White / Caucasian 1 100.0% Not responsible for grandchildrenBlack or African American 3 100.0% Responsible for grandchildrenAsian 13 100.0% Not responsible for grandchildrenHispanic or Latino 2 100.0% Not responsible for grandchildrenGrandparents (60 years and over) Black or African American 20 38.6% Responsible for grandchildren31 61.4% Not responsible for grandchildrenAsian 9 100.0% Not responsible for grandchildrenHispanic or Latino 13 100.0% Not responsible for grandchildren