Races in South Flat, Wyoming (WY) Detailed Stats
Ancestries, Foreign-born residents, place of birth

Discuss South Flat, Wyoming races on our local forum with over 2,400,000 registered users
4.8% of South Flat, WY residents are foreign-born (4.8% born in Latin America), which is 37.7% greater than the foreign-born rate of 3.0% across the entire state of Wyoming.
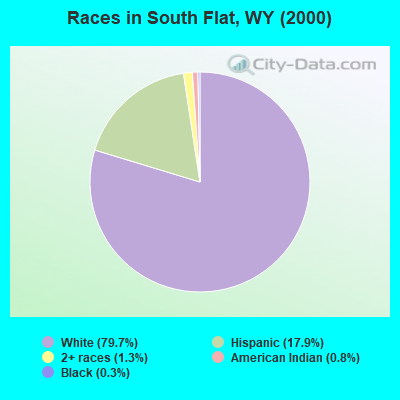
Race distribution in South Flat

- 29879.7%White alone
- 6717.9%Hispanic
- 51.3%Two or more races
- 30.8%American Indian alone
- 10.3%Black alone
2000
2022
-
- 438,79988.9%White alone
- 31,6696.4%Hispanic
- 10,2382.1%American Indian alone
- 6,1641.2%Two or more races
- 3,5040.7%Black alone
- 2,6700.5%Asian alone
- 4740.10%Other race alone
- 2640.05%Native Hawaiian and Other
Pacific Islander alone

-
- 473,22081.4%White alone
- 62,80310.8%Hispanic
- 22,9113.9%Two or more races
- 9,5891.6%American Indian alone
- 4,9970.9%Other race alone
- 3,9900.7%Black alone
- 3,5770.6%Asian alone
- 2940.05%Native Hawaiian and Other
Pacific Islander alone

Income and house value in South Flat
- Median household income in 2022
- $78,321White non-Hispanic householders
- $75,805Some other race householders
- $76,109Hispanic or Latino race householders
- Median 2022 house value
- $245,807White Non-Hispanic householders
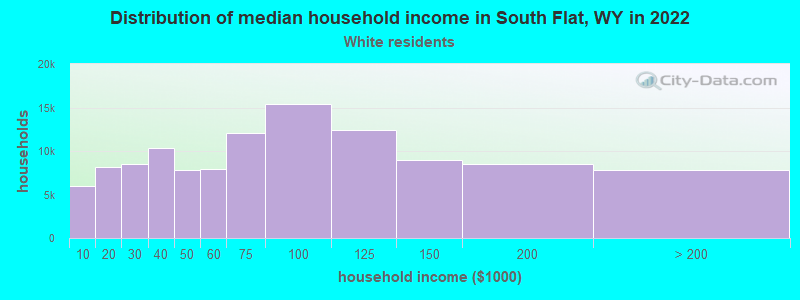
Household income for White non-Hispanic householders
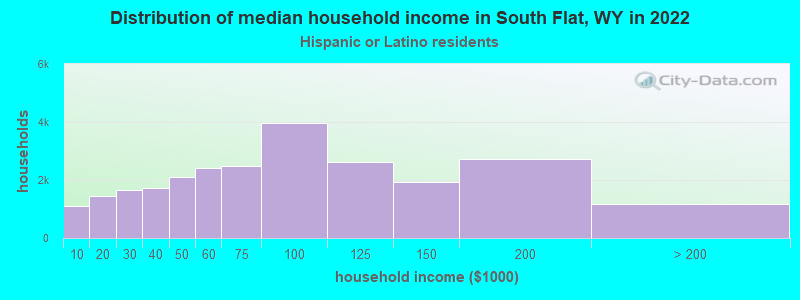
Household income for Hispanic or Latino race householders
Foreign-born residents in South Flat
18 residents are foreign born (4.8% Latin America).
| This city: | 4.8% |
| Wyoming: | 2.3% |
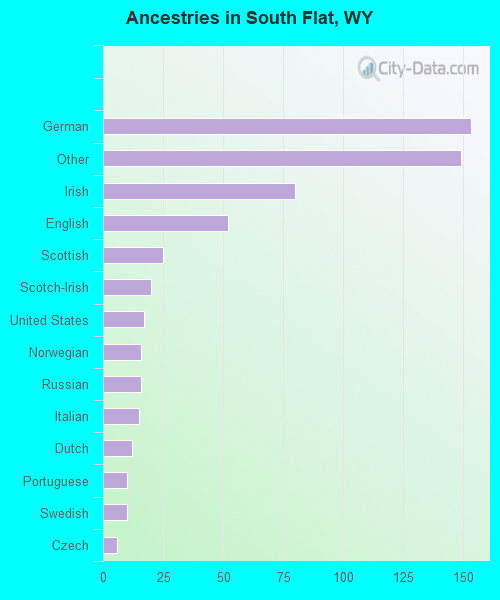
Ancestries in South Flat

- 15326.3%German
- 14925.6%Other
- 8013.8%Irish
- 529.0%English
- 254.3%Scottish
- 203.4%Scotch-Irish
- 172.9%United States
- 162.8%Norwegian
- 162.8%Russian
- 152.6%Italian
- 122.1%Dutch
- 101.7%Portuguese
- 101.7%Swedish
- 61.0%Czech
Zip codes: 82401.