Races in South River, New Jersey (NJ) Detailed Stats
Data:
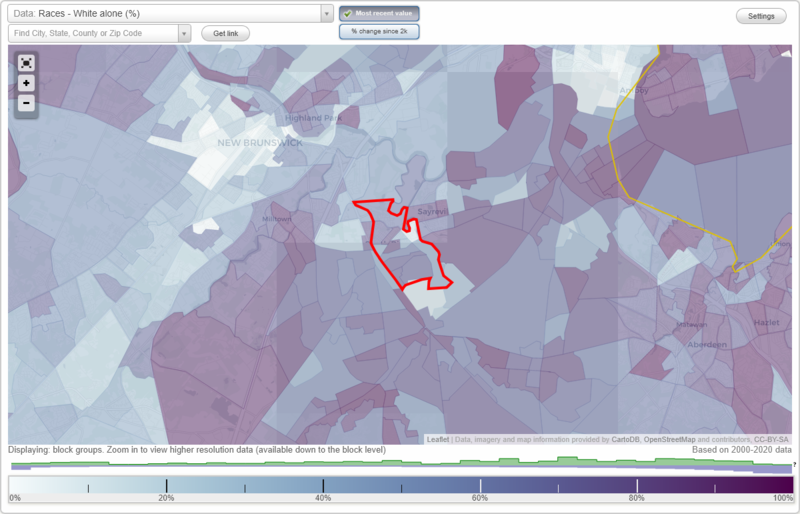
Races - White alone (%)
Races - White alone (% change since 2000)
Races - Black alone (%)
Races - Black alone (% change since 2000)
Races - American Indian alone (%)
Races - American Indian alone (% change since 2000)
Races - Asian alone (%)
Races - Asian alone (% change since 2000)
Races - Hispanic (%)
Races - Hispanic (% change since 2000)
Races - Native Hawaiian and Other Pacific Islander alone (%)
Races - Native Hawaiian and Other Pacific Islander alone (% change since 2000)
Races - Two or more races(%)
Races - Two or more races(% change since 2000)
Races - Other race alone (%)
Races - Other race alone (% change since 2000)
Racial diversity
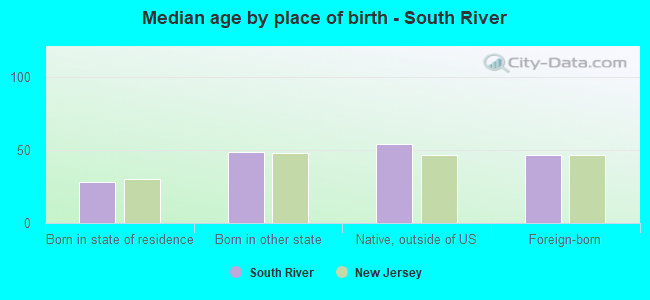
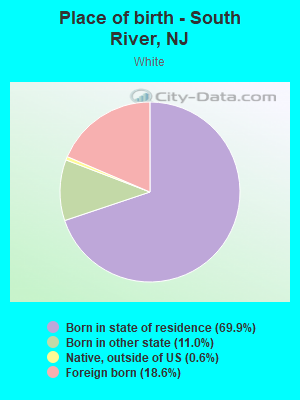
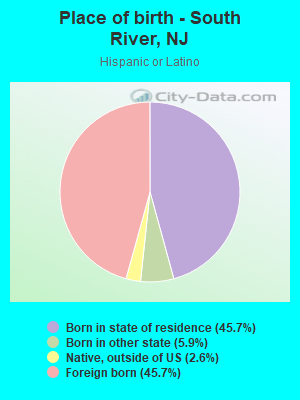
Place of birth - Born in state of residence (%)
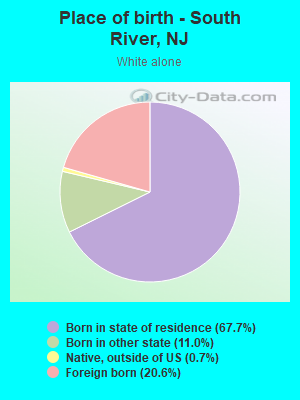
Place of birth - Born in state of residence (%) - White
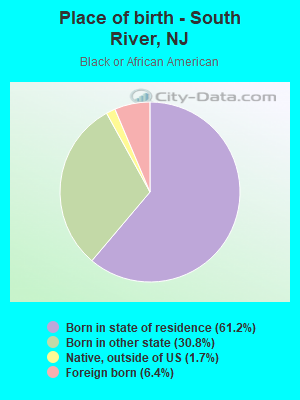
Place of birth - Born in state of residence (%) - Black or African American
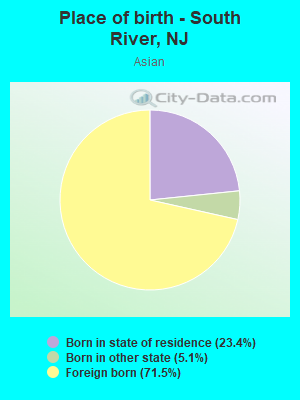
Place of birth - Born in state of residence (%) - Asian
Place of birth - Born in state of residence (%) - Hispanic or Latino
Place of birth - Born in state of residence (%) - American Indian and Alaska Native
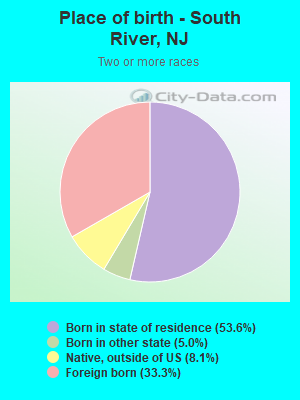
Place of birth - Born in state of residence (%) - Multirace
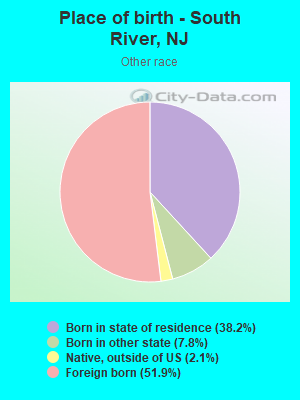
Place of birth - Born in state of residence (%) - Other Race
Place of birth - Born in other state (%)
Place of birth - Born in other state (%) - White
Place of birth - Born in other state (%) - Black or African American
Place of birth - Born in other state (%) - Asian
Place of birth - Born in other state (%) - Hispanic or Latino
Place of birth - Born in other state (%) - American Indian and Alaska Native
Place of birth - Born in other state (%) - Multirace
Place of birth - Born in other state (%) - Other Race
Place of birth - Native, outside of US (%)
Place of birth - Native, outside of US (%) - White
Place of birth - Native, outside of US (%) - Black or African American
Place of birth - Native, outside of US (%) - Asian
Place of birth - Native, outside of US (%) - Hispanic or Latino
Place of birth - Native, outside of US (%) - American Indian and Alaska Native
Place of birth - Native, outside of US (%) - Multirace
Place of birth - Native, outside of US (%) - Other Race
Place of birth - Foreign born (%)
Place of birth - Foreign born (%) - White
Place of birth - Foreign born (%) - Black or African American
Place of birth - Foreign born (%) - Asian
Place of birth - Foreign born (%) - Hispanic or Latino
Place of birth - Foreign born (%) - American Indian and Alaska Native
Place of birth - Foreign born (%) - Multirace
Place of birth - Foreign born (%) - Other Race
Residents speaking English at home (%)
Residents speaking English at home - Born in the United States (%)
Residents speaking English at home - Native, born elsewhere (%)
Residents speaking English at home - Foreign born (%)
Residents speaking Spanish at home (%)
Residents speaking Spanish at home - Born in the United States (%)
Residents speaking Spanish at home - Native, born elsewhere (%)
Residents speaking Spanish at home - Foreign born (%)
Residents speaking other language at home (%)
Residents speaking other language at home - Born in the United States (%)
Residents speaking other language at home - Native, born elsewhere (%)
Residents speaking other language at home - Foreign born (%)
Marital status - Never married (%)
Marital status - Now married (%)
Marital status - Separated (%)
Marital status - Widowed (%)
Marital status - Divorced (%)
Ancestries Reported - Arab (%)
Ancestries Reported - Czech (%)
Ancestries Reported - Danish (%)
Ancestries Reported - Dutch (%)
Ancestries Reported - English (%)
Ancestries Reported - French (%)
Ancestries Reported - French Canadian (%)
Ancestries Reported - German (%)
Ancestries Reported - Greek (%)
Ancestries Reported - Hungarian (%)
Ancestries Reported - Irish (%)
Ancestries Reported - Italian (%)
Ancestries Reported - Lithuanian (%)
Ancestries Reported - Norwegian (%)
Ancestries Reported - Polish (%)
Ancestries Reported - Portuguese (%)
Ancestries Reported - Russian (%)
Ancestries Reported - Scotch-Irish (%)
Ancestries Reported - Scottish (%)
Ancestries Reported - Slovak (%)
Ancestries Reported - Subsaharan African (%)
Ancestries Reported - Swedish (%)
Ancestries Reported - Swiss (%)
Ancestries Reported - Ukrainian (%)
Ancestries Reported - United States (%)
Ancestries Reported - Welsh (%)
Ancestries Reported - West Indian (%)
Ancestries Reported - Other (%)
Geographical mobility - Same house 1 year ago (%)
Geographical mobility - Same house 1 year ago (%) - White
Geographical mobility - Same house 1 year ago (%) - Black or African American
Geographical mobility - Same house 1 year ago (%) - Asian
Geographical mobility - Same house 1 year ago (%) - Hispanic or Latino
Geographical mobility - Same house 1 year ago (%) - American Indian and Alaska Native
Geographical mobility - Same house 1 year ago (%) - Multirace
Geographical mobility - Same house 1 year ago (%) - Other Race
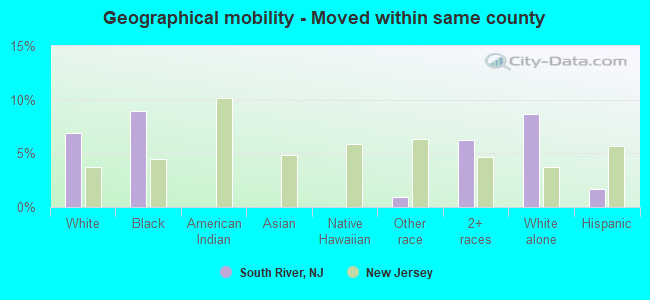
Geographical mobility - Moved within same county (%)
Geographical mobility - Moved within same county (%) - White
Geographical mobility - Moved within same county (%) - Black or African American
Geographical mobility - Moved within same county (%) - Asian
Geographical mobility - Moved within same county (%) - Hispanic or Latino
Geographical mobility - Moved within same county (%) - American Indian and Alaska Native
Geographical mobility - Moved within same county (%) - Multirace
Geographical mobility - Moved within same county (%) - Other Race
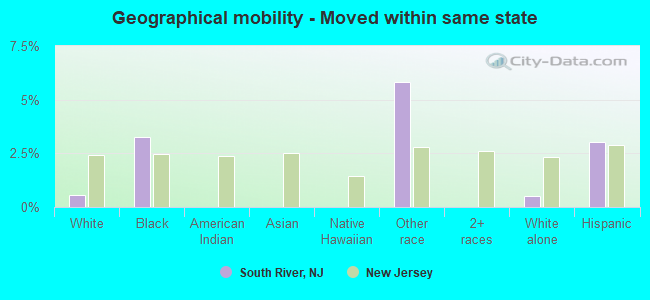
Geographical mobility - Moved from different county within same state (%)
Geographical mobility - Moved from different county within same state (%) - White
Geographical mobility - Moved from different county within same state (%) - Black or African American
Geographical mobility - Moved from different county within same state (%) - Asian
Geographical mobility - Moved from different county within same state (%) - Hispanic or Latino
Geographical mobility - Moved from different county within same state (%) - American Indian and Alaska Native
Geographical mobility - Moved from different county within same state (%) - Multirace
Geographical mobility - Moved from different county within same state (%) - Other Race
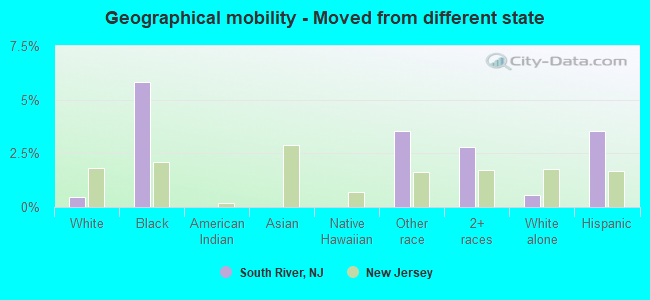
Geographical mobility - Moved from different state (%)
Geographical mobility - Moved from different state (%) - White
Geographical mobility - Moved from different state (%) - Black or African American
Geographical mobility - Moved from different state (%) - Asian
Geographical mobility - Moved from different state (%) - Hispanic or Latino
Geographical mobility - Moved from different state (%) - American Indian and Alaska Native
Geographical mobility - Moved from different state (%) - Multirace
Geographical mobility - Moved from different state (%) - Other Race
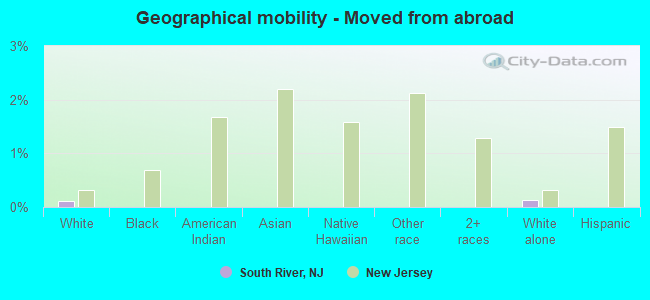
Geographical mobility - Moved from abroad (%)
Geographical mobility - Moved from abroad (%) - White
Geographical mobility - Moved from abroad (%) - Black or African American
Geographical mobility - Moved from abroad (%) - Asian
Geographical mobility - Moved from abroad (%) - Hispanic or Latino
Geographical mobility - Moved from abroad (%) - American Indian and Alaska Native
Geographical mobility - Moved from abroad (%) - Multirace
Geographical mobility - Moved from abroad (%) - Other Race
Place of birth for the foreign-born population - Ireland (%)
Place of birth for the foreign-born population - Denmark (%)
Place of birth for the foreign-born population - Norway (%)
Place of birth for the foreign-born population - Sweden (%)
Place of birth for the foreign-born population - United Kingdom (%)
Place of birth for the foreign-born population - England (%)
Place of birth for the foreign-born population - Scotland (%)
Place of birth for the foreign-born population - Other Northern Europe (%)
Place of birth for the foreign-born population - Austria (%)
Place of birth for the foreign-born population - Belgium (%)
Place of birth for the foreign-born population - France (%)
Place of birth for the foreign-born population - Germany (%)
Place of birth for the foreign-born population - Netherlands (%)
Place of birth for the foreign-born population - Switzerland (%)
Place of birth for the foreign-born population - Other Western Europe (%)
Place of birth for the foreign-born population - Greece (%)
Place of birth for the foreign-born population - Italy (%)
Place of birth for the foreign-born population - Portugal (%)
Place of birth for the foreign-born population - Spain (%)
Place of birth for the foreign-born population - Other Southern Europe (%)
Place of birth for the foreign-born population - Albania (%)
Place of birth for the foreign-born population - Belarus (%)
Place of birth for the foreign-born population - Bosnia and Herzegovina (%)
Place of birth for the foreign-born population - Bulgaria (%)
Place of birth for the foreign-born population - Croatia (%)
Place of birth for the foreign-born population - Czechoslovakia (%)
Place of birth for the foreign-born population - Hungary (%)
Place of birth for the foreign-born population - Latvia (%)
Place of birth for the foreign-born population - Lithuania (%)
Place of birth for the foreign-born population - North Macedonia (Macedonia) (%)
Place of birth for the foreign-born population - Moldova (%)
Place of birth for the foreign-born population - Poland (%)
Place of birth for the foreign-born population - Romania (%)
Place of birth for the foreign-born population - Russia (%)
Place of birth for the foreign-born population - Serbia (%)
Place of birth for the foreign-born population - Ukraine (%)
Place of birth for the foreign-born population - Other Eastern Europe (%)
Place of birth for the foreign-born population - China (%)
Place of birth for the foreign-born population - Hong Kong (%)
Place of birth for the foreign-born population - Taiwan (%)
Place of birth for the foreign-born population - Japan (%)
Place of birth for the foreign-born population - Korea (%)
Place of birth for the foreign-born population - Other Eastern Asia (%)
Place of birth for the foreign-born population - Afghanistan (%)
Place of birth for the foreign-born population - Bangladesh (%)
Place of birth for the foreign-born population - India (%)
Place of birth for the foreign-born population - Iran (%)
Place of birth for the foreign-born population - Kazakhstan (%)
Place of birth for the foreign-born population - Nepal (%)
Place of birth for the foreign-born population - Pakistan (%)
Place of birth for the foreign-born population - Sri Lanka (%)
Place of birth for the foreign-born population - Uzbekistan (%)
Place of birth for the foreign-born population - Other South Central Asia (%)
Place of birth for the foreign-born population - Burma (%)
Place of birth for the foreign-born population - Cambodia (%)
Place of birth for the foreign-born population - Indonesia (%)
Place of birth for the foreign-born population - Laos (%)
Place of birth for the foreign-born population - Malaysia (%)
Place of birth for the foreign-born population - Philippines (%)
Place of birth for the foreign-born population - Singapore (%)
Place of birth for the foreign-born population - Thailand (%)
Place of birth for the foreign-born population - Vietnam (%)
Place of birth for the foreign-born population - Other South Eastern Asia (%)
Place of birth for the foreign-born population - Armenia (%)
Place of birth for the foreign-born population - Iraq (%)
Place of birth for the foreign-born population - Israel (%)
Place of birth for the foreign-born population - Jordan (%)
Place of birth for the foreign-born population - Kuwait (%)
Place of birth for the foreign-born population - Lebanon (%)
Place of birth for the foreign-born population - Saudi Arabia (%)
Place of birth for the foreign-born population - Syria (%)
Place of birth for the foreign-born population - Turkey (%)
Place of birth for the foreign-born population - Yemen (%)
Place of birth for the foreign-born population - Other Western Asia (%)
Place of birth for the foreign-born population - Eritrea (%)
Place of birth for the foreign-born population - Ethiopia (%)
Place of birth for the foreign-born population - Kenya (%)
Place of birth for the foreign-born population - Somalia (%)
Place of birth for the foreign-born population - Uganda (%)
Place of birth for the foreign-born population - Zimbabwe (%)
Place of birth for the foreign-born population - Other Eastern Africa (%)
Place of birth for the foreign-born population - Cameroon (%)
Place of birth for the foreign-born population - Congo (%)
Place of birth for the foreign-born population - Democratic Republic of Congo (Zaire) (%)
Place of birth for the foreign-born population - Other Middle Africa (%)
Place of birth for the foreign-born population - Egypt (%)
Place of birth for the foreign-born population - Morocco (%)
Place of birth for the foreign-born population - Sudan (%)
Place of birth for the foreign-born population - Other Northern Africa (%)
Place of birth for the foreign-born population - South Africa (%)
Place of birth for the foreign-born population - Other Southern Africa (%)
Place of birth for the foreign-born population - Cabo Verde (%)
Place of birth for the foreign-born population - Ghana (%)
Place of birth for the foreign-born population - Liberia (%)
Place of birth for the foreign-born population - Nigeria (%)
Place of birth for the foreign-born population - Senegal (%)
Place of birth for the foreign-born population - Sierra Leone (%)
Place of birth for the foreign-born population - Other Western Africa (%)
Place of birth for the foreign-born population - Australia (%)
Place of birth for the foreign-born population - New Zealand (%)
Place of birth for the foreign-born population - Fiji (%)
Place of birth for the foreign-born population - Micronesia (%)
Place of birth for the foreign-born population - Bahamas (%)
Place of birth for the foreign-born population - Barbados (%)
Place of birth for the foreign-born population - Cuba (%)
Place of birth for the foreign-born population - Dominica (%)
Place of birth for the foreign-born population - Dominican Republic (%)
Place of birth for the foreign-born population - Grenada (%)
Place of birth for the foreign-born population - Haiti (%)
Place of birth for the foreign-born population - Jamaica (%)
Place of birth for the foreign-born population - St. Vincent and the Grenadines (%)
Place of birth for the foreign-born population - Trinidad and Tobago (%)
Place of birth for the foreign-born population - West Indies (%)
Place of birth for the foreign-born population - Other Caribbean (%)
Place of birth for the foreign-born population - Belize (%)
Place of birth for the foreign-born population - Costa Rica (%)
Place of birth for the foreign-born population - El Salvador (%)
Place of birth for the foreign-born population - Guatemala (%)
Place of birth for the foreign-born population - Honduras (%)
Place of birth for the foreign-born population - Mexico (%)
Place of birth for the foreign-born population - Nicaragua (%)
Place of birth for the foreign-born population - Panama (%)
Place of birth for the foreign-born population - Other Central America (%)
Place of birth for the foreign-born population - Argentina (%)
Place of birth for the foreign-born population - Bolivia (%)
Place of birth for the foreign-born population - Brazil (%)
Place of birth for the foreign-born population - Chile (%)
Place of birth for the foreign-born population - Colombia (%)
Place of birth for the foreign-born population - Ecuador (%)
Place of birth for the foreign-born population - Guyana (%)
Place of birth for the foreign-born population - Peru (%)
Place of birth for the foreign-born population - Uruguay (%)
Place of birth for the foreign-born population - Venezuela (%)
Place of birth for the foreign-born population - Other South America (%)
Place of birth for the foreign-born population - Canada (%)
Place of birth for the foreign-born population - Other Northern America (%)
Place of birth for the foreign-born population - Other (%)
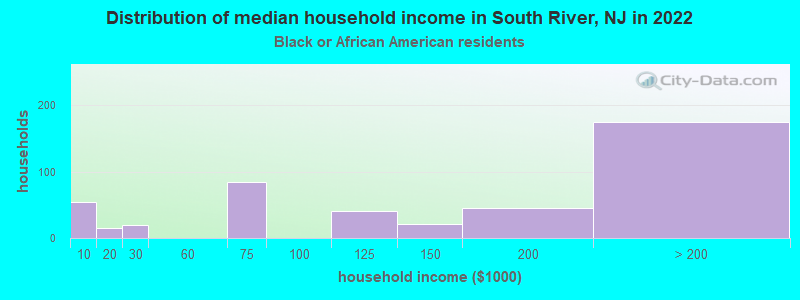
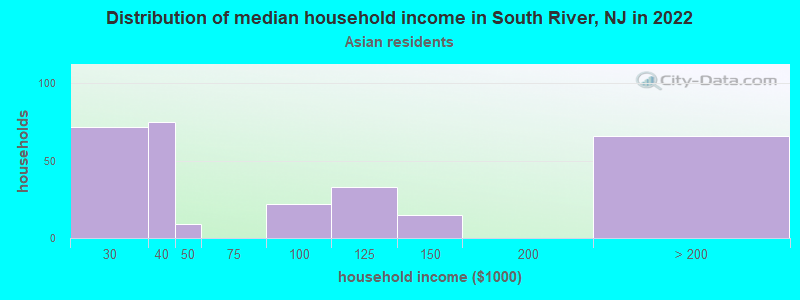
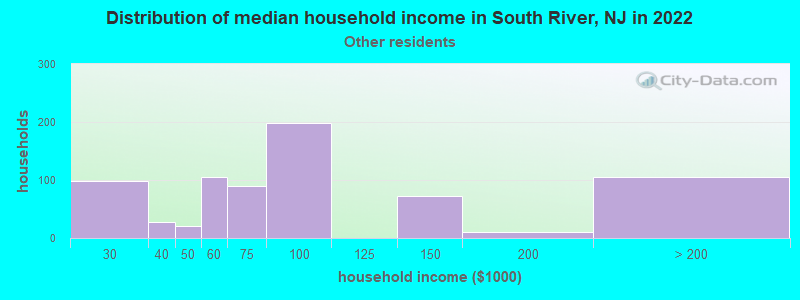
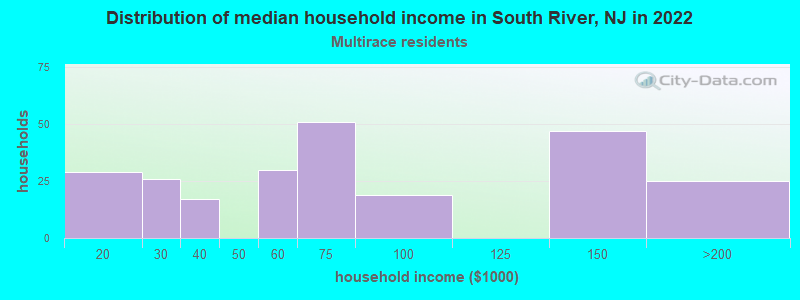
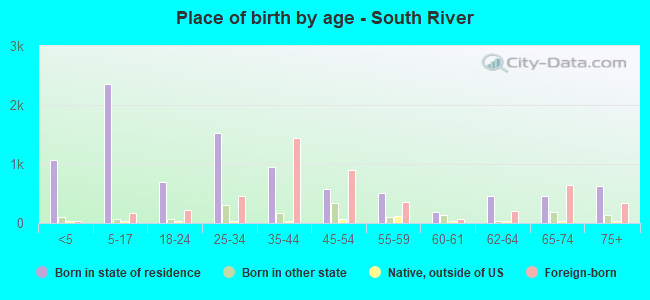
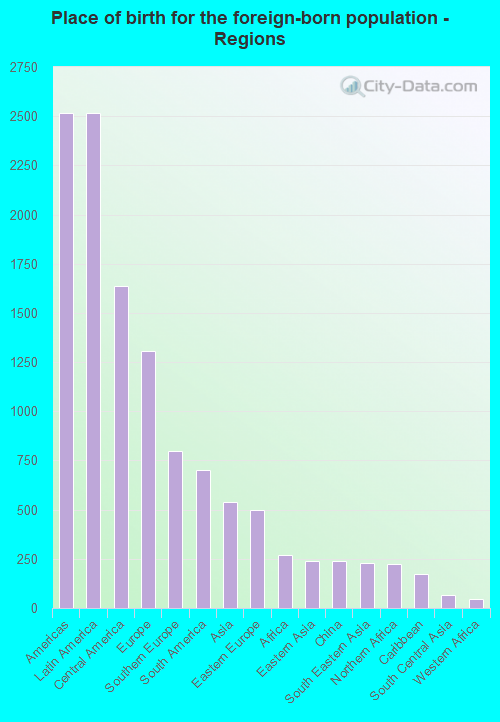
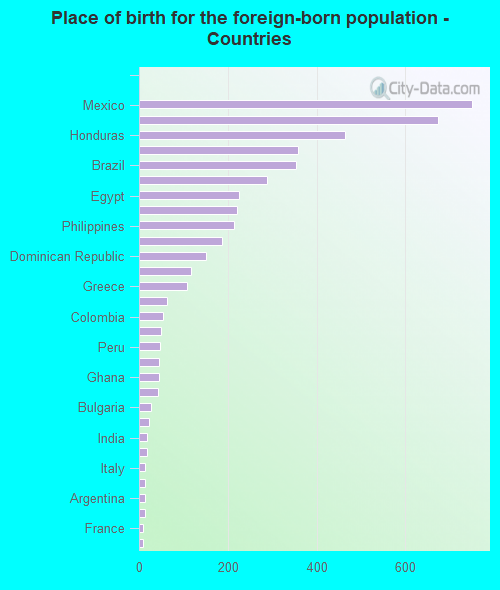
According to 2022 data, the most numerous races in South River, NJ are White alone (8,515 residents), Hispanic (5,028 residents), and Black alone (1,185 residents). 51.6% of South River residents speak English at home. 28.8% of South River, NJ residents are foreign-born (15.4% born in Latin America, 8.0% born in Europe, 3.3% born in Asia), which is 20.1% greater than the foreign-born rate of 23.0% across the entire state of New Jersey.
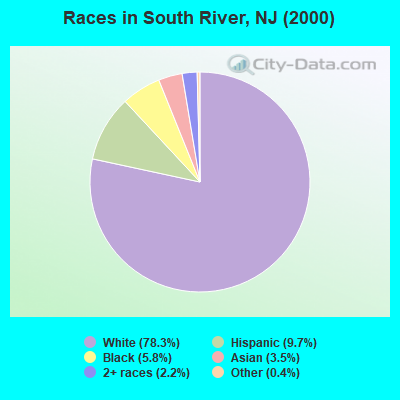
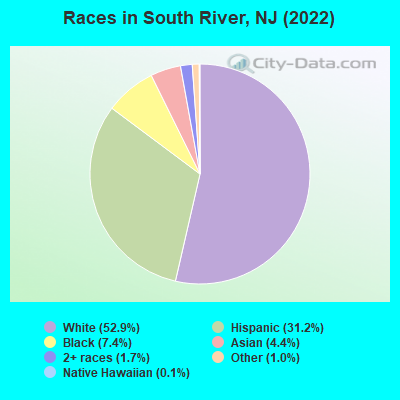
Race distribution in South River
2000 2022
5,557,209 66.0% White alone 1,117,191 13.3% Hispanic 1,096,171 13.0% Black alone 477,012 5.7% Asian alone 133,689 1.6% Two or more races 19,565 0.2% Other race alone 11,338 0.1% American Indian alone 2,175 0.03% Native Hawaiian and Other
4,766,476 51.5% White alone 2,028,470 21.9% Hispanic 1,111,632 12.0% Black alone 923,546 10.0% Asian alone 332,237 3.6% Two or more races 89,847 1.0% Other race alone 8,557 0.09% American Indian alone 934 0.01% Native Hawaiian and Other
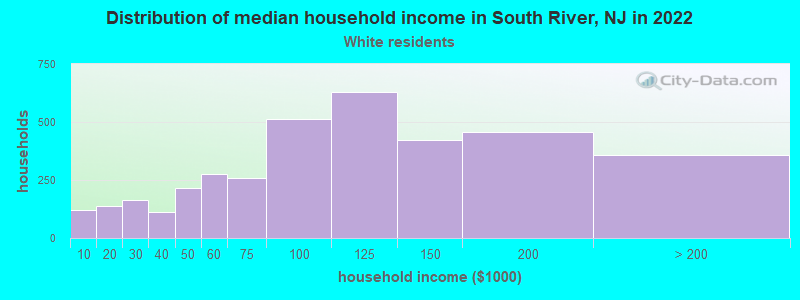
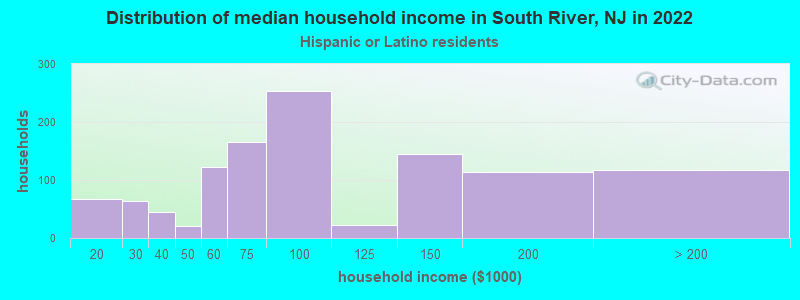
Income and house value in South River Median household income in 2022 $100,378 White non-Hispanic householders$154,346 Black householders$90,347 Some other race householders$53,803 Two or more races householders$91,501 Hispanic or Latino race householdersMedian 2022 house value $381,816 White Non-Hispanic householders$398,261 Black or African American householders$417,531 American Indian or Alaska Native householders $749,501 Asian householders$342,504 Some other race householders$409,566 Two or more races householders$357,407 Hispanic or Latino householders
Median age by race in South River
43.7 Median age for White residents41.0 48.9 35.3 Median age for Black or African American residents32.1 49.0 44.3 Median age for American Indian / Alaska Native residents43.4 48.3 63.5 Median age for Asian residents63.2 63.7 -939,393,938.5 Median age for Native Hawaiian / Pacific Islander residents-860,335,194.7 -713,070,378.3 24.6 Median age for Other race residents27.7 23.2 33.1 Median age for Two or more races residents24.7 38.2 45.8 Median age for White alone residents40.7 51.5 28.1 Median age for Hispanic or Latino residents32.2 23.3
Owner/renter occupied households by race in South River
House owners and renters - White residents 2,829 75.8% Owner occupied903 24.2% Renter occupiedHouse owners and renters - Black or African American residents 245 53.2% Owner occupied215 46.8% Renter occupiedHouse owners and renters - American Indian / Alaska Native residents 40 100.0% Owner occupiedHouse owners and renters - Asian residents 259 91.2% Owner occupied25 8.8% Renter occupiedHouse owners and renters - Other race residents 40 5.9% Owner occupied647 94.1% Renter occupiedHouse owners and renters - Two or more races residents 199 67.0% Owner occupied98 33.0% Renter occupiedHouse owners and renters - White alone residents 2,686 75.3% Owner occupied879 24.7% Renter occupiedHouse owners and renters - Hispanic or Latino residents 423 39.1% Owner occupied659 60.9% Renter occupied
Language usage in South River
English speakers - Total 51.6% of residents of South River speak English at home.
23.3% of residents speak Spanish at home 1,399 40.2% Speak English very well2,084 59.8% Speak English less than very well26.0% of residents speak other language at home 2,277 58.6% Speak English very well1,606 41.4% Speak English less than very well
English speakers - Born in the United States 80.9% of residents of South River speak English at home.
9.5% of residents speak Spanish at home 149 100.0% Speak English very well9.3% of residents speak other language at home 146 100.0% Speak English very well
English speakers - Native, born elsewhere 36.6% of residents of South River speak English at home.
51.9% of residents speak Spanish at home 115 91.3% Speak English very well11 8.7% Speak English less than very well9.5% of residents speak other language at home 23 100.0% Speak English less than very well
English speakers - Foreign-born 6.7% of residents of South River speak English at home.
49.6% of residents speak Spanish at home 482 20.3% Speak English very well1,891 79.7% Speak English less than very well47.0% of residents speak other language at home 1,033 46.0% Speak English very well1,213 54.0% Speak English less than very well
White (Caucasian) - Speak only English Native:
81.0% (5,406)Foreign-born:
9.2% (149)
White (Caucasian) - Speak another language Native:
14.3% (953)Foreign-born:
86.9% (1,416)
Black or African American - Speak only English Native:
94.9% (992)Foreign-born:
22.9% (17)
Black or African American - Speak another language Native:
5.4% (56)Foreign-born:
84.6% (64)
Asian - Speak only English Native:
58.4% (99)Foreign-born:
10.0% (54)
Asian - Speak another language Native:
41.1% (69)Foreign-born:
90.1% (486)
Other race - Speak another language Native:
75.3% (1,023)Foreign-born:
97.4% (1,824)
Two or more races - Speak only English Native:
68.9% (471)Foreign-born:
19.1% (81)
Two or more races - Speak another language Native:
30.7% (210)Foreign-born:
80.7% (343)
White alone - Speak only English Native:
80.2% (5,120)Foreign-born:
9.3% (163)
White alone - Speak another language Native:
15.9% (1,013)Foreign-born:
89.4% (1,558)
Hispanic or Latino - Speak only English Native:
47.9% (1,036)Foreign-born:
5.2% (121)
Hispanic or Latino - Speak another language Native:
53.2% (1,150)Foreign-born:
94.0% (2,191)
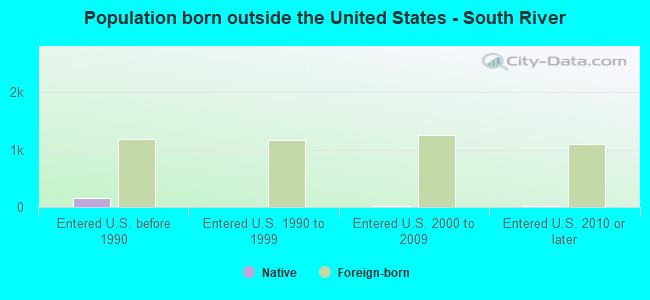
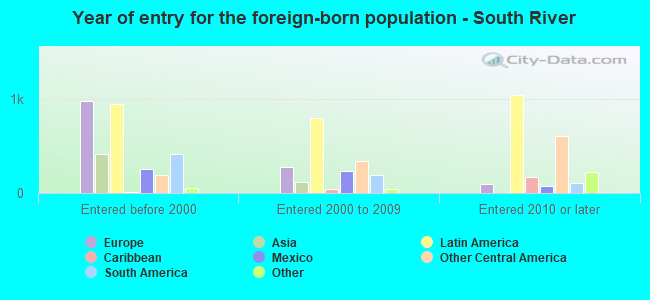
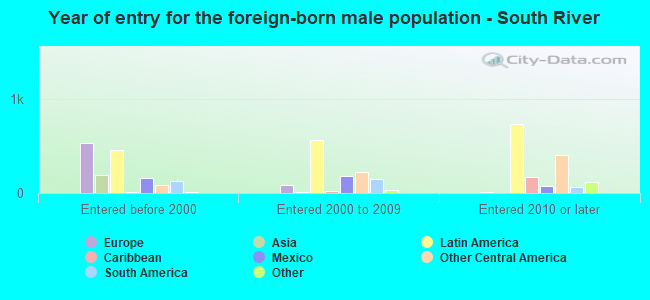
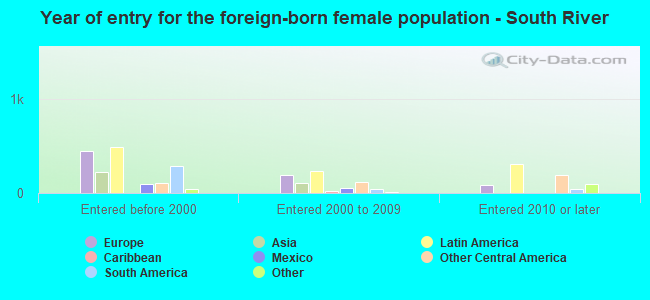
Foreign-born residents in South River 4,637 residents are foreign born (15.4% Latin America , 8.0% Europe , 3.3% Asia ).
This city:
28.8%New Jersey:
23.2%
Marital status for residents in South River Marital status - White (Caucasian) population 15 years and over
Males 39.1% Never married53.6% Now married0.4% Separated2.8% Widowed4.2% DivorcedFemales 22.7% Never married52.3% Now married1.2% Separated12.2% Widowed11.6% DivorcedWomen who gave birth in the past 12 months Now married:
44.0% (99)Unmarried:
56.0% (126)
Women who did not give birth in the past 12 months Now married:
40.2% (527)Unmarried:
59.8% (783)
Marital status - Black or African American population 15 years and over
Males 45.6% Never married46.8% Now married2.4% Separated0.0% Widowed5.2% DivorcedFemales 43.6% Never married36.9% Now married0.0% Separated13.0% Widowed6.5% DivorcedWomen who did not give birth in the past 12 months Now married:
16.3% (43)Unmarried:
83.7% (222)
Marital status - American Indian / Alaska Native population 15 years and over
Males 43.0% Never married26.6% Now married0.0% Separated0.0% Widowed30.4% DivorcedFemales 67.2% Never married32.8% Now married0.0% Separated0.0% Widowed0.0% DivorcedWomen who did not give birth in the past 12 months Now married:
0.0% (0)Unmarried:
100.0% (66)
Marital status - Asian population 15 years and over
Males 9.6% Never married85.4% Now married0.0% Separated0.0% Widowed5.0% DivorcedFemales 17.5% Never married54.3% Now married0.0% Separated16.6% Widowed11.6% DivorcedWomen who gave birth in the past 12 months Now married:
100.0% (7)Unmarried:
0.0% (0)
Women who did not give birth in the past 12 months Now married:
41.7% (54)Unmarried:
58.3% (76)
Marital status - Other race population 15 years and over
Males 68.0% Never married22.5% Now married1.8% Separated0.0% Widowed7.7% DivorcedFemales 55.6% Never married35.2% Now married5.9% Separated0.0% Widowed3.3% DivorcedWomen who gave birth in the past 12 months Now married:
45.5% (63)Unmarried:
54.5% (76)
Women who did not give birth in the past 12 months Now married:
38.6% (328)Unmarried:
61.4% (522)
Marital status - Two or more races population 15 years and over
Males 73.9% Never married26.1% Now married0.0% Separated0.0% Widowed0.0% DivorcedFemales 26.4% Never married52.0% Now married4.1% Separated0.0% Widowed17.5% DivorcedWomen who gave birth in the past 12 months Now married:
100.0% (76)Unmarried:
0.0% (0)
Women who did not give birth in the past 12 months Now married:
46.3% (174)Unmarried:
53.7% (202)
Marital status - White alone, not Hispanic / Latino population 15 years and over
Males 36.9% Never married55.4% Now married0.4% Separated3.2% Widowed4.0% DivorcedFemales 21.7% Never married54.7% Now married1.4% Separated11.0% Widowed11.3% DivorcedWomen who gave birth in the past 12 months Now married:
36.1% (84)Unmarried:
63.9% (148)
Women who did not give birth in the past 12 months Now married:
47.3% (588)Unmarried:
52.7% (656)
Marital status - Hispanic or Latino population 15 years and over
Males 62.0% Never married29.5% Now married1.0% Separated0.0% Widowed7.5% DivorcedFemales 44.2% Never married36.8% Now married3.5% Separated6.7% Widowed8.8% DivorcedWomen who gave birth in the past 12 months Now married:
71.7% (144)Unmarried:
28.3% (57)
Women who did not give birth in the past 12 months Now married:
29.0% (339)Unmarried:
71.0% (833)
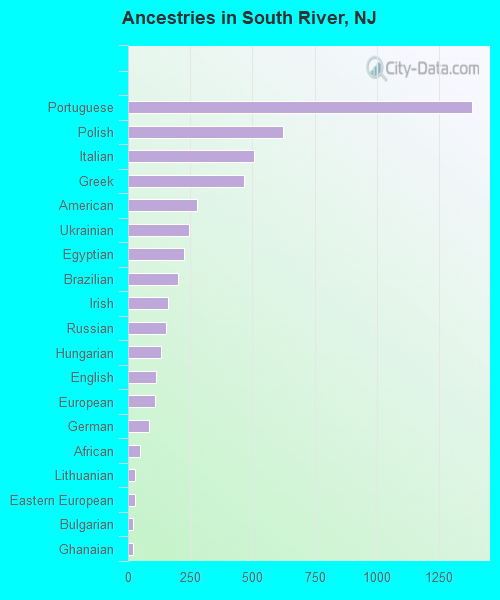
Ancestries in South River
1,382 15.7% Portuguese622 7.1% Polish507 5.8% Italian465 5.3% Greek279 3.2% American246 2.8% Ukrainian224 2.6% Egyptian199 2.3% Brazilian159 1.8% Irish153 1.7% Russian132 1.5% Hungarian113 1.3% English110 1.3% European84 1.0% German49 0.6% African30 0.3% Lithuanian29 0.3% Eastern European21 0.2% Bulgarian19 0.2% Ghanaian12 0.1% Palestinian10 0.1% Czech9 0.1% Syrian
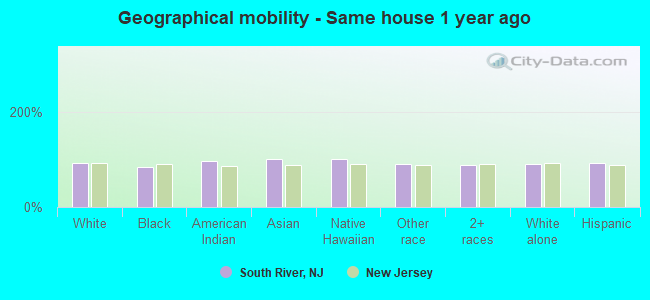
Geographical mobility in South River Same house 1 year ago 7,951 91.6% White (Caucasian)1,027 84.0% Black or African American204 96.6% American Indian / Alaska Native766 100.0% Asian20 100.0% Native Hawaiian / Pacific Islander3,139 90.7% Other race1,041 86.8% Two or more races7,436 89.8% White alone, not Hispanic / Latino4,431 92.3% Hispanic or LatinoMoved within same county 595 6.9% White / Caucasian109 8.9% Black or African American32 0.9% Other race75 6.2% Two or more races719 8.7% White alone, not Hispanic / Latino83 1.7% Hispanic or LatinoMoved within same state 51 0.6% White / Caucasian40 3.3% Black or African American201 5.8% Other race44 0.5% White alone, not Hispanic / Latino146 3.0% Hispanic or LatinoMoved from different state 38 0.4% White / Caucasian71 5.8% Black or African American122 3.5% Other race33 2.8% Two or more races45 0.5% White alone, not Hispanic / Latino171 3.6% Hispanic or LatinoMoved from abroad 10 0.1% White11 0.1% White alone, not Hispanic / Latino
Children Nativity (place of birth) in South River
Children under 6 years - Living with two parents Both parents native 341 100.0% NativeBoth parents foreign-born 178 100.0% NativeOne native, one foreign-born parent 188 100.0% NativeChildren under 6 years - Living with one parent Native parent 233 100.0% NativeForeign-born parent 323 100.0% NativeChildren 6 to 17 years - Living with two parents Both parents native 649 100.0% NativeBoth parents foreign-born 384 74.1% Native134 25.9% Foreign-bornOne native, one foreign-born parent 99 100.0% NativeChildren 6 to 17 years - Living with one parent Native parent 559 100.0% NativeForeign-born parent 542 53.4% Native472 46.6% Foreign-born
Grandparents responsible for own grandchildren in South River
Grandparents (30 to 59 years) White / Caucasian 7 35.1% Responsible for grandchildren13 64.9% Not responsible for grandchildrenOther race 52 100.0% Not responsible for grandchildrenTwo or more races 65 100.0% Responsible for grandchildrenWhite alone, not Hispanic / Latino 15 100.0% Not responsible for grandchildrenHispanic or Latino 63 56.8% Responsible for grandchildren48 43.2% Not responsible for grandchildrenGrandparents (60 years and over) White / Caucasian 16 34.8% Responsible for grandchildren29 65.2% Not responsible for grandchildrenWhite alone, not Hispanic / Latino 21 38.1% Responsible for grandchildren34 61.9% Not responsible for grandchildren