Races in Spider Lake, Wisconsin (WI) Detailed Stats
Ancestries, Foreign-born residents, place of birth
5.9% of Spider Lake, WI residents are foreign-born (3.1% born in Europe, 1.5% born in North America, 0.8% born in Africa), which is 15.0% greater than the foreign-born rate of 5.0% across the entire state of Wisconsin.
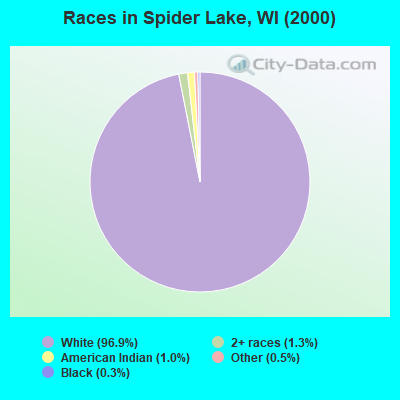
Race distribution in Spider Lake

- 37996.9%White alone
- 51.3%Two or more races
- 41.0%American Indian alone
- 20.5%Other race alone
- 10.3%Black alone
2000
2022
-
- 4,681,63087.3%White alone
- 300,2455.6%Black alone
- 192,9213.6%Hispanic
- 87,9951.6%Asian alone
- 51,9211.0%Two or more races
- 43,9800.8%American Indian alone
- 3,6370.07%Other race alone
- 1,3460.03%Native Hawaiian and Other
Pacific Islander alone

-
- 4,654,03179.0%White alone
- 447,0227.6%Hispanic
- 345,6785.9%Black alone
- 217,5323.7%Two or more races
- 172,2422.9%Asian alone
- 33,7620.6%American Indian alone
- 19,6800.3%Other race alone
- 2,5920.04%Native Hawaiian and Other
Pacific Islander alone

Income and house value in Spider Lake
- Median household income in 2022
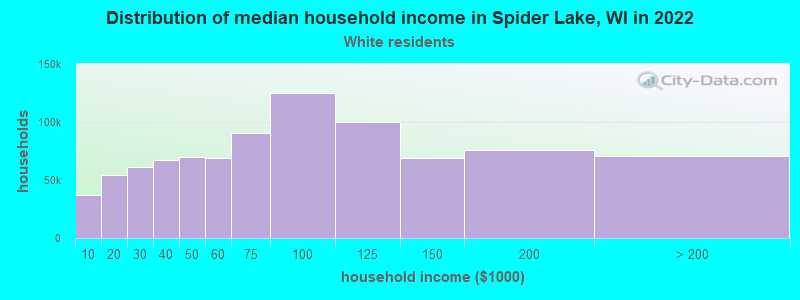
- $64,434White non-Hispanic householders
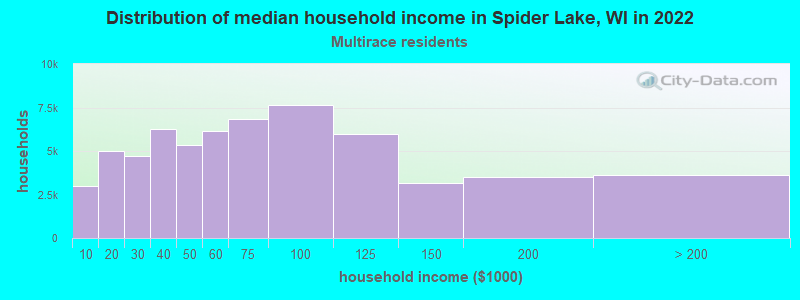
- $57,041Two or more races householders
- Median 2022 house value
- $532,567White Non-Hispanic householders
- $463,585Two or more races householders
Household income for White non-Hispanic householders
Household income for Two or more races householders
Foreign-born residents in Spider Lake
23 residents are foreign born (3.1% Europe, 1.5% North America, 0.8% Africa).
| This city: | 5.9% |
| Wisconsin: | 3.6% |
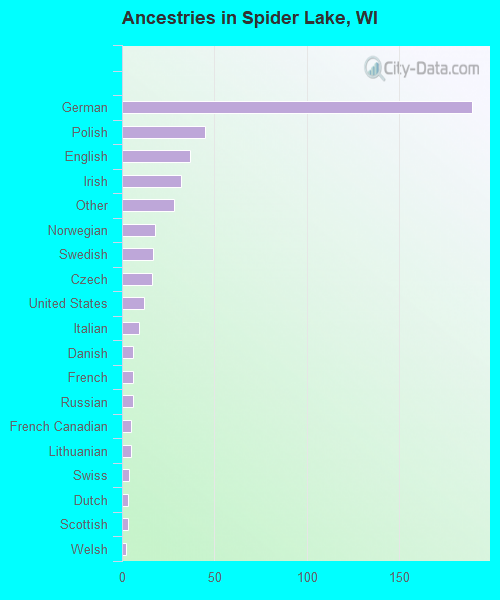
Ancestries in Spider Lake

- 18942.7%German
- 4510.2%Polish
- 378.4%English
- 327.2%Irish
- 286.3%Other
- 184.1%Norwegian
- 173.8%Swedish
- 163.6%Czech
- 122.7%United States
- 92.0%Italian
- 61.4%Danish
- 61.4%French
- 61.4%Russian
- 51.1%French Canadian
- 51.1%Lithuanian
- 40.9%Swiss
- 30.7%Dutch
- 30.7%Scottish
- 20.5%Welsh
Zip codes: 54843.