Races in Springfield, Pennsylvania (PA) Detailed Stats
Ancestries, Foreign-born residents, place of birth

Recent posts about races in Springfield, Pennsylvania on our local forum with over 2,400,000 registered users:

Latest news about races in Springfield, PA collected exclusively by city-data.com from local newspapers, TV, and radio stations
4.4% of Springfield, PA residents are foreign-born (1.8% born in Asia, 1.8% born in Europe), which is 58.0% less than the foreign-born rate of 7.0% across the entire state of Pennsylvania.
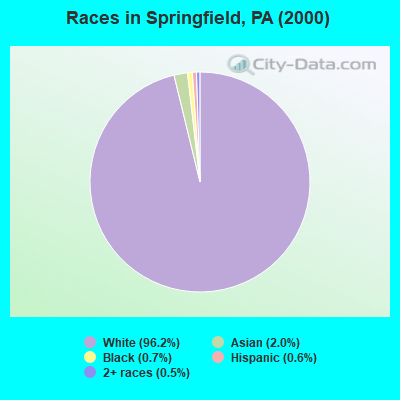
Race distribution in Springfield

- 22,76696.2%White alone
- 4642.0%Asian alone
- 1660.7%Black alone
- 1460.6%Hispanic
- 1130.5%Two or more races
- 120.05%American Indian alone
- 70.03%Other race alone
- 30.01%Native Hawaiian and Other
Pacific Islander alone
2000
2022
-
- 10,322,45584.1%White alone
- 1,202,4379.8%Black alone
- 394,0883.2%Hispanic
- 218,2961.8%Asian alone
- 113,0970.9%Two or more races
- 13,0860.1%Other race alone
- 14,9040.1%American Indian alone
- 2,6910.02%Native Hawaiian and Other
Pacific Islander alone

-
- 9,487,22873.1%White alone
- 1,311,58110.1%Black alone
- 1,115,9978.6%Hispanic
- 493,9423.8%Two or more races
- 487,1243.8%Asian alone
- 63,5820.5%Other race alone
- 10,1300.08%American Indian alone
- 2,4240.02%Native Hawaiian and Other
Pacific Islander alone

Income and house value in Springfield
- Median household income in 2022
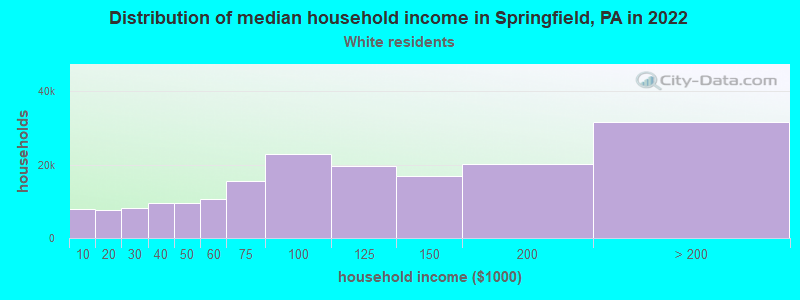
- $120,832White non-Hispanic householders
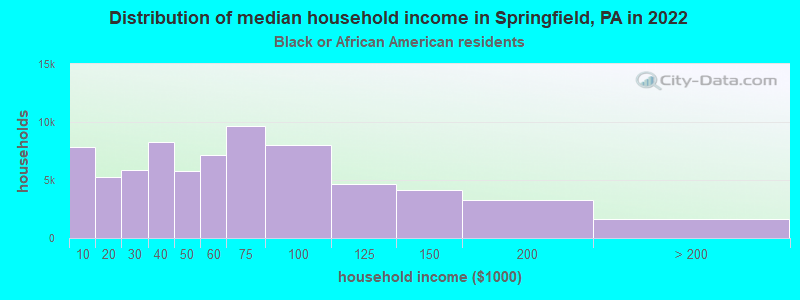
- $80,892Black householders
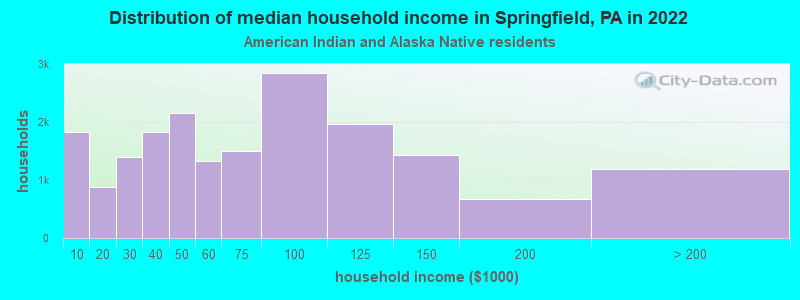
- $195,869American Indian and Alaska Native householders
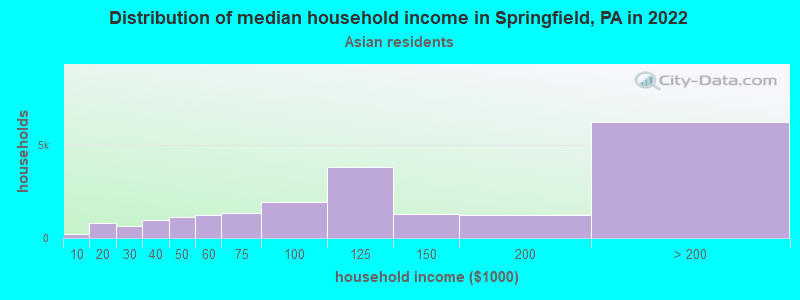
- $184,654Asian householders
- $188,003Some other race householders
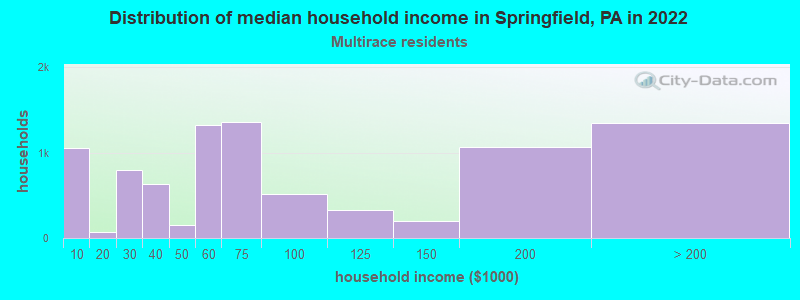
- $65,186Two or more races householders
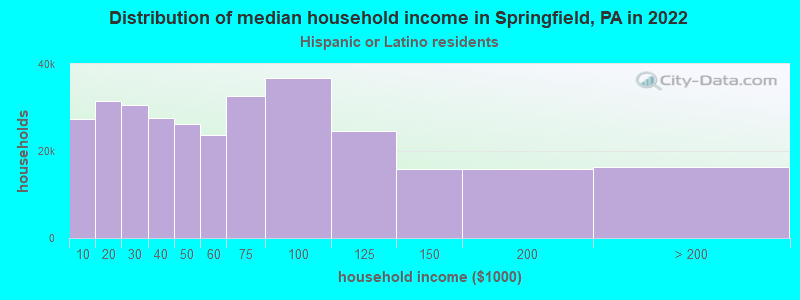
- $76,270Hispanic or Latino race householders
- Median 2022 house value
- $405,084White Non-Hispanic householders
- $157,104Black or African American householders
- $622,440American Indian or Alaska Native householders
- $410,811Asian householders
- $342,342Some other race householders
- $330,640Two or more races householders
- $337,860Hispanic or Latino householders
Household income for White non-Hispanic householders
Household income for Black householders
Household income for American Indian and Alaska Native householders
Household income for Asian householders
Household income for Two or more races householders
Household income for Hispanic or Latino race householders
Foreign-born residents in Springfield
1,049 residents are foreign born (1.8% Asia, 1.8% Europe).
| This city: | 4.4% |
| Pennsylvania: | 4.1% |
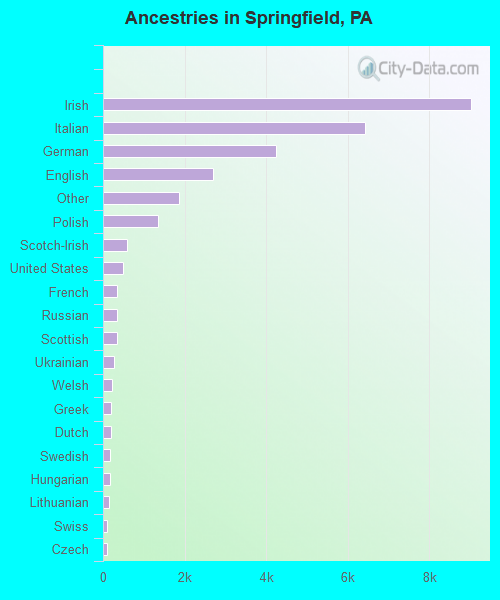
Ancestries in Springfield

- 9,00830.5%Irish
- 6,42421.7%Italian
- 4,23214.3%German
- 2,6859.1%English
- 1,8596.3%Other
- 1,3454.5%Polish
- 5902.0%Scotch-Irish
- 4981.7%United States
- 3401.1%French
- 3391.1%Russian
- 3371.1%Scottish
- 2580.9%Ukrainian
- 2260.8%Welsh
- 2020.7%Greek
- 1940.7%Dutch
- 1810.6%Swedish
- 1620.5%Hungarian
- 1380.5%Lithuanian
- 1080.4%Swiss
- 930.3%Czech
- 810.3%Slovak
- 610.2%Subsaharan African
- 540.2%Norwegian
- 530.2%Danish
- 530.2%French Canadian
- 420.1%Portuguese
- 50.02%West Indian
Zip codes: 19064.