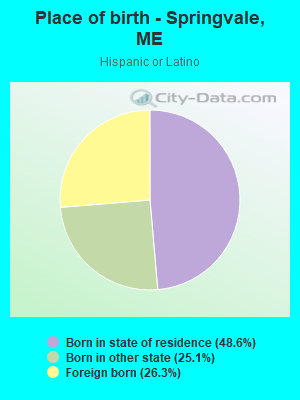
Races in Springvale, Maine (ME) Detailed Stats
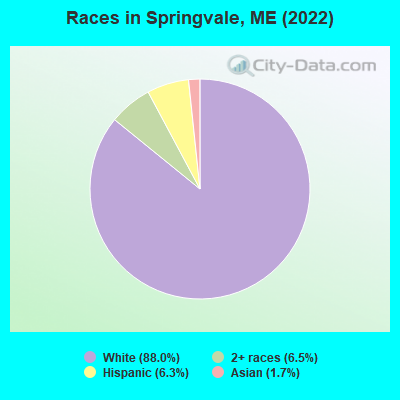
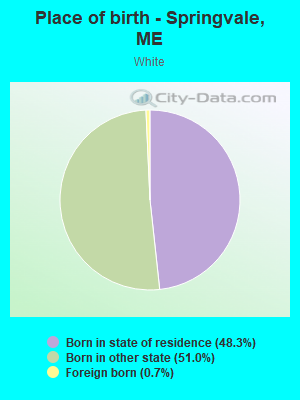
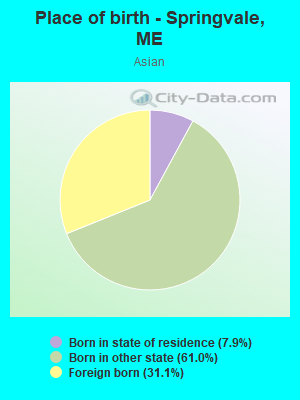
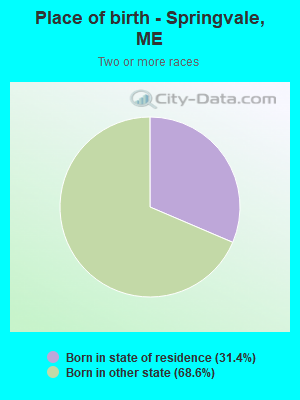
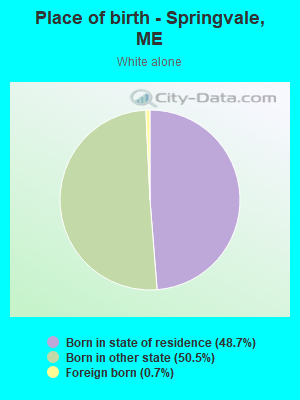
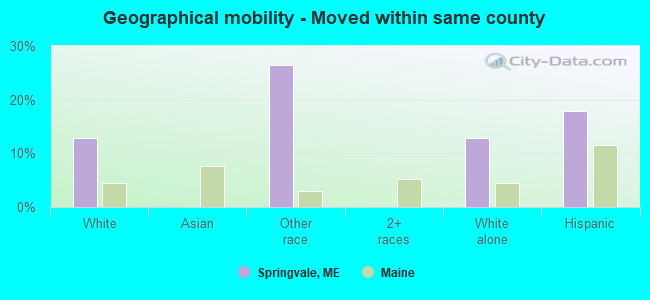
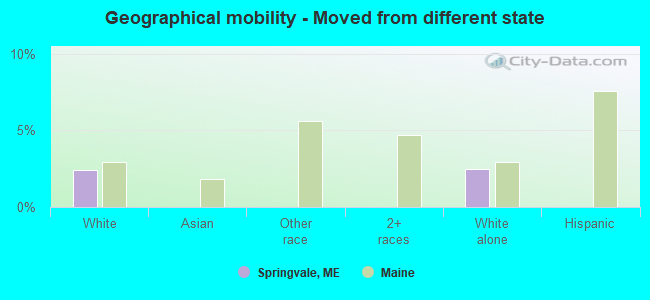
According to 2022 data, the most numerous races in Springvale, ME are White alone (3,338 residents), Two or more races (246 residents), and Hispanic (238 residents). 91.9% of Springvale residents speak English at home. 2.2% of Springvale, ME residents are foreign-born (0.8% born in Latin America, 0.7% born in Asia, 0.5% born in Europe), which is 36.3% less than the foreign-born rate of 3.0% across the entire state of Maine.
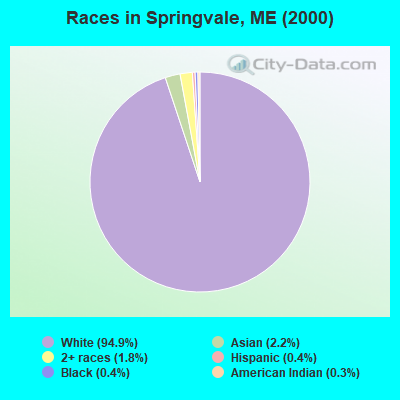
Race distribution in Springvale
2000 2022
1,230,297 96.5% White alone 11,731 0.9% Two or more races 9,360 0.7% Hispanic 9,014 0.7% Asian alone 6,440 0.5% Black alone 6,911 0.5% American Indian alone 836 0.07% Other race alone 334 0.03% Native Hawaiian and Other
1,249,233 90.2% White alone 58,357 4.2% Two or more races 28,717 2.1% Hispanic 21,583 1.6% Black alone 16,151 1.2% Asian alone 5,873 0.4% Other race alone 5,205 0.4% American Indian alone 221 0.02% Native Hawaiian and Other
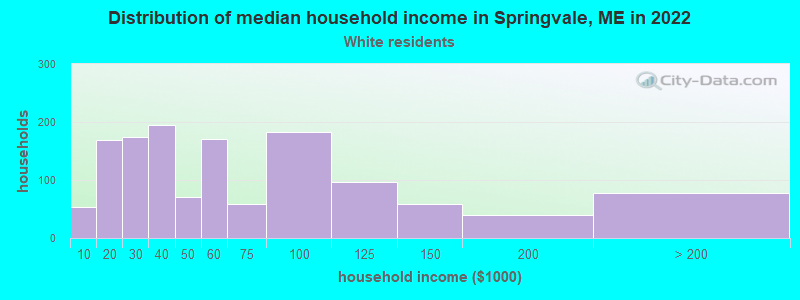
Income and house value in Springvale Median household income in 2022 $52,479 White non-Hispanic householders$39,227 Black householders$39,224 Asian householders$35,193 Hispanic or Latino race householdersMedian 2022 house value $269,585 White Non-Hispanic householders $271,502 Asian householders$207,619 Hispanic or Latino householders
Household income for White non-Hispanic householders
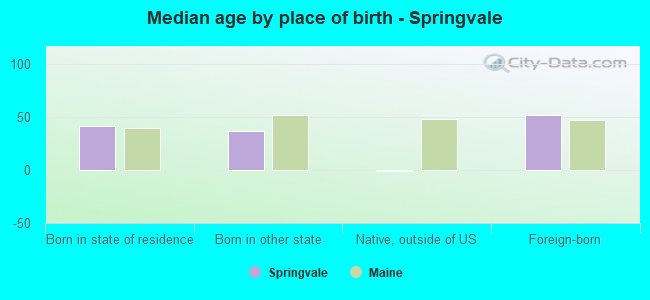
Median age by race in Springvale
41.3 Median age for White residents39.4 44.2 42.9 Median age for Asian residents34.5 27.5 33.7 Median age for Two or more races residents42.3 Median age for White alone residents40.1 44.4 24.8 Median age for Hispanic or Latino residents26.8 18.0
Owner/renter occupied households by race in Springvale
House owners and renters - White residents 815 55.6% Owner occupied651 44.4% Renter occupiedHouse owners and renters - Asian residents 6 100.0% Owner occupiedHouse owners and renters - White alone residents 803 55.2% Owner occupied652 44.8% Renter occupiedHouse owners and renters - Hispanic or Latino residents 11 100.0% Owner occupied
Language usage in Springvale
English speakers - Total 91.9% of residents of Springvale speak English at home.
7.6% of residents speak other language at home 232 86.6% Speak English very well36 13.4% Speak English less than very well
English speakers - Born in the United States 95.2% of residents of Springvale speak English at home.
4.8% of residents speak other language at home 88 100.0% Speak English very well
English speakers - Foreign-born 72.6% of residents of Springvale speak English at home.
26.3% of residents speak other language at home 22 88.0% Speak English very well3 12.0% Speak English less than very well
White (Caucasian) - Speak only English Native:
92.8% (2,925)Foreign-born:
100.0% (25)
Asian - Speak only English Native:
100.0% (67)Foreign-born:
19.9% (5)
Asian - Speak another language Native:
15.2% (10)Foreign-born:
77.1% (20)
White alone - Speak only English Native:
92.7% (2,834)Foreign-born:
100.0% (25)
Hispanic or Latino - Speak only English Native:
100.0% (203)Foreign-born:
30.4% (20)
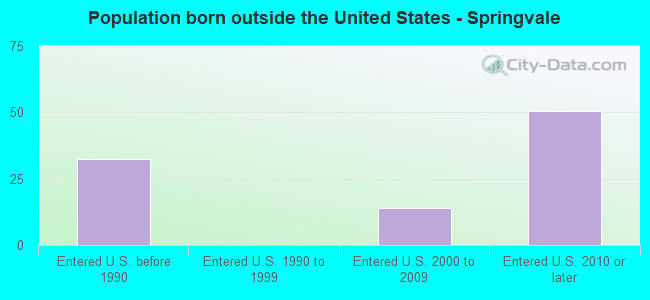
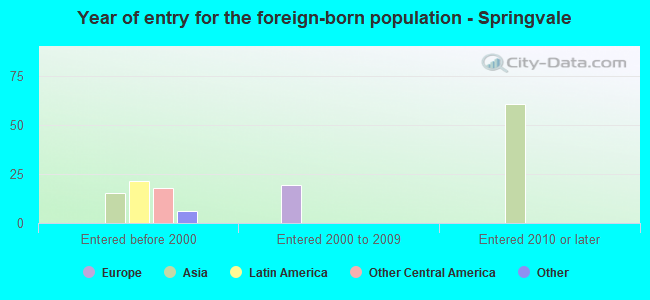
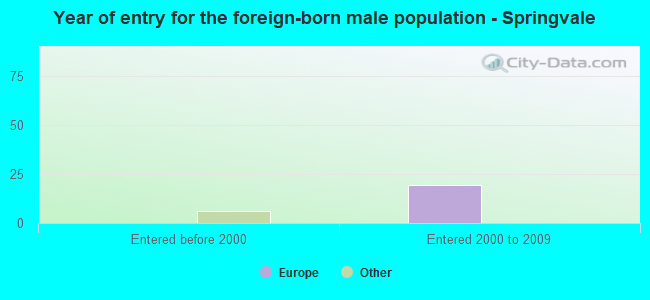
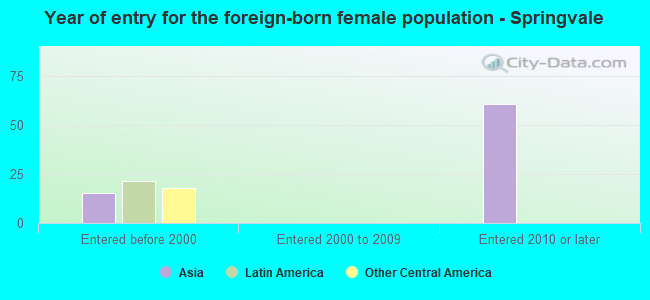
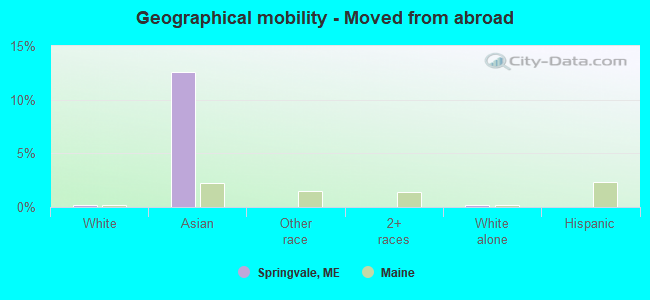
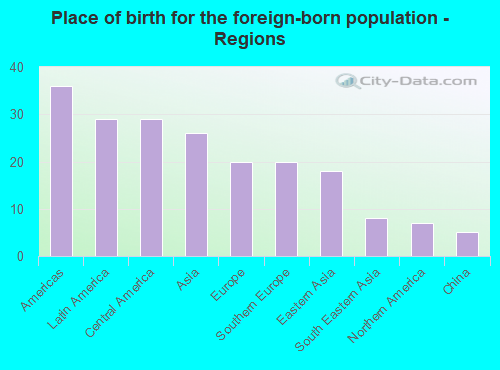
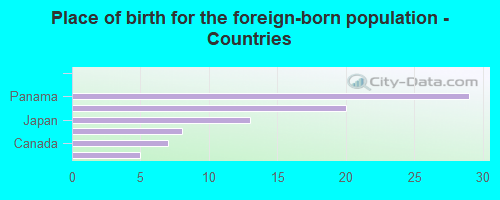
Foreign-born residents in Springvale 84 residents are foreign born (0.8% Latin America , 0.7% Asia , 0.5% Europe ).
This city:
2.2%Maine:
100.0%
Marital status for residents in Springvale Marital status - White (Caucasian) population 15 years and over
Males 30.5% Never married53.3% Now married0.0% Separated1.0% Widowed15.2% DivorcedFemales 29.8% Never married41.6% Now married0.0% Separated6.3% Widowed22.3% DivorcedWomen who gave birth in the past 12 months Now married:
84.6% (49)Unmarried:
15.4% (9)
Women who did not give birth in the past 12 months Now married:
35.5% (245)Unmarried:
64.5% (445)
Marital status - Asian population 15 years and over
Males 100.0% Never married0.0% Now married0.0% Separated0.0% Widowed0.0% DivorcedFemales 29.7% Never married59.5% Now married0.0% Separated0.0% Widowed10.8% DivorcedWomen who did not give birth in the past 12 months Now married:
45.0% (11)Unmarried:
55.0% (13)
Marital status - White alone, not Hispanic / Latino population 15 years and over
Males 30.7% Never married52.9% Now married0.0% Separated1.1% Widowed15.3% DivorcedFemales 29.8% Never married41.5% Now married0.0% Separated6.3% Widowed22.3% DivorcedWomen who gave birth in the past 12 months Now married:
84.6% (49)Unmarried:
15.4% (9)
Women who did not give birth in the past 12 months Now married:
35.5% (245)Unmarried:
64.5% (445)
Marital status - Hispanic or Latino population 15 years and over
Males 85.2% Never married14.8% Now married0.0% Separated0.0% Widowed0.0% DivorcedFemales 0.0% Never married100.0% Now married0.0% Separated0.0% Widowed0.0% Divorced
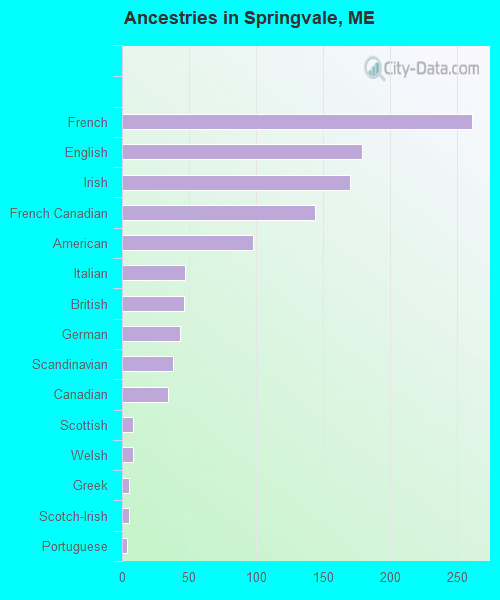
Ancestries in Springvale
261 20.3% French179 13.9% English170 13.2% Irish144 11.2% French Canadian98 7.6% American47 3.6% Italian46 3.6% British43 3.3% German38 3.0% Scandinavian34 2.6% Canadian8 0.6% Scottish8 0.6% Welsh5 0.4% Greek5 0.4% Scotch-Irish4 0.3% Portuguese
Children Nativity (place of birth) in Springvale
Children under 6 years - Living with two parents Both parents native 149 100.0% NativeOne native, one foreign-born parent 11 100.0% NativeChildren under 6 years - Living with one parent Native parent 126 100.0% Native
Children 6 to 17 years - Living with two parents Both parents native 175 100.0% NativeOne native, one foreign-born parent 29 100.0% NativeChildren 6 to 17 years - Living with one parent Native parent 219 100.0% Native
Grandparents responsible for own grandchildren in Springvale
Grandparents (30 to 59 years) White / Caucasian 24 100.0% Not responsible for grandchildrenAsian 1 100.0% Responsible for grandchildrenWhite alone, not Hispanic / Latino 24 100.0% Not responsible for grandchildren
Grandparents (60 years and over) White / Caucasian 19 100.0% Not responsible for grandchildrenWhite alone, not Hispanic / Latino 19 100.0% Not responsible for grandchildren