Races in St. Francis, Maine (ME) Detailed Stats
Ancestries, Foreign-born residents, place of birth

Recent posts about races in St. Francis, Maine on our local forum with over 2,400,000 registered users:
 | will I have trouble not speaking French in northern Aroostook County? (23 replies) |
| House Not Selling? Could It Be You? (37 replies) |
| Best French-Canadian flavor towns in Maine? (19 replies) |
| How would you rank these towns for home purchase (17 replies) |
| Anyone from Saint Francis Maine (18 replies) |
2.4% of St. Francis, ME residents are foreign-born (2.4% born in North America), which is 23.6% less than the foreign-born rate of 3.0% across the entire state of Maine.
Race distribution in St. Francis
2000
2022

- 1,230,29796.5%White alone
- 11,7310.9%Two or more races
- 9,3600.7%Hispanic
- 9,0140.7%Asian alone
- 6,4400.5%Black alone
- 6,9110.5%American Indian alone
- 8360.07%Other race alone
- 3340.03%Native Hawaiian and Other
Pacific Islander alone

-
- 1,249,23390.2%White alone
- 58,3574.2%Two or more races
- 28,7172.1%Hispanic
- 21,5831.6%Black alone
- 16,1511.2%Asian alone
- 5,8730.4%Other race alone
- 5,2050.4%American Indian alone
- 2210.02%Native Hawaiian and Other
Pacific Islander alone

Income and house value in St. Francis
- Median household income in 2022
- $45,151White non-Hispanic householders
- Median 2022 house value
- $109,439White Non-Hispanic householders
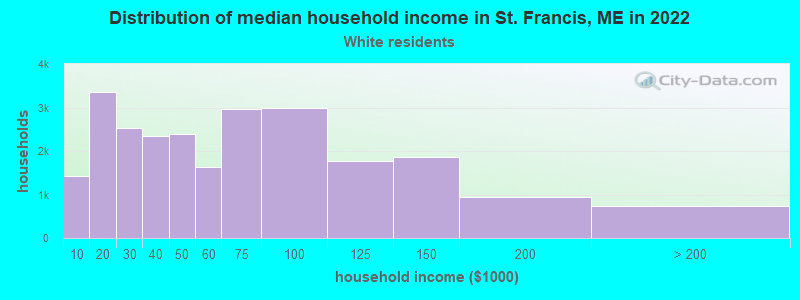
Household income for White non-Hispanic householders
Foreign-born residents in St. Francis
14 residents are foreign born (2.4% North America).
| This city: | 2.4% |
| Maine: | 2.9% |
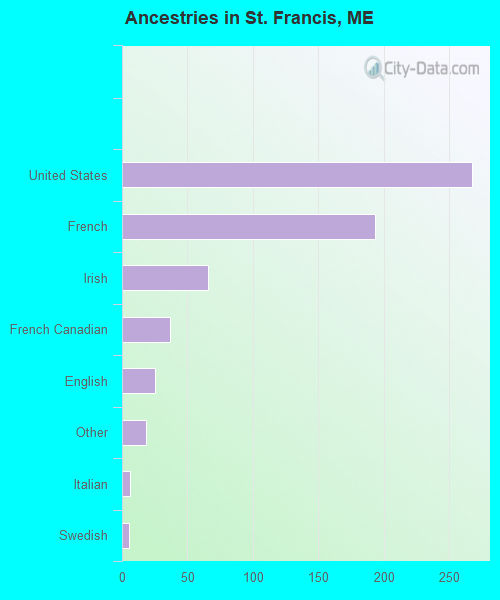
Ancestries in St. Francis

- 26742.9%United States
- 19331.0%French
- 6610.6%Irish
- 375.9%French Canadian
- 254.0%English
- 182.9%Other
- 61.0%Italian
- 50.8%Swedish
- 20.3%Polish
- 20.3%Scotch-Irish
- 10.2%Dutch
- 10.2%German
Zip codes: 04774.