Races in Strawberry Plains, Tennessee (TN) Detailed Stats
Ancestries, Foreign-born residents, place of birth
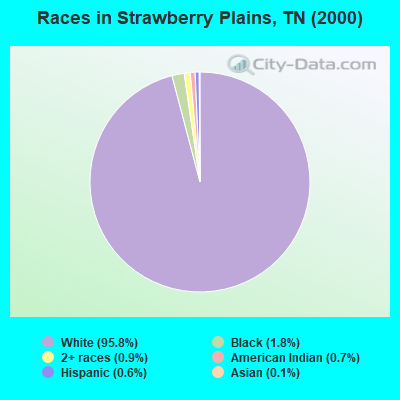
Race distribution in Strawberry Plains

- 4,47395.8%White alone
- 861.8%Black alone
- 410.9%Two or more races
- 310.7%American Indian alone
- 270.6%Hispanic
- 60.1%Asian alone
- 30.06%Other race alone
2000
2022
-
- 4,505,93079.2%White alone
- 928,20416.3%Black alone
- 123,8382.2%Hispanic
- 54,8241.0%Two or more races
- 56,0771.0%Asian alone
- 13,8200.2%American Indian alone
- 4,7800.08%Other race alone
- 1,8100.03%Native Hawaiian and Other
Pacific Islander alone

-
- 5,070,02671.9%White alone
- 1,089,73815.5%Black alone
- 442,6296.3%Hispanic
- 279,3814.0%Two or more races
- 131,8171.9%Asian alone
- 26,9720.4%Other race alone
- 6,3870.09%American Indian alone
- 4,3890.06%Native Hawaiian and Other
Pacific Islander alone

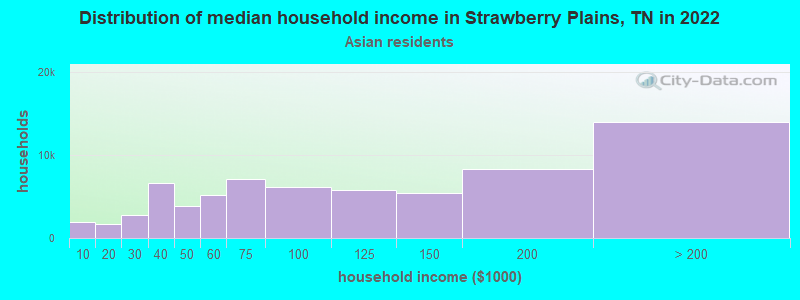
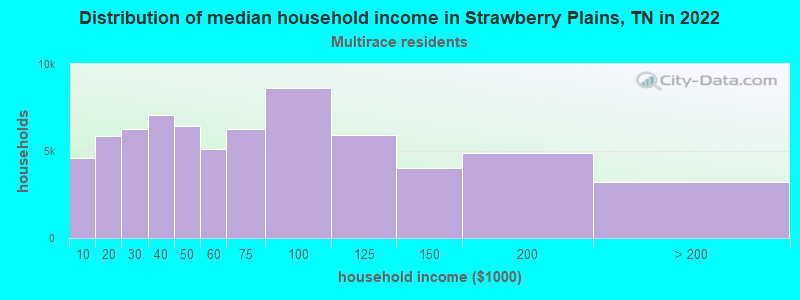
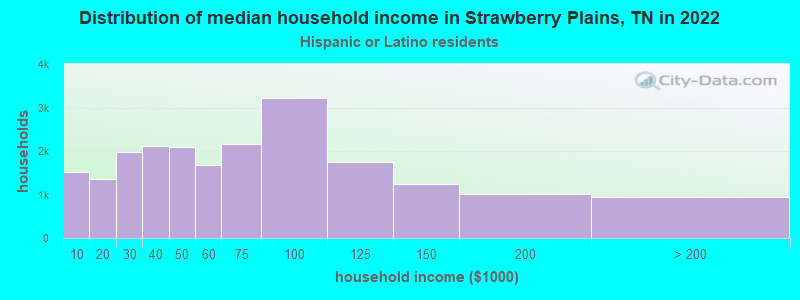
Income and house value in Strawberry Plains
- Median household income in 2022
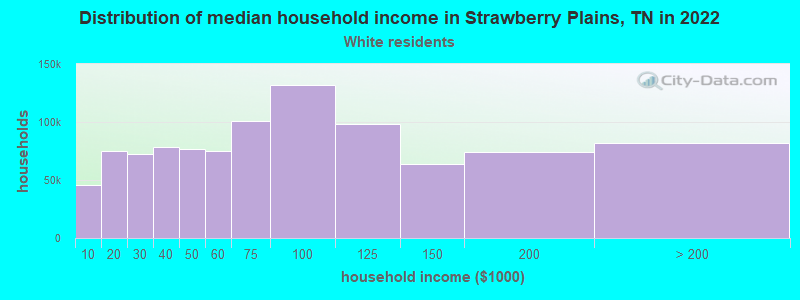
- $60,935White non-Hispanic householders
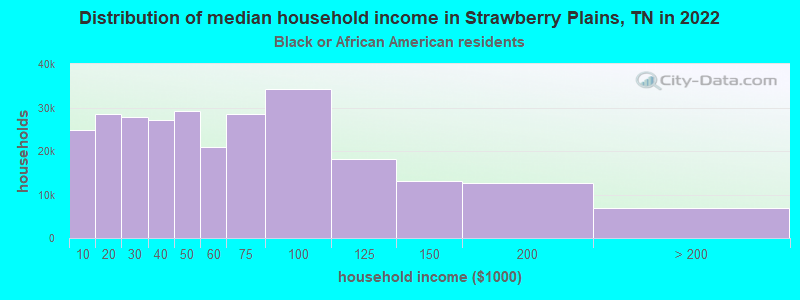
- $72,538Black householders
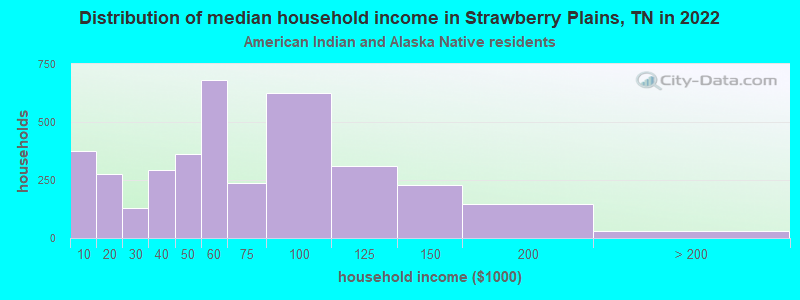
- $42,045American Indian and Alaska Native householders
- $134,420Asian householders
- $24,911Some other race householders
- $53,704Two or more races householders
- $27,169Hispanic or Latino race householders
- Median 2022 house value
- $235,278White Non-Hispanic householders
- $228,874Black or African American householders
- $180,983American Indian or Alaska Native householders
- $382,849Asian householders
Household income for White non-Hispanic householders
Household income for Black householders
Household income for American Indian and Alaska Native householders
Household income for Asian householders
Household income for Two or more races householders
Household income for Hispanic or Latino race householders
Zip code: 37871