Races in Suffern, New York (NY) Detailed Stats
Data:
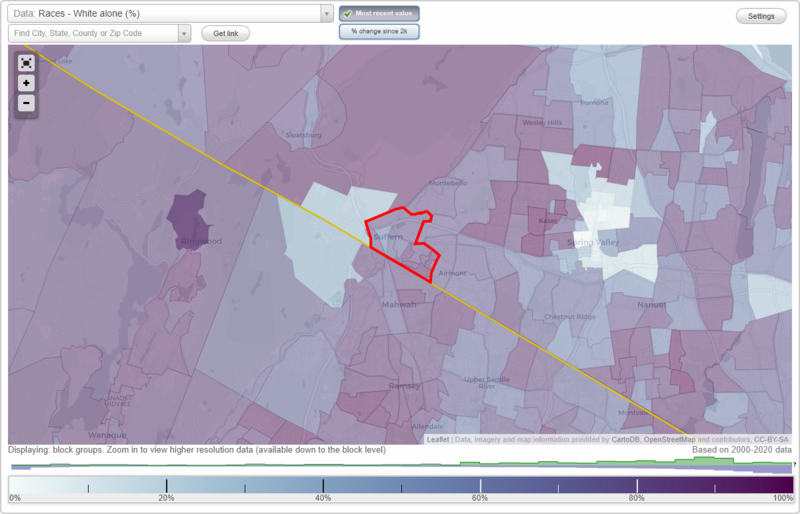
Races - White alone (%)
Races - White alone (% change since 2000)
Races - Black alone (%)
Races - Black alone (% change since 2000)
Races - American Indian alone (%)
Races - American Indian alone (% change since 2000)
Races - Asian alone (%)
Races - Asian alone (% change since 2000)
Races - Hispanic (%)
Races - Hispanic (% change since 2000)
Races - Native Hawaiian and Other Pacific Islander alone (%)
Races - Native Hawaiian and Other Pacific Islander alone (% change since 2000)
Races - Two or more races(%)
Races - Two or more races(% change since 2000)
Races - Other race alone (%)
Races - Other race alone (% change since 2000)
Racial diversity
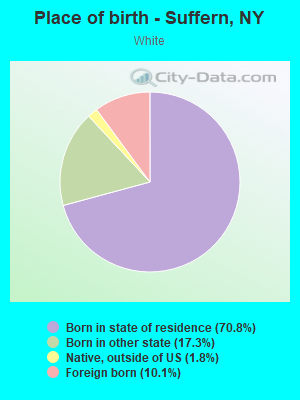
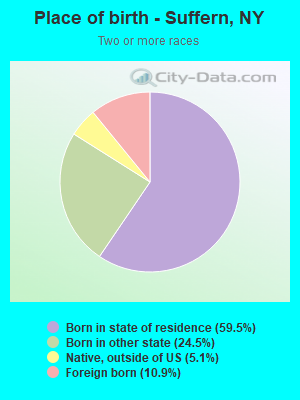
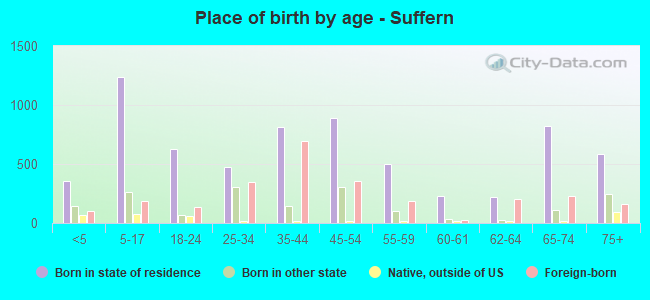
Place of birth - Born in state of residence (%)
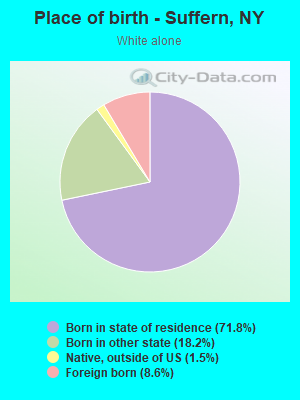
Place of birth - Born in state of residence (%) - White
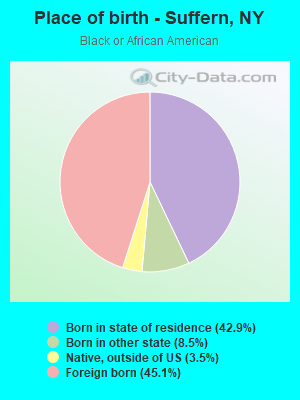
Place of birth - Born in state of residence (%) - Black or African American
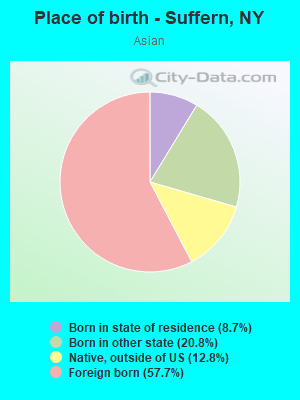
Place of birth - Born in state of residence (%) - Asian
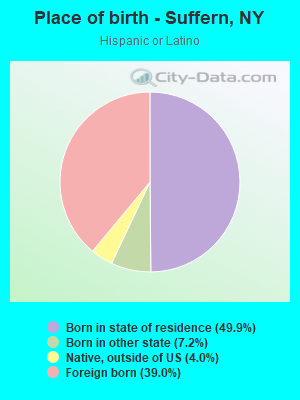
Place of birth - Born in state of residence (%) - Hispanic or Latino
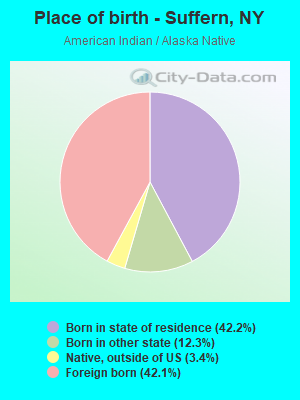
Place of birth - Born in state of residence (%) - American Indian and Alaska Native
Place of birth - Born in state of residence (%) - Multirace
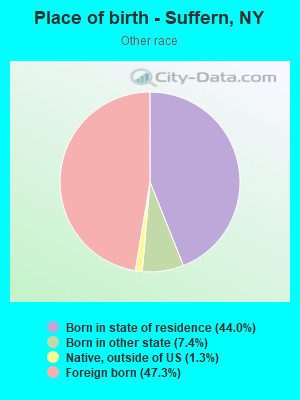
Place of birth - Born in state of residence (%) - Other Race
Place of birth - Born in other state (%)
Place of birth - Born in other state (%) - White
Place of birth - Born in other state (%) - Black or African American
Place of birth - Born in other state (%) - Asian
Place of birth - Born in other state (%) - Hispanic or Latino
Place of birth - Born in other state (%) - American Indian and Alaska Native
Place of birth - Born in other state (%) - Multirace
Place of birth - Born in other state (%) - Other Race
Place of birth - Native, outside of US (%)
Place of birth - Native, outside of US (%) - White
Place of birth - Native, outside of US (%) - Black or African American
Place of birth - Native, outside of US (%) - Asian
Place of birth - Native, outside of US (%) - Hispanic or Latino
Place of birth - Native, outside of US (%) - American Indian and Alaska Native
Place of birth - Native, outside of US (%) - Multirace
Place of birth - Native, outside of US (%) - Other Race
Place of birth - Foreign born (%)
Place of birth - Foreign born (%) - White
Place of birth - Foreign born (%) - Black or African American
Place of birth - Foreign born (%) - Asian
Place of birth - Foreign born (%) - Hispanic or Latino
Place of birth - Foreign born (%) - American Indian and Alaska Native
Place of birth - Foreign born (%) - Multirace
Place of birth - Foreign born (%) - Other Race
Residents speaking English at home (%)
Residents speaking English at home - Born in the United States (%)
Residents speaking English at home - Native, born elsewhere (%)
Residents speaking English at home - Foreign born (%)
Residents speaking Spanish at home (%)
Residents speaking Spanish at home - Born in the United States (%)
Residents speaking Spanish at home - Native, born elsewhere (%)
Residents speaking Spanish at home - Foreign born (%)
Residents speaking other language at home (%)
Residents speaking other language at home - Born in the United States (%)
Residents speaking other language at home - Native, born elsewhere (%)
Residents speaking other language at home - Foreign born (%)
Marital status - Never married (%)
Marital status - Now married (%)
Marital status - Separated (%)
Marital status - Widowed (%)
Marital status - Divorced (%)
Ancestries Reported - Arab (%)
Ancestries Reported - Czech (%)
Ancestries Reported - Danish (%)
Ancestries Reported - Dutch (%)
Ancestries Reported - English (%)
Ancestries Reported - French (%)
Ancestries Reported - French Canadian (%)
Ancestries Reported - German (%)
Ancestries Reported - Greek (%)
Ancestries Reported - Hungarian (%)
Ancestries Reported - Irish (%)
Ancestries Reported - Italian (%)
Ancestries Reported - Lithuanian (%)
Ancestries Reported - Norwegian (%)
Ancestries Reported - Polish (%)
Ancestries Reported - Portuguese (%)
Ancestries Reported - Russian (%)
Ancestries Reported - Scotch-Irish (%)
Ancestries Reported - Scottish (%)
Ancestries Reported - Slovak (%)
Ancestries Reported - Subsaharan African (%)
Ancestries Reported - Swedish (%)
Ancestries Reported - Swiss (%)
Ancestries Reported - Ukrainian (%)
Ancestries Reported - United States (%)
Ancestries Reported - Welsh (%)
Ancestries Reported - West Indian (%)
Ancestries Reported - Other (%)
Geographical mobility - Same house 1 year ago (%)
Geographical mobility - Same house 1 year ago (%) - White
Geographical mobility - Same house 1 year ago (%) - Black or African American
Geographical mobility - Same house 1 year ago (%) - Asian
Geographical mobility - Same house 1 year ago (%) - Hispanic or Latino
Geographical mobility - Same house 1 year ago (%) - American Indian and Alaska Native
Geographical mobility - Same house 1 year ago (%) - Multirace
Geographical mobility - Same house 1 year ago (%) - Other Race
Geographical mobility - Moved within same county (%)
Geographical mobility - Moved within same county (%) - White
Geographical mobility - Moved within same county (%) - Black or African American
Geographical mobility - Moved within same county (%) - Asian
Geographical mobility - Moved within same county (%) - Hispanic or Latino
Geographical mobility - Moved within same county (%) - American Indian and Alaska Native
Geographical mobility - Moved within same county (%) - Multirace
Geographical mobility - Moved within same county (%) - Other Race
Geographical mobility - Moved from different county within same state (%)
Geographical mobility - Moved from different county within same state (%) - White
Geographical mobility - Moved from different county within same state (%) - Black or African American
Geographical mobility - Moved from different county within same state (%) - Asian
Geographical mobility - Moved from different county within same state (%) - Hispanic or Latino
Geographical mobility - Moved from different county within same state (%) - American Indian and Alaska Native
Geographical mobility - Moved from different county within same state (%) - Multirace
Geographical mobility - Moved from different county within same state (%) - Other Race
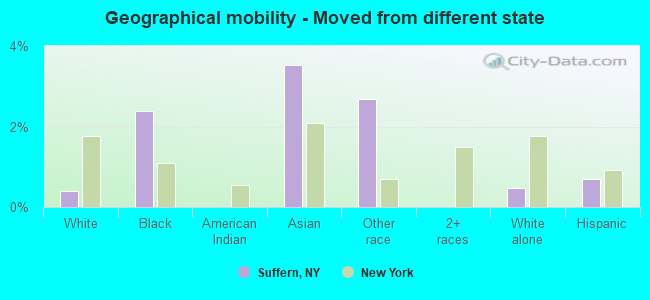
Geographical mobility - Moved from different state (%)
Geographical mobility - Moved from different state (%) - White
Geographical mobility - Moved from different state (%) - Black or African American
Geographical mobility - Moved from different state (%) - Asian
Geographical mobility - Moved from different state (%) - Hispanic or Latino
Geographical mobility - Moved from different state (%) - American Indian and Alaska Native
Geographical mobility - Moved from different state (%) - Multirace
Geographical mobility - Moved from different state (%) - Other Race
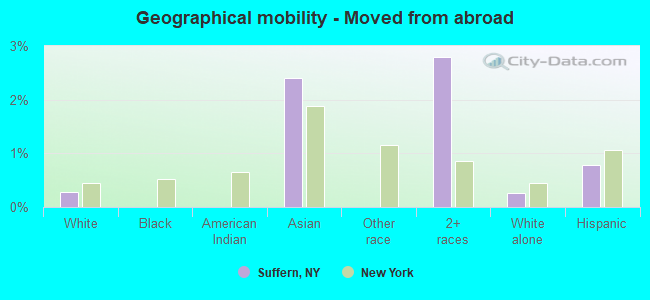
Geographical mobility - Moved from abroad (%)
Geographical mobility - Moved from abroad (%) - White
Geographical mobility - Moved from abroad (%) - Black or African American
Geographical mobility - Moved from abroad (%) - Asian
Geographical mobility - Moved from abroad (%) - Hispanic or Latino
Geographical mobility - Moved from abroad (%) - American Indian and Alaska Native
Geographical mobility - Moved from abroad (%) - Multirace
Geographical mobility - Moved from abroad (%) - Other Race
Place of birth for the foreign-born population - Ireland (%)
Place of birth for the foreign-born population - Denmark (%)
Place of birth for the foreign-born population - Norway (%)
Place of birth for the foreign-born population - Sweden (%)
Place of birth for the foreign-born population - United Kingdom (%)
Place of birth for the foreign-born population - England (%)
Place of birth for the foreign-born population - Scotland (%)
Place of birth for the foreign-born population - Other Northern Europe (%)
Place of birth for the foreign-born population - Austria (%)
Place of birth for the foreign-born population - Belgium (%)
Place of birth for the foreign-born population - France (%)
Place of birth for the foreign-born population - Germany (%)
Place of birth for the foreign-born population - Netherlands (%)
Place of birth for the foreign-born population - Switzerland (%)
Place of birth for the foreign-born population - Other Western Europe (%)
Place of birth for the foreign-born population - Greece (%)
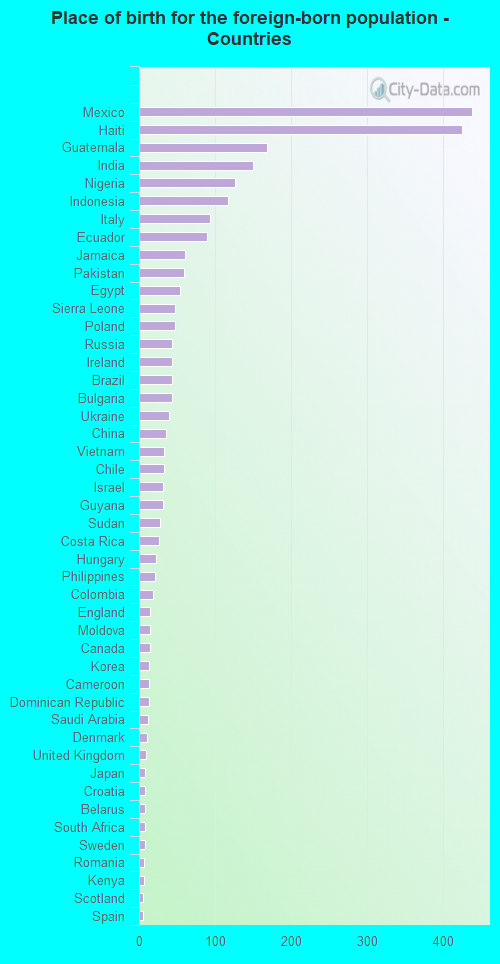
Place of birth for the foreign-born population - Italy (%)
Place of birth for the foreign-born population - Portugal (%)
Place of birth for the foreign-born population - Spain (%)
Place of birth for the foreign-born population - Other Southern Europe (%)
Place of birth for the foreign-born population - Albania (%)
Place of birth for the foreign-born population - Belarus (%)
Place of birth for the foreign-born population - Bosnia and Herzegovina (%)
Place of birth for the foreign-born population - Bulgaria (%)
Place of birth for the foreign-born population - Croatia (%)
Place of birth for the foreign-born population - Czechoslovakia (%)
Place of birth for the foreign-born population - Hungary (%)
Place of birth for the foreign-born population - Latvia (%)
Place of birth for the foreign-born population - Lithuania (%)
Place of birth for the foreign-born population - North Macedonia (Macedonia) (%)
Place of birth for the foreign-born population - Moldova (%)
Place of birth for the foreign-born population - Poland (%)
Place of birth for the foreign-born population - Romania (%)
Place of birth for the foreign-born population - Russia (%)
Place of birth for the foreign-born population - Serbia (%)
Place of birth for the foreign-born population - Ukraine (%)
Place of birth for the foreign-born population - Other Eastern Europe (%)
Place of birth for the foreign-born population - China (%)
Place of birth for the foreign-born population - Hong Kong (%)
Place of birth for the foreign-born population - Taiwan (%)
Place of birth for the foreign-born population - Japan (%)
Place of birth for the foreign-born population - Korea (%)
Place of birth for the foreign-born population - Other Eastern Asia (%)
Place of birth for the foreign-born population - Afghanistan (%)
Place of birth for the foreign-born population - Bangladesh (%)
Place of birth for the foreign-born population - India (%)
Place of birth for the foreign-born population - Iran (%)
Place of birth for the foreign-born population - Kazakhstan (%)
Place of birth for the foreign-born population - Nepal (%)
Place of birth for the foreign-born population - Pakistan (%)
Place of birth for the foreign-born population - Sri Lanka (%)
Place of birth for the foreign-born population - Uzbekistan (%)
Place of birth for the foreign-born population - Other South Central Asia (%)
Place of birth for the foreign-born population - Burma (%)
Place of birth for the foreign-born population - Cambodia (%)
Place of birth for the foreign-born population - Indonesia (%)
Place of birth for the foreign-born population - Laos (%)
Place of birth for the foreign-born population - Malaysia (%)
Place of birth for the foreign-born population - Philippines (%)
Place of birth for the foreign-born population - Singapore (%)
Place of birth for the foreign-born population - Thailand (%)
Place of birth for the foreign-born population - Vietnam (%)
Place of birth for the foreign-born population - Other South Eastern Asia (%)
Place of birth for the foreign-born population - Armenia (%)
Place of birth for the foreign-born population - Iraq (%)
Place of birth for the foreign-born population - Israel (%)
Place of birth for the foreign-born population - Jordan (%)
Place of birth for the foreign-born population - Kuwait (%)
Place of birth for the foreign-born population - Lebanon (%)
Place of birth for the foreign-born population - Saudi Arabia (%)
Place of birth for the foreign-born population - Syria (%)
Place of birth for the foreign-born population - Turkey (%)
Place of birth for the foreign-born population - Yemen (%)
Place of birth for the foreign-born population - Other Western Asia (%)
Place of birth for the foreign-born population - Eritrea (%)
Place of birth for the foreign-born population - Ethiopia (%)
Place of birth for the foreign-born population - Kenya (%)
Place of birth for the foreign-born population - Somalia (%)
Place of birth for the foreign-born population - Uganda (%)
Place of birth for the foreign-born population - Zimbabwe (%)
Place of birth for the foreign-born population - Other Eastern Africa (%)
Place of birth for the foreign-born population - Cameroon (%)
Place of birth for the foreign-born population - Congo (%)
Place of birth for the foreign-born population - Democratic Republic of Congo (Zaire) (%)
Place of birth for the foreign-born population - Other Middle Africa (%)
Place of birth for the foreign-born population - Egypt (%)
Place of birth for the foreign-born population - Morocco (%)
Place of birth for the foreign-born population - Sudan (%)
Place of birth for the foreign-born population - Other Northern Africa (%)
Place of birth for the foreign-born population - South Africa (%)
Place of birth for the foreign-born population - Other Southern Africa (%)
Place of birth for the foreign-born population - Cabo Verde (%)
Place of birth for the foreign-born population - Ghana (%)
Place of birth for the foreign-born population - Liberia (%)
Place of birth for the foreign-born population - Nigeria (%)
Place of birth for the foreign-born population - Senegal (%)
Place of birth for the foreign-born population - Sierra Leone (%)
Place of birth for the foreign-born population - Other Western Africa (%)
Place of birth for the foreign-born population - Australia (%)
Place of birth for the foreign-born population - New Zealand (%)
Place of birth for the foreign-born population - Fiji (%)
Place of birth for the foreign-born population - Micronesia (%)
Place of birth for the foreign-born population - Bahamas (%)
Place of birth for the foreign-born population - Barbados (%)
Place of birth for the foreign-born population - Cuba (%)
Place of birth for the foreign-born population - Dominica (%)
Place of birth for the foreign-born population - Dominican Republic (%)
Place of birth for the foreign-born population - Grenada (%)
Place of birth for the foreign-born population - Haiti (%)
Place of birth for the foreign-born population - Jamaica (%)
Place of birth for the foreign-born population - St. Vincent and the Grenadines (%)
Place of birth for the foreign-born population - Trinidad and Tobago (%)
Place of birth for the foreign-born population - West Indies (%)
Place of birth for the foreign-born population - Other Caribbean (%)
Place of birth for the foreign-born population - Belize (%)
Place of birth for the foreign-born population - Costa Rica (%)
Place of birth for the foreign-born population - El Salvador (%)
Place of birth for the foreign-born population - Guatemala (%)
Place of birth for the foreign-born population - Honduras (%)
Place of birth for the foreign-born population - Mexico (%)
Place of birth for the foreign-born population - Nicaragua (%)
Place of birth for the foreign-born population - Panama (%)
Place of birth for the foreign-born population - Other Central America (%)
Place of birth for the foreign-born population - Argentina (%)
Place of birth for the foreign-born population - Bolivia (%)
Place of birth for the foreign-born population - Brazil (%)
Place of birth for the foreign-born population - Chile (%)
Place of birth for the foreign-born population - Colombia (%)
Place of birth for the foreign-born population - Ecuador (%)
Place of birth for the foreign-born population - Guyana (%)
Place of birth for the foreign-born population - Peru (%)
Place of birth for the foreign-born population - Uruguay (%)
Place of birth for the foreign-born population - Venezuela (%)
Place of birth for the foreign-born population - Other South America (%)
Place of birth for the foreign-born population - Canada (%)
Place of birth for the foreign-born population - Other Northern America (%)
Place of birth for the foreign-born population - Other (%)
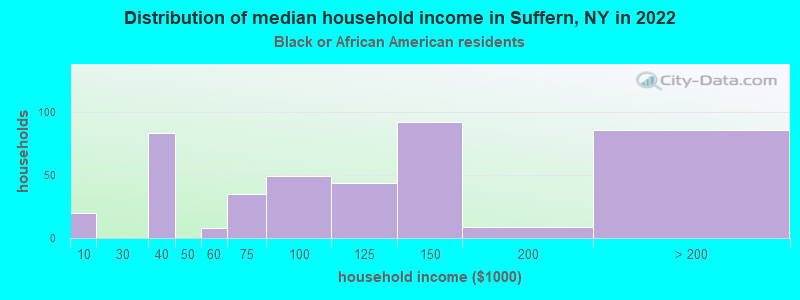
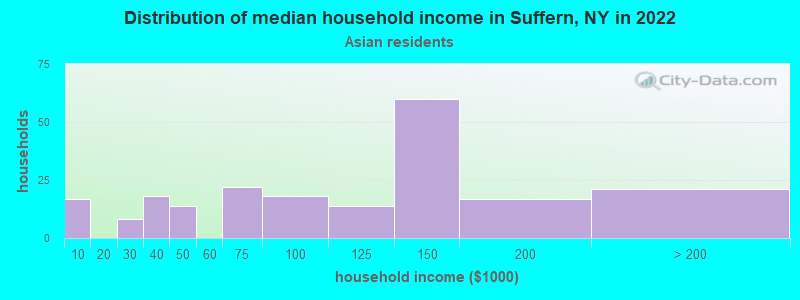
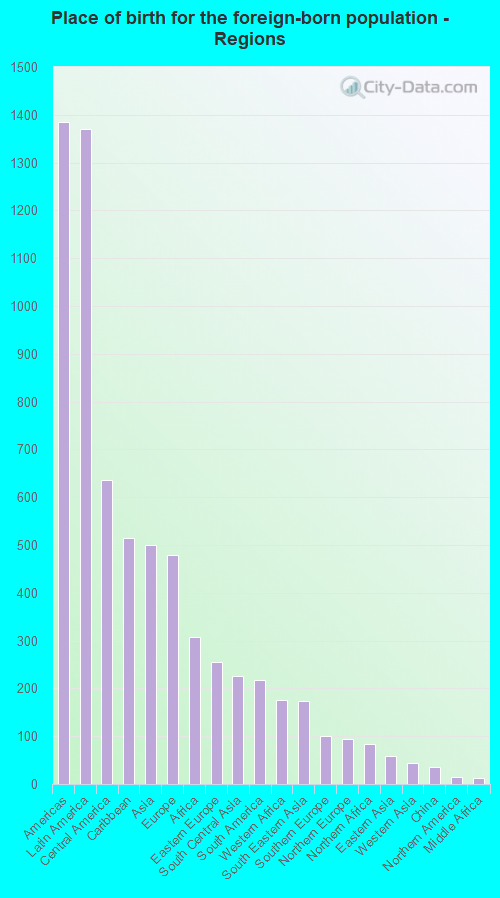
According to 2022 data, the most numerous races in Suffern, NY are White alone (6,488 residents), Hispanic (2,119 residents), and Black alone (1,586 residents). 70.4% of Suffern residents speak English at home. 23.4% of Suffern, NY residents are foreign-born (12.2% born in Latin America, 4.5% born in Asia, 4.3% born in Europe, 2.7% born in Africa), which is 5.9% greater than the foreign-born rate of 22.0% across the entire state of New York.
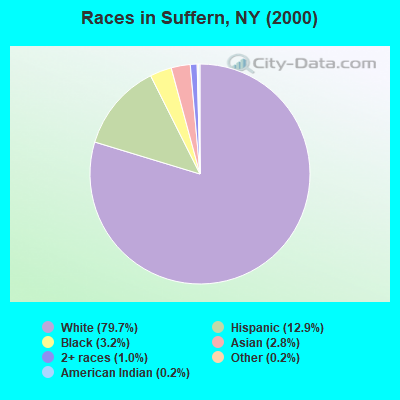
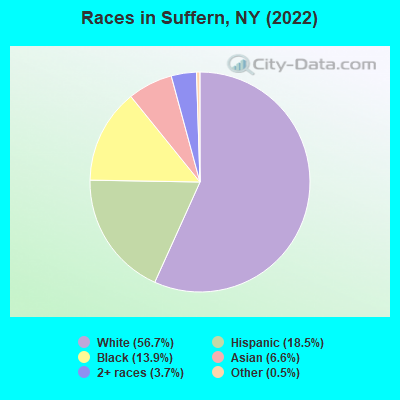
Race distribution in Suffern
2000 2022
11,760,981 62.0% White alone 2,867,583 15.1% Hispanic 2,812,623 14.8% Black alone 1,035,926 5.5% Asian alone 366,116 1.9% Two or more races 75,499 0.4% Other race alone 52,499 0.3% American Indian alone 5,230 0.03% Native Hawaiian and Other
10,408,933 52.9% White alone 3,867,299 19.7% Hispanic 2,633,840 13.4% Black alone 1,776,286 9.0% Asian alone 732,670 3.7% Two or more races 216,110 1.1% Other race alone 35,082 0.2% American Indian alone 6,931 0.04% Native Hawaiian and Other
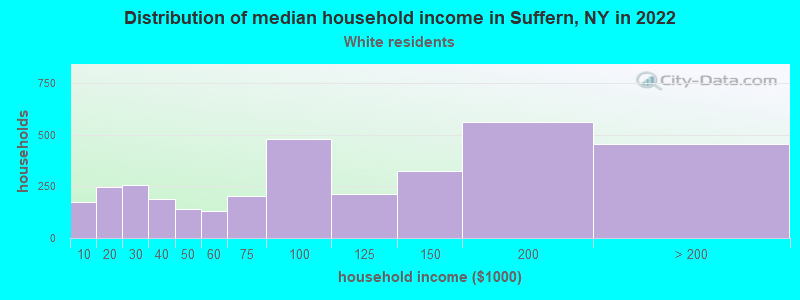
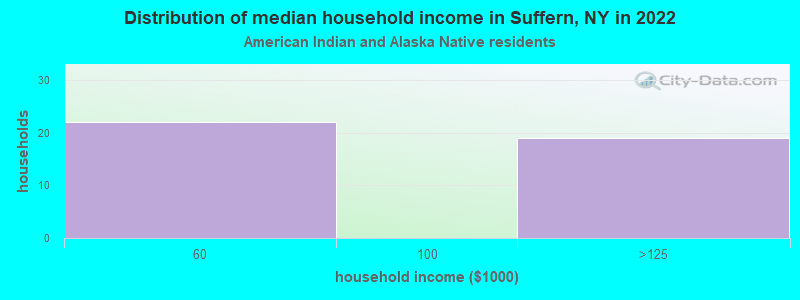
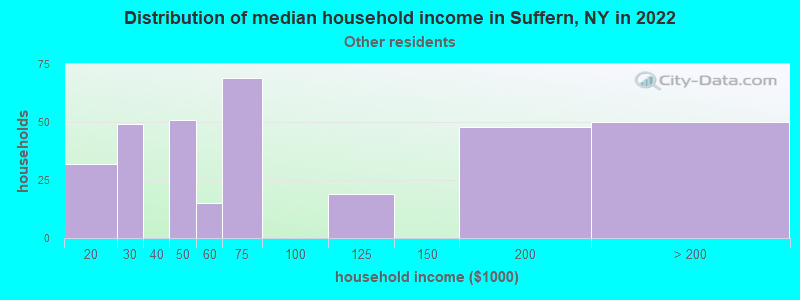
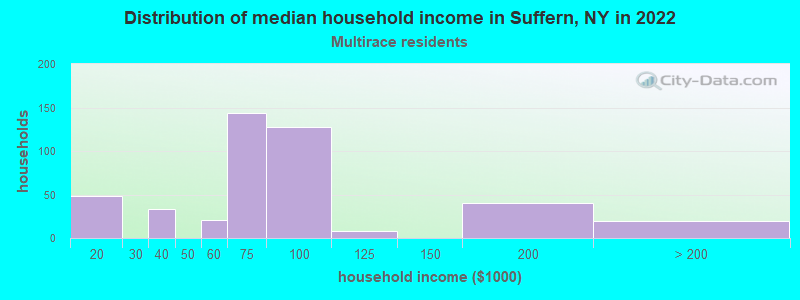
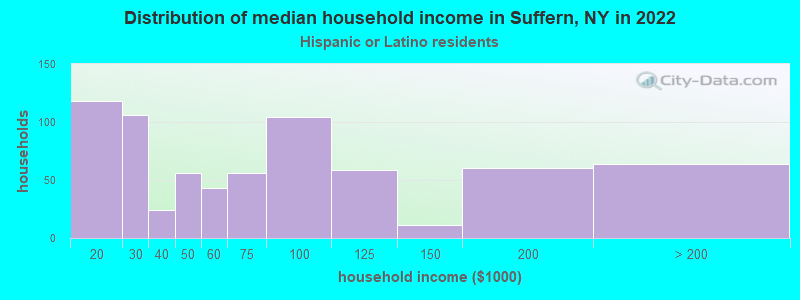
Income and house value in Suffern Median household income in 2022 $94,242 White non-Hispanic householders$99,015 Black householders$97,030 Asian householders$60,509 Some other race householders$62,899 Two or more races householders$80,649 Hispanic or Latino race householdersMedian 2022 house value $399,862 White Non-Hispanic householders$472,073 Black or African American householders$389,071 American Indian or Alaska Native householders $440,948 Asian householders$359,398 Some other race householders$412,519 Two or more races householders$389,071 Hispanic or Latino householders
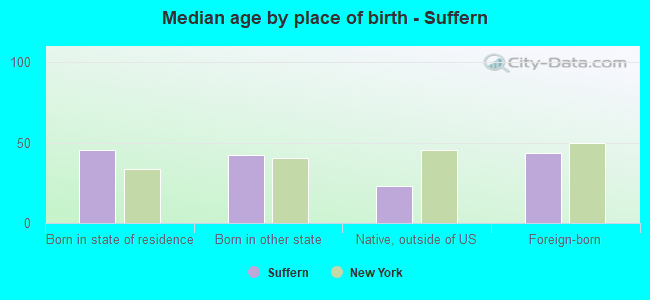
Median age by race in Suffern
50.2 Median age for White residents46.2 53.0 33.1 Median age for Black or African American residents29.2 34.9 21.5 Median age for American Indian / Alaska Native residents45.0 20.4 33.9 Median age for Asian residents40.5 28.7 -463,937,621.4 Median age for Native Hawaiian / Pacific Islander residents-649,572,648.9 -666,666,666.0 36.1 Median age for Other race residents33.7 39.0 40.4 Median age for Two or more races residents39.3 41.0 51.1 Median age for White alone residents47.7 55.7 36.1 Median age for Hispanic or Latino residents36.6 33.2
Owner/renter occupied households by race in Suffern
House owners and renters - White residents 2,618 76.9% Owner occupied785 23.1% Renter occupiedHouse owners and renters - Black or African American residents 231 55.9% Owner occupied182 44.1% Renter occupiedHouse owners and renters - American Indian / Alaska Native residents 39 100.0% Renter occupiedHouse owners and renters - Asian residents 132 81.7% Owner occupied29 18.3% Renter occupiedHouse owners and renters - Other race residents 74 27.2% Owner occupied198 72.8% Renter occupiedHouse owners and renters - Two or more races residents 197 49.1% Owner occupied205 50.9% Renter occupiedHouse owners and renters - White alone residents 2,599 78.8% Owner occupied701 21.2% Renter occupiedHouse owners and renters - Hispanic or Latino residents 231 35.4% Owner occupied421 64.6% Renter occupied
Language usage in Suffern
English speakers - Total 70.4% of residents of Suffern speak English at home.
12.6% of residents speak Spanish at home 666 48.9% Speak English very well697 51.1% Speak English less than very well17.2% of residents speak other language at home 1,143 61.4% Speak English very well719 38.6% Speak English less than very well
English speakers - Born in the United States 92.3% of residents of Suffern speak English at home.
4.0% of residents speak Spanish at home 49 80.3% Speak English very well12 19.7% Speak English less than very well5.7% of residents speak other language at home 88 100.0% Speak English very well
English speakers - Native, born elsewhere 53.7% of residents of Suffern speak English at home.
36.0% of residents speak Spanish at home 58 59.2% Speak English very well40 40.8% Speak English less than very well9.2% of residents speak other language at home 25 100.0% Speak English very well
English speakers - Foreign-born 16.2% of residents of Suffern speak English at home.
27.5% of residents speak Spanish at home 123 17.4% Speak English very well582 82.6% Speak English less than very well56.7% of residents speak other language at home 816 56.2% Speak English very well637 43.8% Speak English less than very well
White (Caucasian) - Speak only English Native:
95.2% (5,691)Foreign-born:
16.3% (109)
White (Caucasian) - Speak another language Native:
6.6% (393)Foreign-born:
79.5% (530)
Black or African American - Speak only English Native:
94.5% (644)Foreign-born:
25.6% (176)
Black or African American - Speak another language Native:
4.8% (33)Foreign-born:
74.2% (510)
American Indian / Alaska Native - Speak another language Native:
82.3% (110)Foreign-born:
100.0% (96)
Asian - Speak only English Native:
55.4% (122)Foreign-born:
9.4% (45)
Asian - Speak another language Native:
44.3% (97)Foreign-born:
89.5% (429)
Other race - Speak only English Native:
37.9% (207)Foreign-born:
5.0% (25)
Other race - Speak another language Native:
61.5% (335)Foreign-born:
94.0% (473)
Two or more races - Speak only English Native:
63.8% (404)Foreign-born:
58.5% (51)
Two or more races - Speak another language Native:
36.6% (232)Foreign-born:
53.4% (46)
White alone - Speak only English Native:
96.4% (5,551)Foreign-born:
19.5% (108)
White alone - Speak another language Native:
3.5% (199)Foreign-born:
79.3% (439)
Hispanic or Latino - Speak only English Native:
40.4% (479)Foreign-born:
5.9% (45)
Hispanic or Latino - Speak another language Native:
55.3% (655)Foreign-born:
94.2% (709)
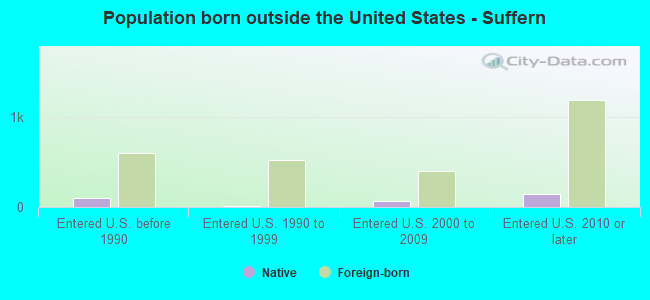
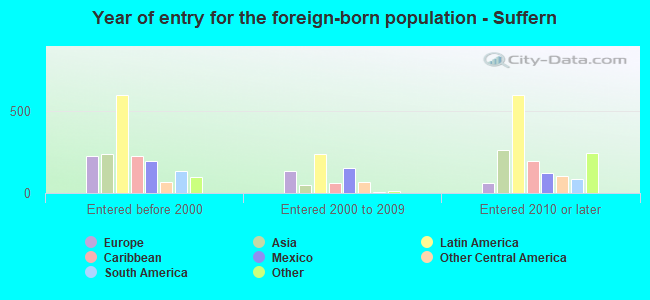
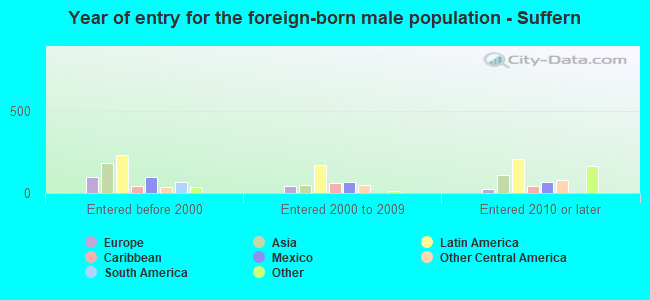
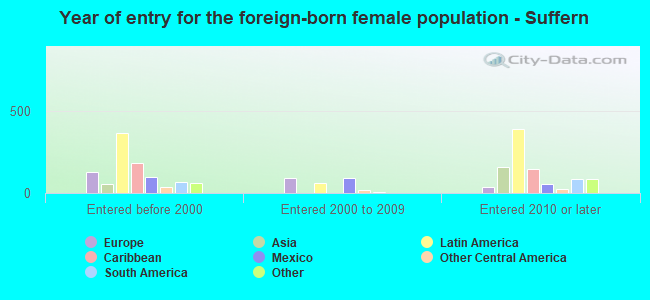
Foreign-born residents in Suffern 2,674 residents are foreign born (12.2% Latin America , 4.5% Asia , 4.3% Europe , 2.7% Africa ).
This city:
23.4%New York:
22.6%
Marital status for residents in Suffern Marital status - White (Caucasian) population 15 years and over
Males 30.9% Never married53.5% Now married1.7% Separated2.9% Widowed11.0% DivorcedFemales 28.5% Never married41.9% Now married0.8% Separated10.2% Widowed18.7% DivorcedWomen who gave birth in the past 12 months Now married:
100.0% (31)Unmarried:
0.0% (0)
Women who did not give birth in the past 12 months Now married:
45.1% (570)Unmarried:
54.9% (694)
Marital status - Black or African American population 15 years and over
Males 36.1% Never married50.1% Now married3.1% Separated0.0% Widowed10.6% DivorcedFemales 45.4% Never married32.2% Now married12.5% Separated2.7% Widowed7.3% DivorcedWomen who did not give birth in the past 12 months Now married:
38.5% (136)Unmarried:
61.5% (217)
Marital status - American Indian / Alaska Native population 15 years and over
Males 50.0% Never married50.0% Now married0.0% Separated0.0% Widowed0.0% DivorcedFemales 61.6% Never married27.7% Now married10.7% Separated0.0% Widowed0.0% DivorcedWomen who did not give birth in the past 12 months Now married:
28.1% (39)Unmarried:
71.9% (99)
Marital status - Asian population 15 years and over
Males 21.3% Never married78.4% Now married0.0% Separated0.0% Widowed0.3% DivorcedFemales 50.7% Never married46.0% Now married0.0% Separated0.0% Widowed3.3% DivorcedWomen who did not give birth in the past 12 months Now married:
39.9% (93)Unmarried:
60.1% (141)
Marital status - Other race population 15 years and over
Males 33.9% Never married63.1% Now married3.0% Separated0.0% Widowed0.0% DivorcedFemales 35.0% Never married59.2% Now married0.0% Separated3.5% Widowed2.3% DivorcedWomen who gave birth in the past 12 months Now married:
0.0% (0)Unmarried:
100.0% (11)
Women who did not give birth in the past 12 months Now married:
65.3% (142)Unmarried:
34.7% (75)
Marital status - Two or more races population 15 years and over
Males 23.1% Never married40.8% Now married10.0% Separated0.0% Widowed26.2% DivorcedFemales 51.6% Never married26.2% Now married1.8% Separated12.4% Widowed8.0% DivorcedWomen who did not give birth in the past 12 months Now married:
29.5% (54)Unmarried:
70.5% (128)
Marital status - White alone, not Hispanic / Latino population 15 years and over
Males 30.2% Never married53.3% Now married1.1% Separated3.2% Widowed12.2% DivorcedFemales 27.2% Never married41.8% Now married0.8% Separated10.9% Widowed19.2% DivorcedWomen who gave birth in the past 12 months Now married:
100.0% (32)Unmarried:
0.0% (0)
Women who did not give birth in the past 12 months Now married:
45.4% (510)Unmarried:
54.6% (612)
Marital status - Hispanic or Latino population 15 years and over
Males 35.6% Never married54.9% Now married5.5% Separated0.0% Widowed4.0% DivorcedFemales 44.6% Never married45.7% Now married1.6% Separated1.9% Widowed6.2% DivorcedWomen who gave birth in the past 12 months Now married:
0.0% (0)Unmarried:
100.0% (11)
Women who did not give birth in the past 12 months Now married:
47.9% (266)Unmarried:
52.1% (290)
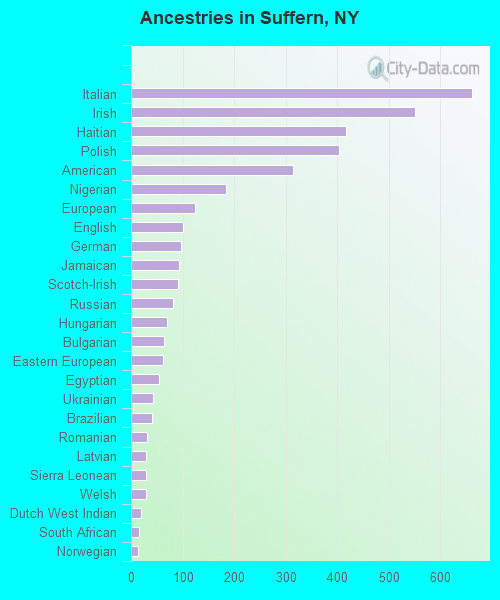
Ancestries in Suffern
661 11.5% Italian551 9.6% Irish417 7.3% Haitian404 7.0% Polish315 5.5% American184 3.2% Nigerian125 2.2% European101 1.8% English97 1.7% German93 1.6% Jamaican92 1.6% Scotch-Irish82 1.4% Russian69 1.2% Hungarian64 1.1% Bulgarian62 1.1% Eastern European54 0.9% Egyptian43 0.8% Ukrainian41 0.7% Brazilian31 0.5% Romanian30 0.5% Latvian29 0.5% Sierra Leonean29 0.5% Welsh20 0.3% Dutch West Indian15 0.3% South African13 0.2% Norwegian12 0.2% Danish10 0.2% Swedish9 0.2% Arab9 0.2% Guyanese8 0.1% British8 0.1% Croatian8 0.1% Czech8 0.1% Slavic7 0.1% Canadian7 0.1% French Canadian6 0.1% Israeli6 0.1% Dutch5 0.09% Northern European5 0.09% French4 0.07% Scottish3 0.05% Austrian
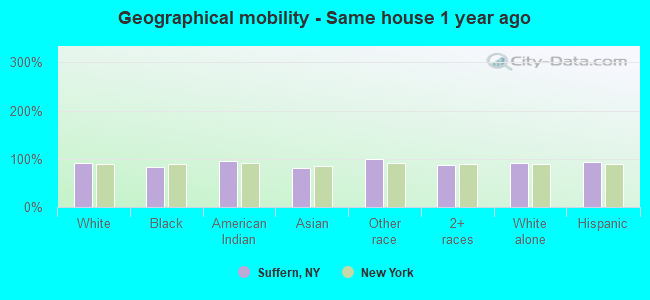
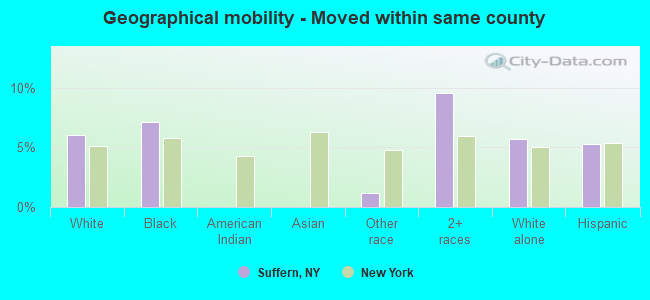
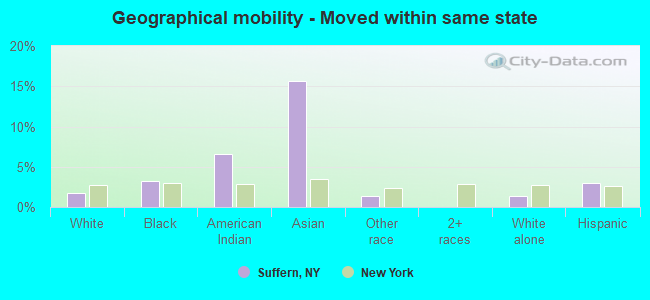
Geographical mobility in Suffern Same house 1 year ago 6,306 91.4% White (Caucasian)1,245 81.7% Black or African American216 96.1% American Indian / Alaska Native621 80.2% Asian1,116 100.0% Other race629 87.8% Two or more races5,951 92.3% White alone, not Hispanic / Latino1,993 93.4% Hispanic or LatinoMoved within same county 419 6.1% White / Caucasian108 7.1% Black or African American13 1.2% Other race68 9.5% Two or more races368 5.7% White alone, not Hispanic / Latino112 5.3% Hispanic or LatinoMoved within same state 123 1.8% White / Caucasian50 3.3% Black or African American15 6.6% American Indian / Alaska Native121 15.7% Asian15 1.4% Other race85 1.3% White alone, not Hispanic / Latino64 3.0% Hispanic or LatinoMoved from different state 27 0.4% White / Caucasian36 2.4% Black or African American27 3.5% Asian30 2.7% Other race30 0.5% White alone, not Hispanic / Latino15 0.7% Hispanic or LatinoMoved from abroad 19 0.3% White19 2.4% Asian20 2.8% Two or more races17 0.3% White alone, not Hispanic / Latino17 0.8% Hispanic or Latino
Children Nativity (place of birth) in Suffern
Children under 6 years - Living with two parents Both parents native 158 99.5% Native1 0.5% Foreign-bornBoth parents foreign-born 334 90.0% Native37 10.0% Foreign-bornOne native, one foreign-born parent 91 100.0% NativeChildren under 6 years - Living with one parent Native parent 15 100.0% NativeForeign-born parent 104 83.1% Native21 16.9% Foreign-bornChildren 6 to 17 years - Living with two parents Both parents native 689 100.0% NativeBoth parents foreign-born 193 45.9% Native227 54.1% Foreign-bornOne native, one foreign-born parent 128 100.0% NativeChildren 6 to 17 years - Living with one parent Native parent 269 100.0% NativeForeign-born parent 43 47.2% Native48 52.8% Foreign-born
Grandparents responsible for own grandchildren in Suffern
Grandparents (30 to 59 years) White / Caucasian 7 100.0% Not responsible for grandchildrenOther race 18 25.0% Responsible for grandchildren55 75.0% Not responsible for grandchildrenWhite alone, not Hispanic / Latino 8 100.0% Not responsible for grandchildrenHispanic or Latino 15 24.7% Responsible for grandchildren47 75.3% Not responsible for grandchildrenGrandparents (60 years and over) White / Caucasian 36 49.8% Responsible for grandchildren36 50.2% Not responsible for grandchildrenOther race 10 100.0% Responsible for grandchildrenWhite alone, not Hispanic / Latino 38 51.2% Responsible for grandchildren36 48.8% Not responsible for grandchildrenHispanic or Latino 11 84.5% Responsible for grandchildren2 15.5% Not responsible for grandchildren