Races in Sugar Grove, Illinois (IL) Detailed Stats
Data:
Races - White alone (%)
Races - White alone (% change since 2000)
Races - Black alone (%)
Races - Black alone (% change since 2000)
Races - American Indian alone (%)
Races - American Indian alone (% change since 2000)
Races - Asian alone (%)
Races - Asian alone (% change since 2000)
Races - Hispanic (%)
Races - Hispanic (% change since 2000)
Races - Native Hawaiian and Other Pacific Islander alone (%)
Races - Native Hawaiian and Other Pacific Islander alone (% change since 2000)
Races - Two or more races(%)
Races - Two or more races(% change since 2000)
Races - Other race alone (%)
Races - Other race alone (% change since 2000)
Racial diversity
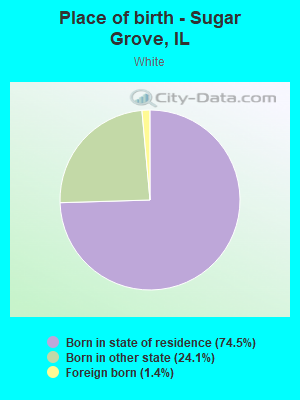
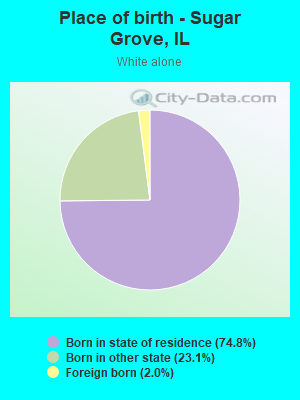
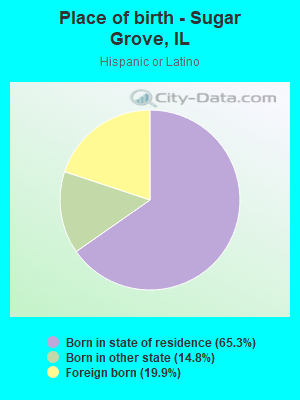
Place of birth - Born in state of residence (%)
Place of birth - Born in state of residence (%) - White
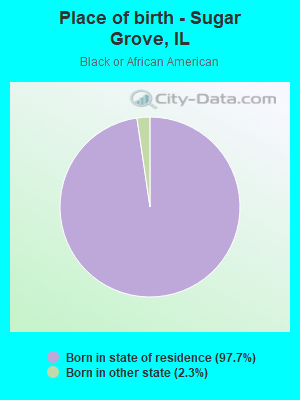
Place of birth - Born in state of residence (%) - Black or African American
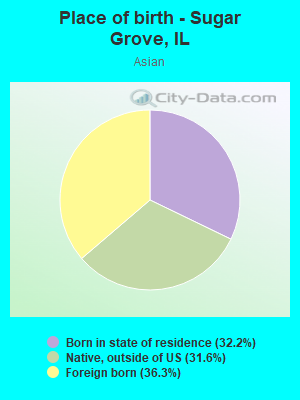
Place of birth - Born in state of residence (%) - Asian
Place of birth - Born in state of residence (%) - Hispanic or Latino
Place of birth - Born in state of residence (%) - American Indian and Alaska Native
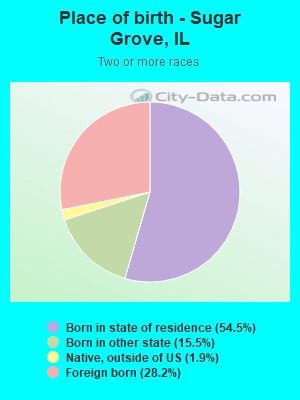
Place of birth - Born in state of residence (%) - Multirace
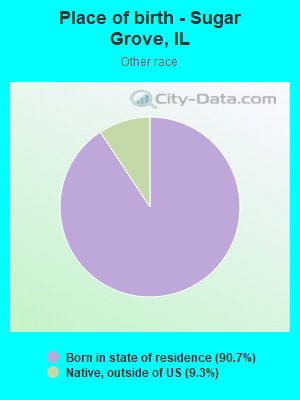
Place of birth - Born in state of residence (%) - Other Race
Place of birth - Born in other state (%)
Place of birth - Born in other state (%) - White
Place of birth - Born in other state (%) - Black or African American
Place of birth - Born in other state (%) - Asian
Place of birth - Born in other state (%) - Hispanic or Latino
Place of birth - Born in other state (%) - American Indian and Alaska Native
Place of birth - Born in other state (%) - Multirace
Place of birth - Born in other state (%) - Other Race
Place of birth - Native, outside of US (%)
Place of birth - Native, outside of US (%) - White
Place of birth - Native, outside of US (%) - Black or African American
Place of birth - Native, outside of US (%) - Asian
Place of birth - Native, outside of US (%) - Hispanic or Latino
Place of birth - Native, outside of US (%) - American Indian and Alaska Native
Place of birth - Native, outside of US (%) - Multirace
Place of birth - Native, outside of US (%) - Other Race
Place of birth - Foreign born (%)
Place of birth - Foreign born (%) - White
Place of birth - Foreign born (%) - Black or African American
Place of birth - Foreign born (%) - Asian
Place of birth - Foreign born (%) - Hispanic or Latino
Place of birth - Foreign born (%) - American Indian and Alaska Native
Place of birth - Foreign born (%) - Multirace
Place of birth - Foreign born (%) - Other Race
Residents speaking English at home (%)
Residents speaking English at home - Born in the United States (%)
Residents speaking English at home - Native, born elsewhere (%)
Residents speaking English at home - Foreign born (%)
Residents speaking Spanish at home (%)
Residents speaking Spanish at home - Born in the United States (%)
Residents speaking Spanish at home - Native, born elsewhere (%)
Residents speaking Spanish at home - Foreign born (%)
Residents speaking other language at home (%)
Residents speaking other language at home - Born in the United States (%)
Residents speaking other language at home - Native, born elsewhere (%)
Residents speaking other language at home - Foreign born (%)
Marital status - Never married (%)
Marital status - Now married (%)
Marital status - Separated (%)
Marital status - Widowed (%)
Marital status - Divorced (%)
Ancestries Reported - Arab (%)
Ancestries Reported - Czech (%)
Ancestries Reported - Danish (%)
Ancestries Reported - Dutch (%)
Ancestries Reported - English (%)
Ancestries Reported - French (%)
Ancestries Reported - French Canadian (%)
Ancestries Reported - German (%)
Ancestries Reported - Greek (%)
Ancestries Reported - Hungarian (%)
Ancestries Reported - Irish (%)
Ancestries Reported - Italian (%)
Ancestries Reported - Lithuanian (%)
Ancestries Reported - Norwegian (%)
Ancestries Reported - Polish (%)
Ancestries Reported - Portuguese (%)
Ancestries Reported - Russian (%)
Ancestries Reported - Scotch-Irish (%)
Ancestries Reported - Scottish (%)
Ancestries Reported - Slovak (%)
Ancestries Reported - Subsaharan African (%)
Ancestries Reported - Swedish (%)
Ancestries Reported - Swiss (%)
Ancestries Reported - Ukrainian (%)
Ancestries Reported - United States (%)
Ancestries Reported - Welsh (%)
Ancestries Reported - West Indian (%)
Ancestries Reported - Other (%)
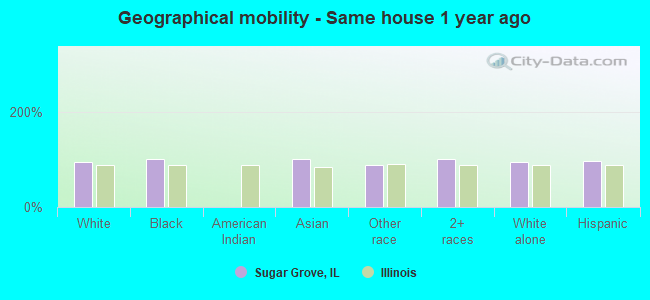
Geographical mobility - Same house 1 year ago (%)
Geographical mobility - Same house 1 year ago (%) - White
Geographical mobility - Same house 1 year ago (%) - Black or African American
Geographical mobility - Same house 1 year ago (%) - Asian
Geographical mobility - Same house 1 year ago (%) - Hispanic or Latino
Geographical mobility - Same house 1 year ago (%) - American Indian and Alaska Native
Geographical mobility - Same house 1 year ago (%) - Multirace
Geographical mobility - Same house 1 year ago (%) - Other Race
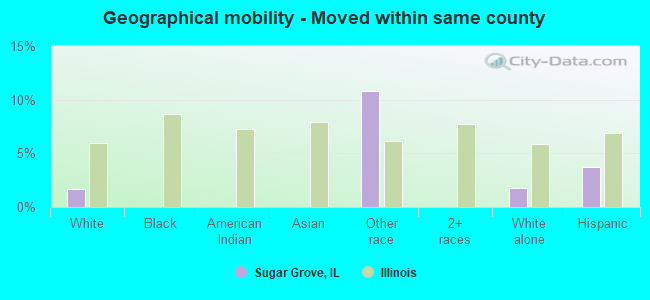
Geographical mobility - Moved within same county (%)
Geographical mobility - Moved within same county (%) - White
Geographical mobility - Moved within same county (%) - Black or African American
Geographical mobility - Moved within same county (%) - Asian
Geographical mobility - Moved within same county (%) - Hispanic or Latino
Geographical mobility - Moved within same county (%) - American Indian and Alaska Native
Geographical mobility - Moved within same county (%) - Multirace
Geographical mobility - Moved within same county (%) - Other Race
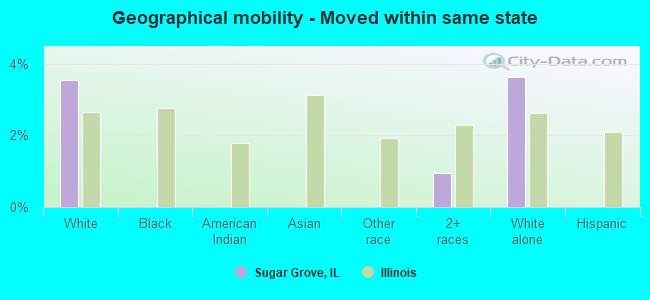
Geographical mobility - Moved from different county within same state (%)
Geographical mobility - Moved from different county within same state (%) - White
Geographical mobility - Moved from different county within same state (%) - Black or African American
Geographical mobility - Moved from different county within same state (%) - Asian
Geographical mobility - Moved from different county within same state (%) - Hispanic or Latino
Geographical mobility - Moved from different county within same state (%) - American Indian and Alaska Native
Geographical mobility - Moved from different county within same state (%) - Multirace
Geographical mobility - Moved from different county within same state (%) - Other Race
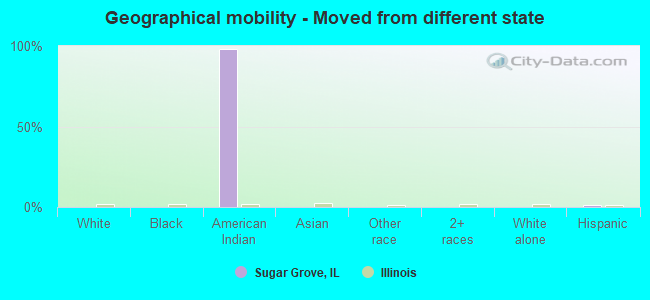
Geographical mobility - Moved from different state (%)
Geographical mobility - Moved from different state (%) - White
Geographical mobility - Moved from different state (%) - Black or African American
Geographical mobility - Moved from different state (%) - Asian
Geographical mobility - Moved from different state (%) - Hispanic or Latino
Geographical mobility - Moved from different state (%) - American Indian and Alaska Native
Geographical mobility - Moved from different state (%) - Multirace
Geographical mobility - Moved from different state (%) - Other Race
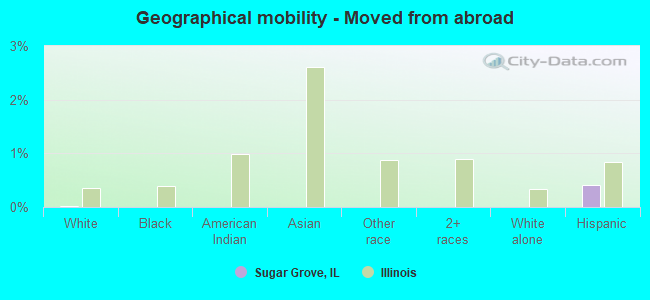
Geographical mobility - Moved from abroad (%)
Geographical mobility - Moved from abroad (%) - White
Geographical mobility - Moved from abroad (%) - Black or African American
Geographical mobility - Moved from abroad (%) - Asian
Geographical mobility - Moved from abroad (%) - Hispanic or Latino
Geographical mobility - Moved from abroad (%) - American Indian and Alaska Native
Geographical mobility - Moved from abroad (%) - Multirace
Geographical mobility - Moved from abroad (%) - Other Race
Place of birth for the foreign-born population - Ireland (%)
Place of birth for the foreign-born population - Denmark (%)
Place of birth for the foreign-born population - Norway (%)
Place of birth for the foreign-born population - Sweden (%)
Place of birth for the foreign-born population - United Kingdom (%)
Place of birth for the foreign-born population - England (%)
Place of birth for the foreign-born population - Scotland (%)
Place of birth for the foreign-born population - Other Northern Europe (%)
Place of birth for the foreign-born population - Austria (%)
Place of birth for the foreign-born population - Belgium (%)
Place of birth for the foreign-born population - France (%)
Place of birth for the foreign-born population - Germany (%)
Place of birth for the foreign-born population - Netherlands (%)
Place of birth for the foreign-born population - Switzerland (%)
Place of birth for the foreign-born population - Other Western Europe (%)
Place of birth for the foreign-born population - Greece (%)
Place of birth for the foreign-born population - Italy (%)
Place of birth for the foreign-born population - Portugal (%)
Place of birth for the foreign-born population - Spain (%)
Place of birth for the foreign-born population - Other Southern Europe (%)
Place of birth for the foreign-born population - Albania (%)
Place of birth for the foreign-born population - Belarus (%)
Place of birth for the foreign-born population - Bosnia and Herzegovina (%)
Place of birth for the foreign-born population - Bulgaria (%)
Place of birth for the foreign-born population - Croatia (%)
Place of birth for the foreign-born population - Czechoslovakia (%)
Place of birth for the foreign-born population - Hungary (%)
Place of birth for the foreign-born population - Latvia (%)
Place of birth for the foreign-born population - Lithuania (%)
Place of birth for the foreign-born population - North Macedonia (Macedonia) (%)
Place of birth for the foreign-born population - Moldova (%)
Place of birth for the foreign-born population - Poland (%)
Place of birth for the foreign-born population - Romania (%)
Place of birth for the foreign-born population - Russia (%)
Place of birth for the foreign-born population - Serbia (%)
Place of birth for the foreign-born population - Ukraine (%)
Place of birth for the foreign-born population - Other Eastern Europe (%)
Place of birth for the foreign-born population - China (%)
Place of birth for the foreign-born population - Hong Kong (%)
Place of birth for the foreign-born population - Taiwan (%)
Place of birth for the foreign-born population - Japan (%)
Place of birth for the foreign-born population - Korea (%)
Place of birth for the foreign-born population - Other Eastern Asia (%)
Place of birth for the foreign-born population - Afghanistan (%)
Place of birth for the foreign-born population - Bangladesh (%)
Place of birth for the foreign-born population - India (%)
Place of birth for the foreign-born population - Iran (%)
Place of birth for the foreign-born population - Kazakhstan (%)
Place of birth for the foreign-born population - Nepal (%)
Place of birth for the foreign-born population - Pakistan (%)
Place of birth for the foreign-born population - Sri Lanka (%)
Place of birth for the foreign-born population - Uzbekistan (%)
Place of birth for the foreign-born population - Other South Central Asia (%)
Place of birth for the foreign-born population - Burma (%)
Place of birth for the foreign-born population - Cambodia (%)
Place of birth for the foreign-born population - Indonesia (%)
Place of birth for the foreign-born population - Laos (%)
Place of birth for the foreign-born population - Malaysia (%)
Place of birth for the foreign-born population - Philippines (%)
Place of birth for the foreign-born population - Singapore (%)
Place of birth for the foreign-born population - Thailand (%)
Place of birth for the foreign-born population - Vietnam (%)
Place of birth for the foreign-born population - Other South Eastern Asia (%)
Place of birth for the foreign-born population - Armenia (%)
Place of birth for the foreign-born population - Iraq (%)
Place of birth for the foreign-born population - Israel (%)
Place of birth for the foreign-born population - Jordan (%)
Place of birth for the foreign-born population - Kuwait (%)
Place of birth for the foreign-born population - Lebanon (%)
Place of birth for the foreign-born population - Saudi Arabia (%)
Place of birth for the foreign-born population - Syria (%)
Place of birth for the foreign-born population - Turkey (%)
Place of birth for the foreign-born population - Yemen (%)
Place of birth for the foreign-born population - Other Western Asia (%)
Place of birth for the foreign-born population - Eritrea (%)
Place of birth for the foreign-born population - Ethiopia (%)
Place of birth for the foreign-born population - Kenya (%)
Place of birth for the foreign-born population - Somalia (%)
Place of birth for the foreign-born population - Uganda (%)
Place of birth for the foreign-born population - Zimbabwe (%)
Place of birth for the foreign-born population - Other Eastern Africa (%)
Place of birth for the foreign-born population - Cameroon (%)
Place of birth for the foreign-born population - Congo (%)
Place of birth for the foreign-born population - Democratic Republic of Congo (Zaire) (%)
Place of birth for the foreign-born population - Other Middle Africa (%)
Place of birth for the foreign-born population - Egypt (%)
Place of birth for the foreign-born population - Morocco (%)
Place of birth for the foreign-born population - Sudan (%)
Place of birth for the foreign-born population - Other Northern Africa (%)
Place of birth for the foreign-born population - South Africa (%)
Place of birth for the foreign-born population - Other Southern Africa (%)
Place of birth for the foreign-born population - Cabo Verde (%)
Place of birth for the foreign-born population - Ghana (%)
Place of birth for the foreign-born population - Liberia (%)
Place of birth for the foreign-born population - Nigeria (%)
Place of birth for the foreign-born population - Senegal (%)
Place of birth for the foreign-born population - Sierra Leone (%)
Place of birth for the foreign-born population - Other Western Africa (%)
Place of birth for the foreign-born population - Australia (%)
Place of birth for the foreign-born population - New Zealand (%)
Place of birth for the foreign-born population - Fiji (%)
Place of birth for the foreign-born population - Micronesia (%)
Place of birth for the foreign-born population - Bahamas (%)
Place of birth for the foreign-born population - Barbados (%)
Place of birth for the foreign-born population - Cuba (%)
Place of birth for the foreign-born population - Dominica (%)
Place of birth for the foreign-born population - Dominican Republic (%)
Place of birth for the foreign-born population - Grenada (%)
Place of birth for the foreign-born population - Haiti (%)
Place of birth for the foreign-born population - Jamaica (%)
Place of birth for the foreign-born population - St. Vincent and the Grenadines (%)
Place of birth for the foreign-born population - Trinidad and Tobago (%)
Place of birth for the foreign-born population - West Indies (%)
Place of birth for the foreign-born population - Other Caribbean (%)
Place of birth for the foreign-born population - Belize (%)
Place of birth for the foreign-born population - Costa Rica (%)
Place of birth for the foreign-born population - El Salvador (%)
Place of birth for the foreign-born population - Guatemala (%)
Place of birth for the foreign-born population - Honduras (%)
Place of birth for the foreign-born population - Mexico (%)
Place of birth for the foreign-born population - Nicaragua (%)
Place of birth for the foreign-born population - Panama (%)
Place of birth for the foreign-born population - Other Central America (%)
Place of birth for the foreign-born population - Argentina (%)
Place of birth for the foreign-born population - Bolivia (%)
Place of birth for the foreign-born population - Brazil (%)
Place of birth for the foreign-born population - Chile (%)
Place of birth for the foreign-born population - Colombia (%)
Place of birth for the foreign-born population - Ecuador (%)
Place of birth for the foreign-born population - Guyana (%)
Place of birth for the foreign-born population - Peru (%)
Place of birth for the foreign-born population - Uruguay (%)
Place of birth for the foreign-born population - Venezuela (%)
Place of birth for the foreign-born population - Other South America (%)
Place of birth for the foreign-born population - Canada (%)
Place of birth for the foreign-born population - Other Northern America (%)
Place of birth for the foreign-born population - Other (%)
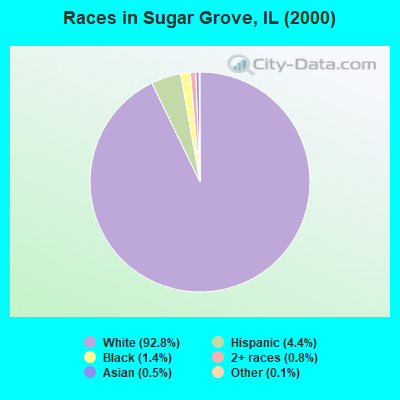
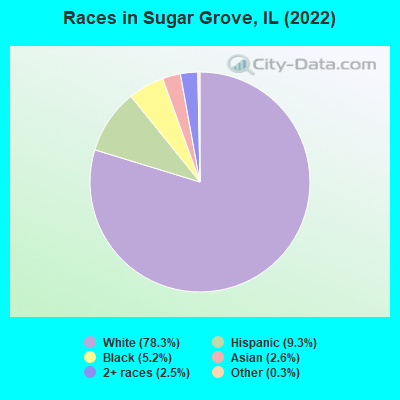
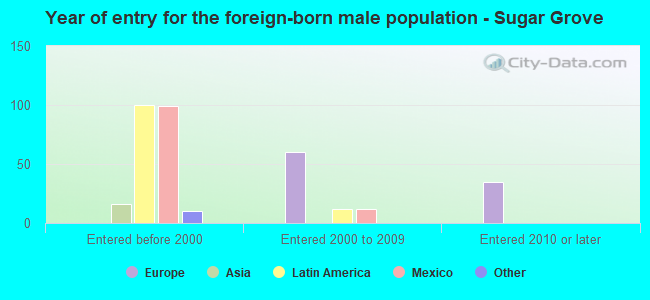
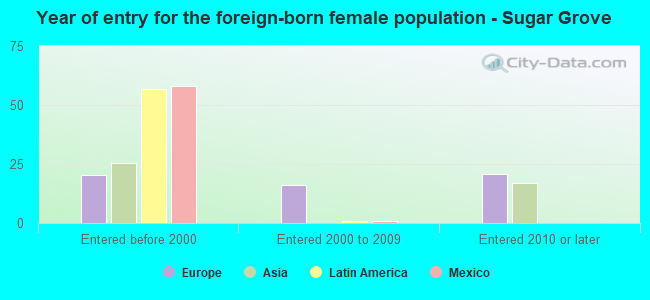
According to 2022 data, the most numerous races in Sugar Grove, IL are White alone (7,202 residents), Hispanic (856 residents), and Black alone (477 residents). 90.0% of Sugar Grove residents speak English at home. 4.0% of Sugar Grove, IL residents are foreign-born (1.8% born in Latin America, 1.4% born in Europe, 0.6% born in Asia), which is 253.7% less than the foreign-born rate of 14.0% across the entire state of Illinois.
Race distribution in Sugar Grove
2000 2022
8,424,140 67.8% White alone 1,856,152 14.9% Black alone 1,530,262 12.3% Hispanic 419,916 3.4% Asian alone 153,996 1.2% Two or more races 13,479 0.1% Other race alone 18,232 0.1% American Indian alone 3,116 0.03% Native Hawaiian and Other
7,356,301 58.5% White alone 2,299,726 18.3% Hispanic 1,660,423 13.2% Black alone 747,296 5.9% Asian alone 458,599 3.6% Two or more races 45,386 0.4% Other race alone 10,405 0.08% American Indian alone 3,896 0.03% Native Hawaiian and Other
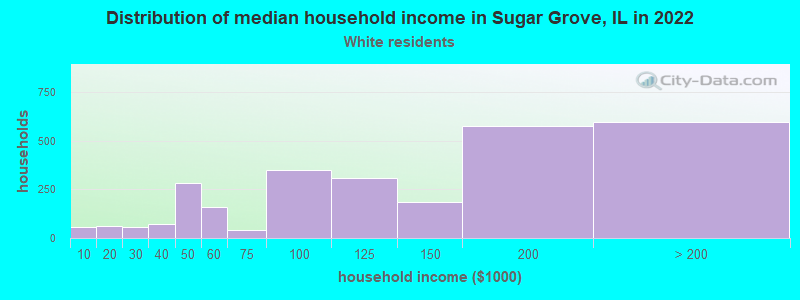
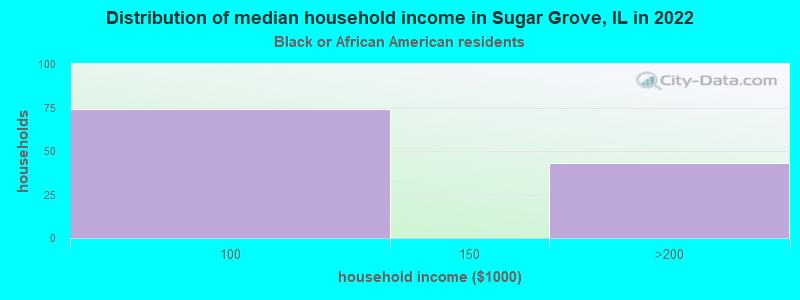
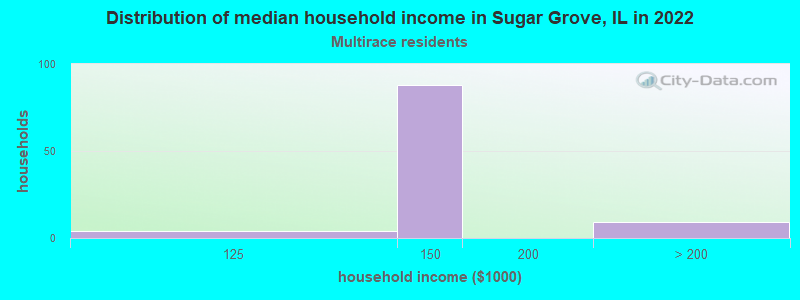
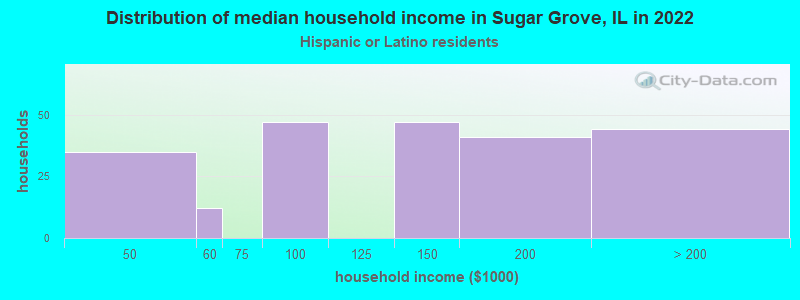
Income and house value in Sugar Grove Median household income in 2022 $113,774 White non-Hispanic householdersover $200,000 Black householders$135,569 Two or more races householders$135,012 Hispanic or Latino race householdersMedian 2022 house value $361,305 White Non-Hispanic householders$816,002 Black or African American householders$267,525 Some other race householders$322,003 Hispanic or Latino householders
Median age by race in Sugar Grove
50.0 Median age for White residents50.1 50.1 23.9 Median age for Black or African American residents23.5 55.6 -707,287,932.4 Median age for American Indian / Alaska Native residents-505,112,473.9 -949,999,999.1 63.4 Median age for Asian residents14.8 62.0 -593,236,714.4 Median age for Native Hawaiian / Pacific Islander residents-658,536,584.7 -576,015,108.0 16.7 Median age for Other race residents-709,459,458.7 15.6 21.5 Median age for Two or more races residents16.5 25.0 48.1 Median age for White alone residents48.5 47.3 18.6 Median age for Hispanic or Latino residents16.7 18.3
Owner/renter occupied households by race in Sugar Grove
House owners and renters - White residents 2,670 94.3% Owner occupied161 5.7% Renter occupiedHouse owners and renters - Black or African American residents 134 100.0% Owner occupiedHouse owners and renters - American Indian / Alaska Native residents 17 100.0% Owner occupiedHouse owners and renters - Asian residents 14 100.0% Owner occupiedHouse owners and renters - Other race residents 23 100.0% Renter occupiedHouse owners and renters - Two or more races residents 12 11.5% Owner occupied90 88.5% Renter occupiedHouse owners and renters - White alone residents 2,711 94.0% Owner occupied172 6.0% Renter occupiedHouse owners and renters - Hispanic or Latino residents 201 73.6% Owner occupied72 26.4% Renter occupied
Language usage in Sugar Grove
English speakers - Total 90.0% of residents of Sugar Grove speak English at home.
5.4% of residents speak Spanish at home 454 94.4% Speak English very well27 5.6% Speak English less than very well4.3% of residents speak other language at home 289 76.5% Speak English very well89 23.5% Speak English less than very well
English speakers - Born in the United States 96.5% of residents of Sugar Grove speak English at home.
2.4% of residents speak Spanish at home 44 100.0% Speak English very well1.5% of residents speak other language at home 27 100.0% Speak English very well
English speakers - Native, born elsewhere 81.8% of residents of Sugar Grove speak English at home.
English speakers - Foreign-born 0.0% of residents of Sugar Grove speak English at home.
42.4% of residents speak Spanish at home 144 90.6% Speak English very well15 9.4% Speak English less than very well57.1% of residents speak other language at home 131 61.2% Speak English very well83 38.8% Speak English less than very well
White (Caucasian) - Speak another language Native:
2.1% (141)Foreign-born:
89.6% (88)
Asian - Speak another language Native:
34.4% (62)Foreign-born:
100.0% (68)
Two or more races - Speak another language Native:
38.0% (149)Foreign-born:
99.3% (170)
White alone - Speak another language Native:
2.0% (139)Foreign-born:
100.0% (145)
Hispanic or Latino - Speak another language Native:
42.9% (266)Foreign-born:
98.6% (167)
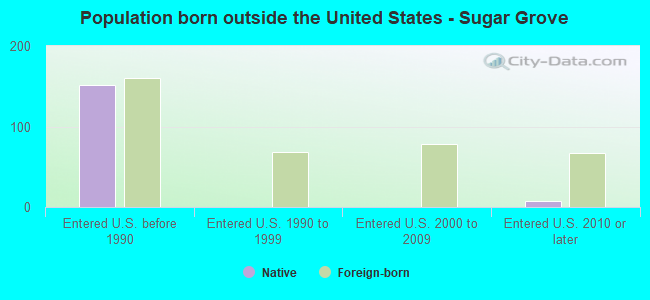
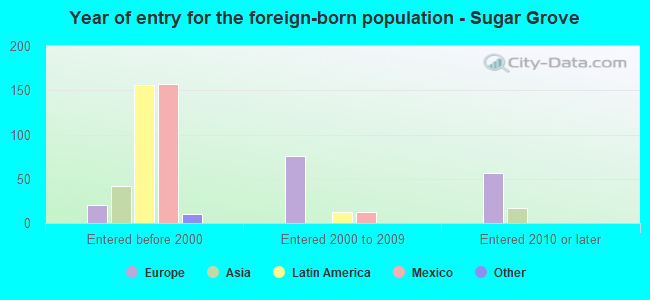
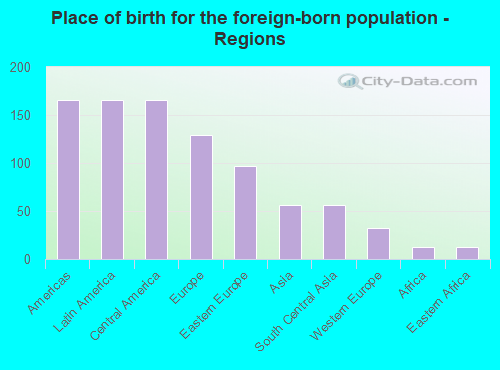
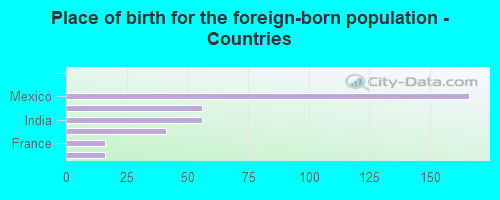
Foreign-born residents in Sugar Grove 364 residents are foreign born (1.8% Latin America , 1.4% Europe , 0.6% Asia ).
This city:
4.0%Illinois:
14.1%
Marital status for residents in Sugar Grove Marital status - White (Caucasian) population 15 years and over
Males 21.1% Never married63.2% Now married1.7% Separated5.3% Widowed8.7% DivorcedFemales 20.1% Never married57.9% Now married1.0% Separated8.2% Widowed12.7% DivorcedWomen who gave birth in the past 12 months Now married:
100.0% (44)Unmarried:
0.0% (0)
Women who did not give birth in the past 12 months Now married:
48.0% (542)Unmarried:
52.0% (586)
Marital status - Black or African American population 15 years and over
Males 72.8% Never married20.6% Now married0.0% Separated0.0% Widowed6.6% DivorcedFemales 0.0% Never married57.5% Now married0.0% Separated0.0% Widowed42.5% DivorcedWomen who did not give birth in the past 12 months Now married:
100.0% (71)Unmarried:
0.0% (0)
Marital status - Asian population 15 years and over
Males 55.6% Never married44.4% Now married0.0% Separated0.0% Widowed0.0% DivorcedFemales 11.0% Never married89.0% Now married0.0% Separated0.0% Widowed0.0% DivorcedWomen who did not give birth in the past 12 months Now married:
43.8% (16)Unmarried:
56.2% (20)
Marital status - Two or more races population 15 years and over
Males 47.2% Never married52.8% Now married0.0% Separated0.0% Widowed0.0% DivorcedFemales 21.4% Never married78.6% Now married0.0% Separated0.0% Widowed0.0% DivorcedWomen who did not give birth in the past 12 months Now married:
78.6% (156)Unmarried:
21.4% (43)
Marital status - White alone, not Hispanic / Latino population 15 years and over
Males 20.1% Never married63.9% Now married1.7% Separated5.5% Widowed8.7% DivorcedFemales 19.6% Never married59.3% Now married1.1% Separated8.6% Widowed11.4% DivorcedWomen who gave birth in the past 12 months Now married:
100.0% (51)Unmarried:
0.0% (0)
Women who did not give birth in the past 12 months Now married:
47.9% (583)Unmarried:
52.1% (633)
Marital status - Hispanic or Latino population 15 years and over
Males 47.4% Never married48.2% Now married0.0% Separated0.0% Widowed4.4% DivorcedFemales 39.2% Never married40.8% Now married0.0% Separated0.0% Widowed19.9% DivorcedWomen who did not give birth in the past 12 months Now married:
51.0% (128)Unmarried:
49.0% (122)
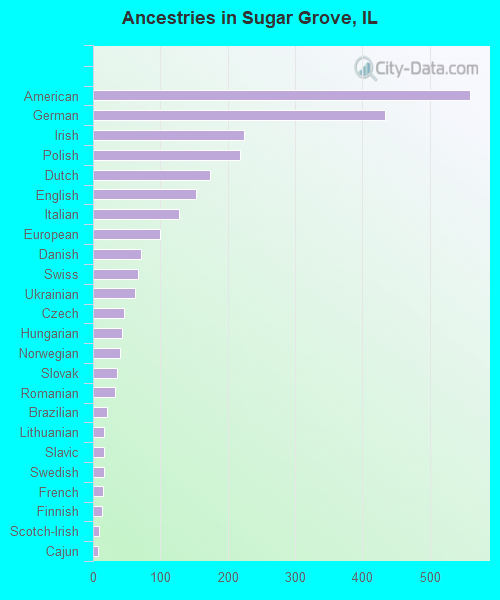
Ancestries in Sugar Grove
560 16.9% American433 13.0% German224 6.7% Irish218 6.6% Polish173 5.2% Dutch153 4.6% English128 3.9% Italian99 3.0% European71 2.1% Danish67 2.0% Swiss62 1.9% Ukrainian46 1.4% Czech43 1.3% Hungarian40 1.2% Norwegian36 1.1% Slovak32 1.0% Romanian21 0.6% Brazilian17 0.5% Lithuanian17 0.5% Slavic16 0.5% Swedish15 0.5% French13 0.4% Finnish9 0.3% Scotch-Irish7 0.2% Cajun
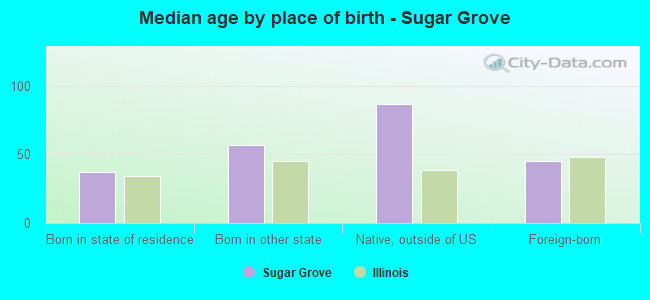
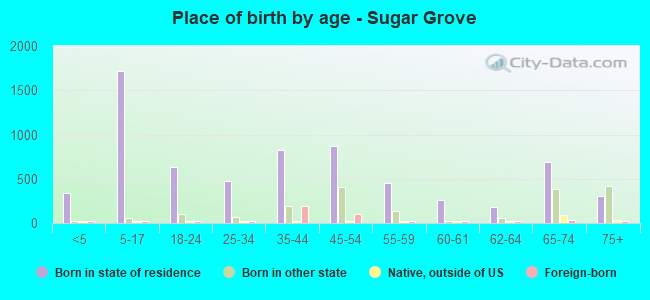
Children Nativity (place of birth) in Sugar Grove
Children under 6 years - Living with two parents Both parents native 380 100.0% NativeOne native, one foreign-born parent 18 100.0% NativeChildren under 6 years - Living with one parent Native parent 95 100.0% Native
Children 6 to 17 years - Living with two parents Both parents native 784 100.0% NativeBoth parents foreign-born 131 100.0% NativeOne native, one foreign-born parent 85 100.0% NativeChildren 6 to 17 years - Living with one parent Native parent 486 100.0% Native
Grandparents responsible for own grandchildren in Sugar Grove
Grandparents (30 to 59 years) White / Caucasian 16 100.0% Not responsible for grandchildrenBlack or African American 122 100.0% Responsible for grandchildrenWhite alone, not Hispanic / Latino 19 100.0% Not responsible for grandchildrenGrandparents (60 years and over) White / Caucasian 10 16.3% Responsible for grandchildren51 83.7% Not responsible for grandchildrenWhite alone, not Hispanic / Latino 11 14.5% Responsible for grandchildren63 85.5% Not responsible for grandchildren