Races in Sulphur Springs, Tennessee (TN) Detailed Stats
Ancestries, Foreign-born residents, place of birth
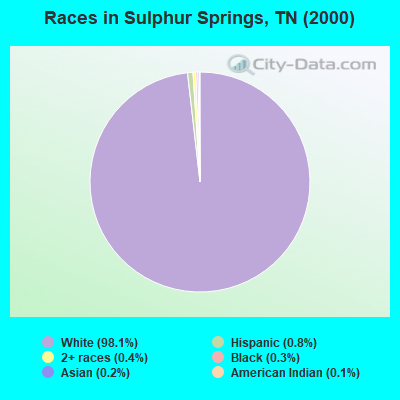
Race distribution in Sulphur Springs

- 10,51698.1%White alone
- 840.8%Hispanic
- 410.4%Two or more races
- 350.3%Black alone
- 200.2%Asian alone
- 130.1%American Indian alone
- 60.06%Other race alone
- 10.01%Native Hawaiian and Other
Pacific Islander alone
2000
2022
-
- 4,505,93079.2%White alone
- 928,20416.3%Black alone
- 123,8382.2%Hispanic
- 54,8241.0%Two or more races
- 56,0771.0%Asian alone
- 13,8200.2%American Indian alone
- 4,7800.08%Other race alone
- 1,8100.03%Native Hawaiian and Other
Pacific Islander alone

-
- 5,070,02671.9%White alone
- 1,089,73815.5%Black alone
- 442,6296.3%Hispanic
- 279,3814.0%Two or more races
- 131,8171.9%Asian alone
- 26,9720.4%Other race alone
- 6,3870.09%American Indian alone
- 4,3890.06%Native Hawaiian and Other
Pacific Islander alone

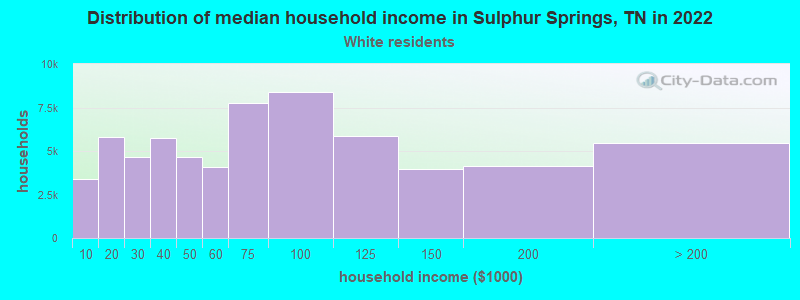
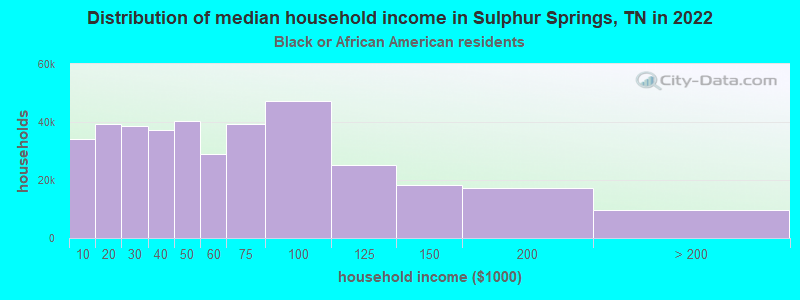
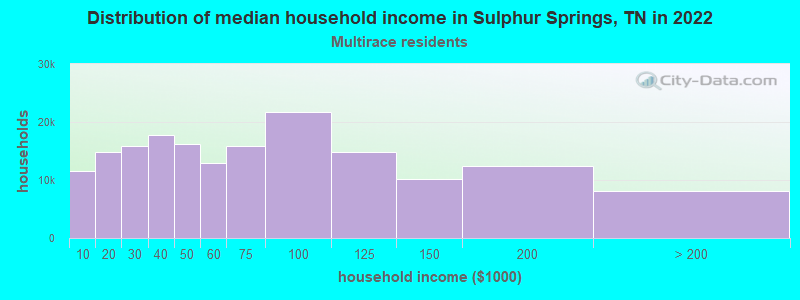
Income and house value in Sulphur Springs
- Median household income in 2022
- $84,755White non-Hispanic householders
- $69,937Black householders
- $67,468Some other race householders
- $117,824Two or more races householders
- over $200,000Hispanic or Latino race householders
- Median 2022 house value
- $311,306White Non-Hispanic householders
- $185,132Black or African American householders
- $391,625Two or more races householders
- $254,342Hispanic or Latino householders
Household income for White non-Hispanic householders
Household income for Black householders
Household income for Two or more races householders
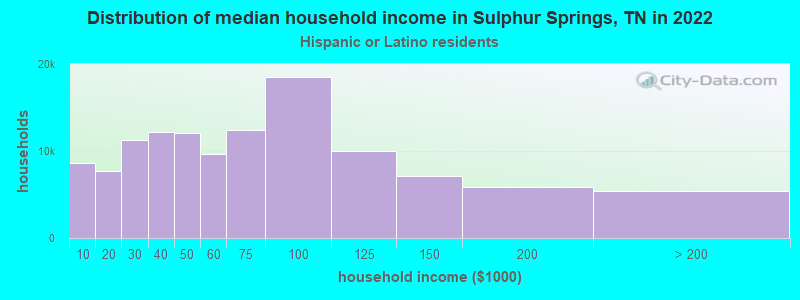
Household income for Hispanic or Latino race householders
Zip code: 37659