Races in Sunland Park, New Mexico (NM) Detailed Stats
Data:
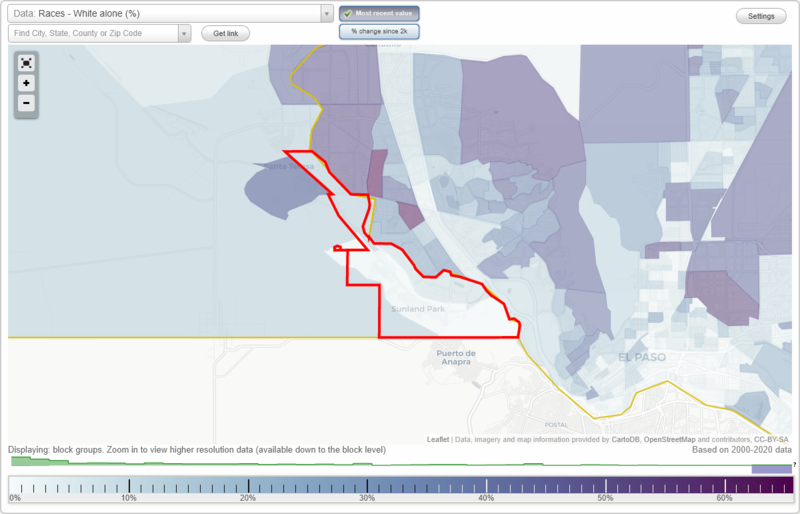
Races - White alone (%)
Races - White alone (% change since 2000)
Races - Black alone (%)
Races - Black alone (% change since 2000)
Races - American Indian alone (%)
Races - American Indian alone (% change since 2000)
Races - Asian alone (%)
Races - Asian alone (% change since 2000)
Races - Hispanic (%)
Races - Hispanic (% change since 2000)
Races - Native Hawaiian and Other Pacific Islander alone (%)
Races - Native Hawaiian and Other Pacific Islander alone (% change since 2000)
Races - Two or more races(%)
Races - Two or more races(% change since 2000)
Races - Other race alone (%)
Races - Other race alone (% change since 2000)
Racial diversity
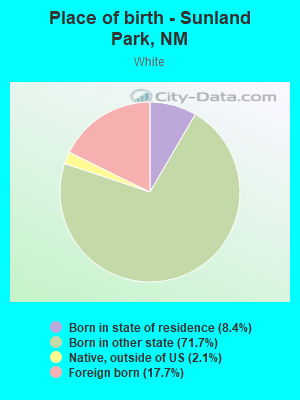
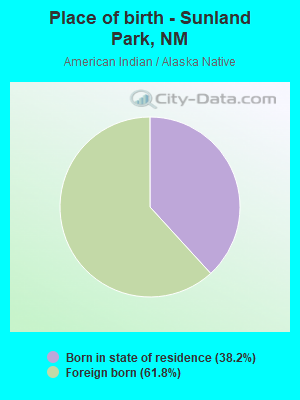
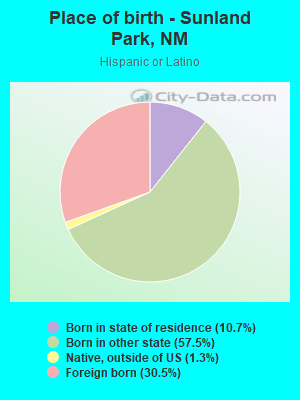
Place of birth - Born in state of residence (%)
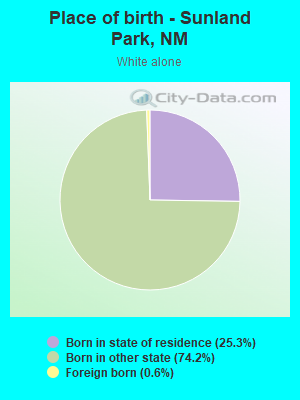
Place of birth - Born in state of residence (%) - White
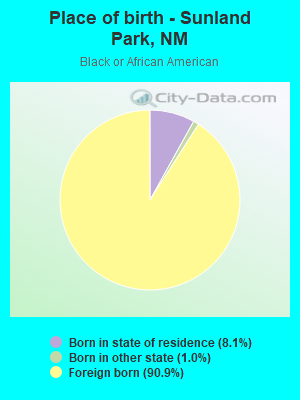
Place of birth - Born in state of residence (%) - Black or African American
Place of birth - Born in state of residence (%) - Asian
Place of birth - Born in state of residence (%) - Hispanic or Latino
Place of birth - Born in state of residence (%) - American Indian and Alaska Native
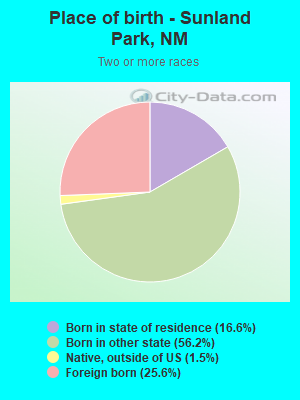
Place of birth - Born in state of residence (%) - Multirace
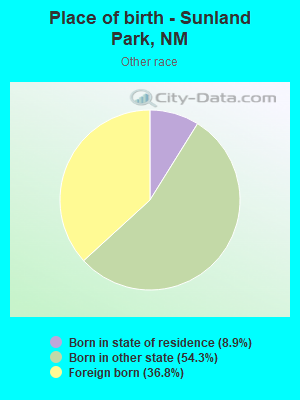
Place of birth - Born in state of residence (%) - Other Race
Place of birth - Born in other state (%)
Place of birth - Born in other state (%) - White
Place of birth - Born in other state (%) - Black or African American
Place of birth - Born in other state (%) - Asian
Place of birth - Born in other state (%) - Hispanic or Latino
Place of birth - Born in other state (%) - American Indian and Alaska Native
Place of birth - Born in other state (%) - Multirace
Place of birth - Born in other state (%) - Other Race
Place of birth - Native, outside of US (%)
Place of birth - Native, outside of US (%) - White
Place of birth - Native, outside of US (%) - Black or African American
Place of birth - Native, outside of US (%) - Asian
Place of birth - Native, outside of US (%) - Hispanic or Latino
Place of birth - Native, outside of US (%) - American Indian and Alaska Native
Place of birth - Native, outside of US (%) - Multirace
Place of birth - Native, outside of US (%) - Other Race
Place of birth - Foreign born (%)
Place of birth - Foreign born (%) - White
Place of birth - Foreign born (%) - Black or African American
Place of birth - Foreign born (%) - Asian
Place of birth - Foreign born (%) - Hispanic or Latino
Place of birth - Foreign born (%) - American Indian and Alaska Native
Place of birth - Foreign born (%) - Multirace
Place of birth - Foreign born (%) - Other Race
Residents speaking English at home (%)
Residents speaking English at home - Born in the United States (%)
Residents speaking English at home - Native, born elsewhere (%)
Residents speaking English at home - Foreign born (%)
Residents speaking Spanish at home (%)
Residents speaking Spanish at home - Born in the United States (%)
Residents speaking Spanish at home - Native, born elsewhere (%)
Residents speaking Spanish at home - Foreign born (%)
Residents speaking other language at home (%)
Residents speaking other language at home - Born in the United States (%)
Residents speaking other language at home - Native, born elsewhere (%)
Residents speaking other language at home - Foreign born (%)
Marital status - Never married (%)
Marital status - Now married (%)
Marital status - Separated (%)
Marital status - Widowed (%)
Marital status - Divorced (%)
Ancestries Reported - Arab (%)
Ancestries Reported - Czech (%)
Ancestries Reported - Danish (%)
Ancestries Reported - Dutch (%)
Ancestries Reported - English (%)
Ancestries Reported - French (%)
Ancestries Reported - French Canadian (%)
Ancestries Reported - German (%)
Ancestries Reported - Greek (%)
Ancestries Reported - Hungarian (%)
Ancestries Reported - Irish (%)
Ancestries Reported - Italian (%)
Ancestries Reported - Lithuanian (%)
Ancestries Reported - Norwegian (%)
Ancestries Reported - Polish (%)
Ancestries Reported - Portuguese (%)
Ancestries Reported - Russian (%)
Ancestries Reported - Scotch-Irish (%)
Ancestries Reported - Scottish (%)
Ancestries Reported - Slovak (%)
Ancestries Reported - Subsaharan African (%)
Ancestries Reported - Swedish (%)
Ancestries Reported - Swiss (%)
Ancestries Reported - Ukrainian (%)
Ancestries Reported - United States (%)
Ancestries Reported - Welsh (%)
Ancestries Reported - West Indian (%)
Ancestries Reported - Other (%)
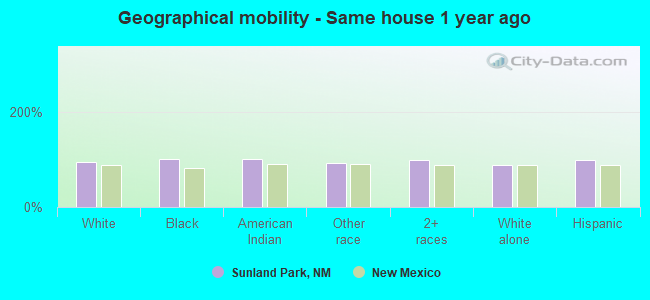
Geographical mobility - Same house 1 year ago (%)
Geographical mobility - Same house 1 year ago (%) - White
Geographical mobility - Same house 1 year ago (%) - Black or African American
Geographical mobility - Same house 1 year ago (%) - Asian
Geographical mobility - Same house 1 year ago (%) - Hispanic or Latino
Geographical mobility - Same house 1 year ago (%) - American Indian and Alaska Native
Geographical mobility - Same house 1 year ago (%) - Multirace
Geographical mobility - Same house 1 year ago (%) - Other Race
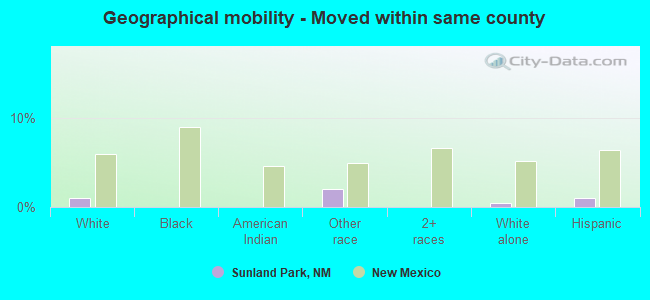
Geographical mobility - Moved within same county (%)
Geographical mobility - Moved within same county (%) - White
Geographical mobility - Moved within same county (%) - Black or African American
Geographical mobility - Moved within same county (%) - Asian
Geographical mobility - Moved within same county (%) - Hispanic or Latino
Geographical mobility - Moved within same county (%) - American Indian and Alaska Native
Geographical mobility - Moved within same county (%) - Multirace
Geographical mobility - Moved within same county (%) - Other Race
Geographical mobility - Moved from different county within same state (%)
Geographical mobility - Moved from different county within same state (%) - White
Geographical mobility - Moved from different county within same state (%) - Black or African American
Geographical mobility - Moved from different county within same state (%) - Asian
Geographical mobility - Moved from different county within same state (%) - Hispanic or Latino
Geographical mobility - Moved from different county within same state (%) - American Indian and Alaska Native
Geographical mobility - Moved from different county within same state (%) - Multirace
Geographical mobility - Moved from different county within same state (%) - Other Race
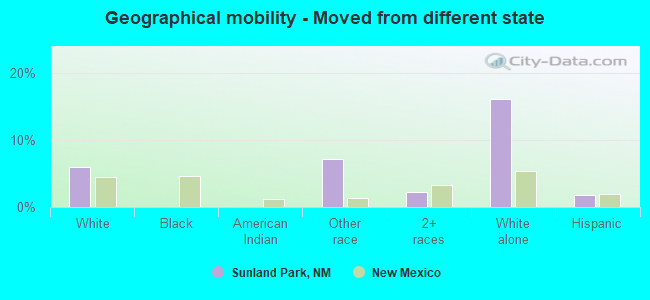
Geographical mobility - Moved from different state (%)
Geographical mobility - Moved from different state (%) - White
Geographical mobility - Moved from different state (%) - Black or African American
Geographical mobility - Moved from different state (%) - Asian
Geographical mobility - Moved from different state (%) - Hispanic or Latino
Geographical mobility - Moved from different state (%) - American Indian and Alaska Native
Geographical mobility - Moved from different state (%) - Multirace
Geographical mobility - Moved from different state (%) - Other Race
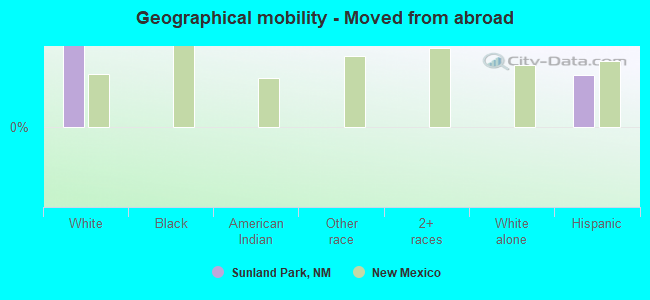
Geographical mobility - Moved from abroad (%)
Geographical mobility - Moved from abroad (%) - White
Geographical mobility - Moved from abroad (%) - Black or African American
Geographical mobility - Moved from abroad (%) - Asian
Geographical mobility - Moved from abroad (%) - Hispanic or Latino
Geographical mobility - Moved from abroad (%) - American Indian and Alaska Native
Geographical mobility - Moved from abroad (%) - Multirace
Geographical mobility - Moved from abroad (%) - Other Race
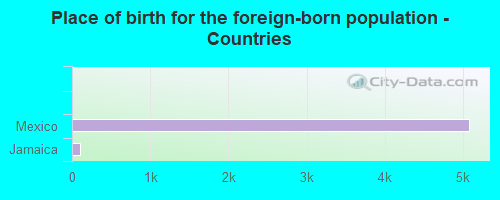
Place of birth for the foreign-born population - Ireland (%)
Place of birth for the foreign-born population - Denmark (%)
Place of birth for the foreign-born population - Norway (%)
Place of birth for the foreign-born population - Sweden (%)
Place of birth for the foreign-born population - United Kingdom (%)
Place of birth for the foreign-born population - England (%)
Place of birth for the foreign-born population - Scotland (%)
Place of birth for the foreign-born population - Other Northern Europe (%)
Place of birth for the foreign-born population - Austria (%)
Place of birth for the foreign-born population - Belgium (%)
Place of birth for the foreign-born population - France (%)
Place of birth for the foreign-born population - Germany (%)
Place of birth for the foreign-born population - Netherlands (%)
Place of birth for the foreign-born population - Switzerland (%)
Place of birth for the foreign-born population - Other Western Europe (%)
Place of birth for the foreign-born population - Greece (%)
Place of birth for the foreign-born population - Italy (%)
Place of birth for the foreign-born population - Portugal (%)
Place of birth for the foreign-born population - Spain (%)
Place of birth for the foreign-born population - Other Southern Europe (%)
Place of birth for the foreign-born population - Albania (%)
Place of birth for the foreign-born population - Belarus (%)
Place of birth for the foreign-born population - Bosnia and Herzegovina (%)
Place of birth for the foreign-born population - Bulgaria (%)
Place of birth for the foreign-born population - Croatia (%)
Place of birth for the foreign-born population - Czechoslovakia (%)
Place of birth for the foreign-born population - Hungary (%)
Place of birth for the foreign-born population - Latvia (%)
Place of birth for the foreign-born population - Lithuania (%)
Place of birth for the foreign-born population - North Macedonia (Macedonia) (%)
Place of birth for the foreign-born population - Moldova (%)
Place of birth for the foreign-born population - Poland (%)
Place of birth for the foreign-born population - Romania (%)
Place of birth for the foreign-born population - Russia (%)
Place of birth for the foreign-born population - Serbia (%)
Place of birth for the foreign-born population - Ukraine (%)
Place of birth for the foreign-born population - Other Eastern Europe (%)
Place of birth for the foreign-born population - China (%)
Place of birth for the foreign-born population - Hong Kong (%)
Place of birth for the foreign-born population - Taiwan (%)
Place of birth for the foreign-born population - Japan (%)
Place of birth for the foreign-born population - Korea (%)
Place of birth for the foreign-born population - Other Eastern Asia (%)
Place of birth for the foreign-born population - Afghanistan (%)
Place of birth for the foreign-born population - Bangladesh (%)
Place of birth for the foreign-born population - India (%)
Place of birth for the foreign-born population - Iran (%)
Place of birth for the foreign-born population - Kazakhstan (%)
Place of birth for the foreign-born population - Nepal (%)
Place of birth for the foreign-born population - Pakistan (%)
Place of birth for the foreign-born population - Sri Lanka (%)
Place of birth for the foreign-born population - Uzbekistan (%)
Place of birth for the foreign-born population - Other South Central Asia (%)
Place of birth for the foreign-born population - Burma (%)
Place of birth for the foreign-born population - Cambodia (%)
Place of birth for the foreign-born population - Indonesia (%)
Place of birth for the foreign-born population - Laos (%)
Place of birth for the foreign-born population - Malaysia (%)
Place of birth for the foreign-born population - Philippines (%)
Place of birth for the foreign-born population - Singapore (%)
Place of birth for the foreign-born population - Thailand (%)
Place of birth for the foreign-born population - Vietnam (%)
Place of birth for the foreign-born population - Other South Eastern Asia (%)
Place of birth for the foreign-born population - Armenia (%)
Place of birth for the foreign-born population - Iraq (%)
Place of birth for the foreign-born population - Israel (%)
Place of birth for the foreign-born population - Jordan (%)
Place of birth for the foreign-born population - Kuwait (%)
Place of birth for the foreign-born population - Lebanon (%)
Place of birth for the foreign-born population - Saudi Arabia (%)
Place of birth for the foreign-born population - Syria (%)
Place of birth for the foreign-born population - Turkey (%)
Place of birth for the foreign-born population - Yemen (%)
Place of birth for the foreign-born population - Other Western Asia (%)
Place of birth for the foreign-born population - Eritrea (%)
Place of birth for the foreign-born population - Ethiopia (%)
Place of birth for the foreign-born population - Kenya (%)
Place of birth for the foreign-born population - Somalia (%)
Place of birth for the foreign-born population - Uganda (%)
Place of birth for the foreign-born population - Zimbabwe (%)
Place of birth for the foreign-born population - Other Eastern Africa (%)
Place of birth for the foreign-born population - Cameroon (%)
Place of birth for the foreign-born population - Congo (%)
Place of birth for the foreign-born population - Democratic Republic of Congo (Zaire) (%)
Place of birth for the foreign-born population - Other Middle Africa (%)
Place of birth for the foreign-born population - Egypt (%)
Place of birth for the foreign-born population - Morocco (%)
Place of birth for the foreign-born population - Sudan (%)
Place of birth for the foreign-born population - Other Northern Africa (%)
Place of birth for the foreign-born population - South Africa (%)
Place of birth for the foreign-born population - Other Southern Africa (%)
Place of birth for the foreign-born population - Cabo Verde (%)
Place of birth for the foreign-born population - Ghana (%)
Place of birth for the foreign-born population - Liberia (%)
Place of birth for the foreign-born population - Nigeria (%)
Place of birth for the foreign-born population - Senegal (%)
Place of birth for the foreign-born population - Sierra Leone (%)
Place of birth for the foreign-born population - Other Western Africa (%)
Place of birth for the foreign-born population - Australia (%)
Place of birth for the foreign-born population - New Zealand (%)
Place of birth for the foreign-born population - Fiji (%)
Place of birth for the foreign-born population - Micronesia (%)
Place of birth for the foreign-born population - Bahamas (%)
Place of birth for the foreign-born population - Barbados (%)
Place of birth for the foreign-born population - Cuba (%)
Place of birth for the foreign-born population - Dominica (%)
Place of birth for the foreign-born population - Dominican Republic (%)
Place of birth for the foreign-born population - Grenada (%)
Place of birth for the foreign-born population - Haiti (%)
Place of birth for the foreign-born population - Jamaica (%)
Place of birth for the foreign-born population - St. Vincent and the Grenadines (%)
Place of birth for the foreign-born population - Trinidad and Tobago (%)
Place of birth for the foreign-born population - West Indies (%)
Place of birth for the foreign-born population - Other Caribbean (%)
Place of birth for the foreign-born population - Belize (%)
Place of birth for the foreign-born population - Costa Rica (%)
Place of birth for the foreign-born population - El Salvador (%)
Place of birth for the foreign-born population - Guatemala (%)
Place of birth for the foreign-born population - Honduras (%)
Place of birth for the foreign-born population - Mexico (%)
Place of birth for the foreign-born population - Nicaragua (%)
Place of birth for the foreign-born population - Panama (%)
Place of birth for the foreign-born population - Other Central America (%)
Place of birth for the foreign-born population - Argentina (%)
Place of birth for the foreign-born population - Bolivia (%)
Place of birth for the foreign-born population - Brazil (%)
Place of birth for the foreign-born population - Chile (%)
Place of birth for the foreign-born population - Colombia (%)
Place of birth for the foreign-born population - Ecuador (%)
Place of birth for the foreign-born population - Guyana (%)
Place of birth for the foreign-born population - Peru (%)
Place of birth for the foreign-born population - Uruguay (%)
Place of birth for the foreign-born population - Venezuela (%)
Place of birth for the foreign-born population - Other South America (%)
Place of birth for the foreign-born population - Canada (%)
Place of birth for the foreign-born population - Other Northern America (%)
Place of birth for the foreign-born population - Other (%)
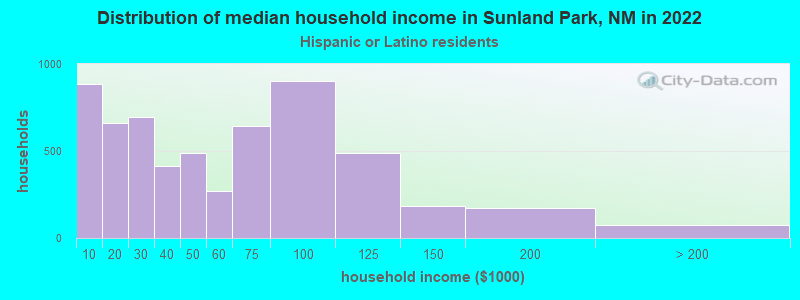
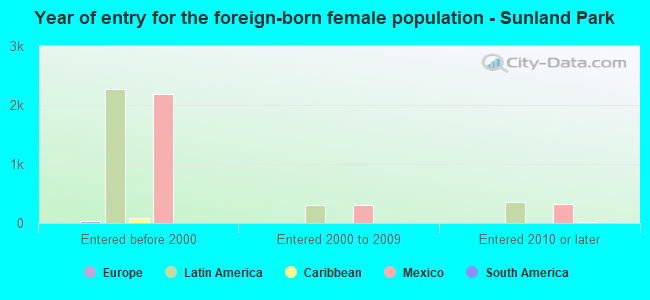
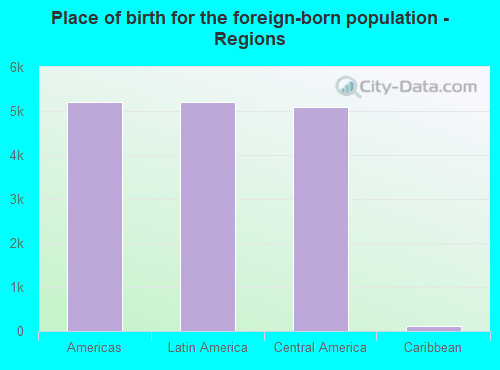
According to 2022 data, the most numerous races in Sunland Park, NM are Hispanic (16,111 residents), White alone (735 residents), and American Indian alone (32 residents). 16.0% of Sunland Park residents speak English at home. 31.0% of Sunland Park, NM residents are foreign-born (30.4% born in Latin America), which is 70.9% greater than the foreign-born rate of 9.0% across the entire state of New Mexico.
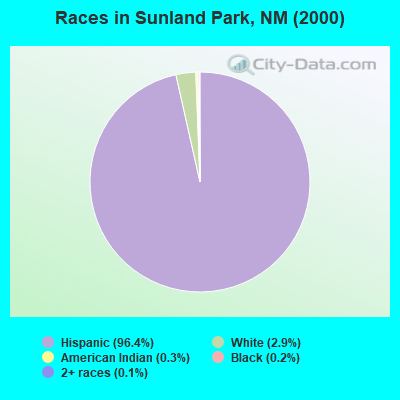
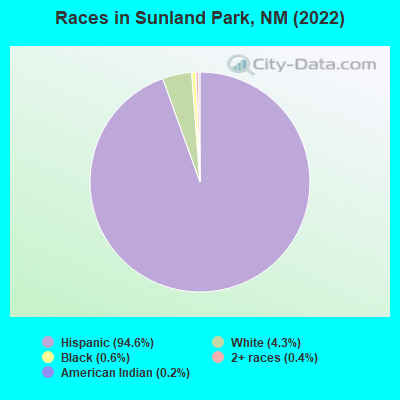
Race distribution in Sunland Park
2000 2022
813,495 44.7% White alone 765,386 42.1% Hispanic 161,460 8.9% American Indian alone 30,654 1.7% Black alone 25,793 1.4% Two or more races 18,257 1.0% Asian alone 3,009 0.2% Other race alone 992 0.05% Native Hawaiian and Other
1,059,867 50.2% Hispanic 735,478 34.8% White alone 171,808 8.1% American Indian alone 65,084 3.1% Two or more races 36,870 1.7% Black alone 35,870 1.7% Asian alone 7,582 0.4% Other race alone 785 0.04% Native Hawaiian and Other
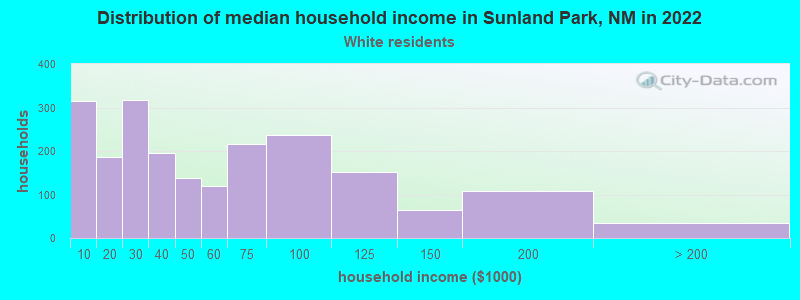
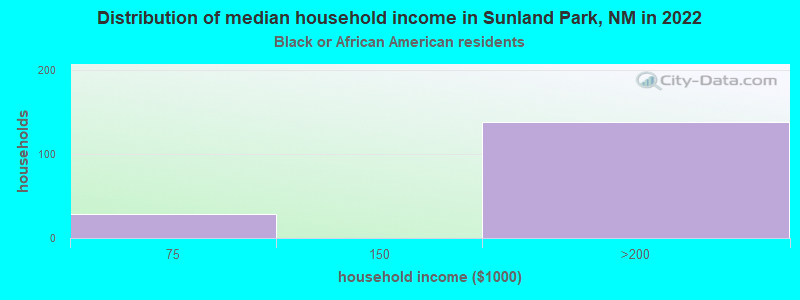
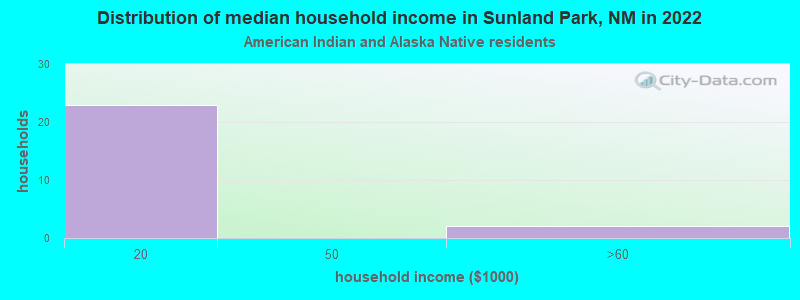
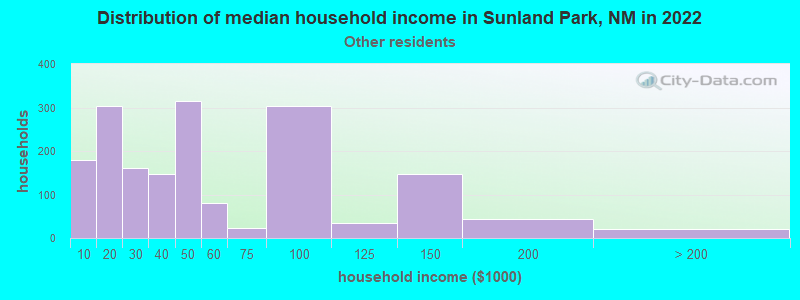
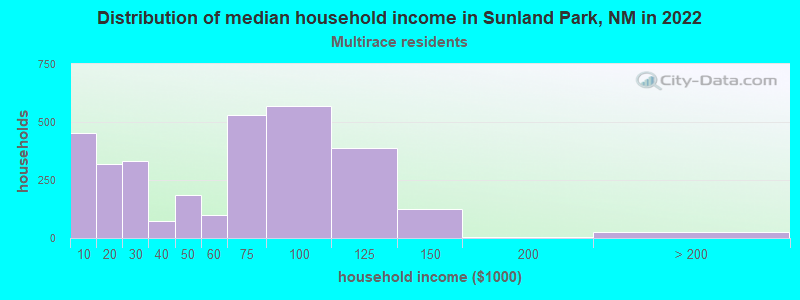
Income and house value in Sunland Park Median household income in 2022 $15,919 American Indian and Alaska Native householders$42,243 Some other race householders$57,012 Two or more races householders$46,035 Hispanic or Latino race householdersMedian 2022 house value $326,436 White Non-Hispanic householders$658,869 American Indian or Alaska Native householders$243,756 Some other race householders$259,606 Two or more races householders$248,468 Hispanic or Latino householders
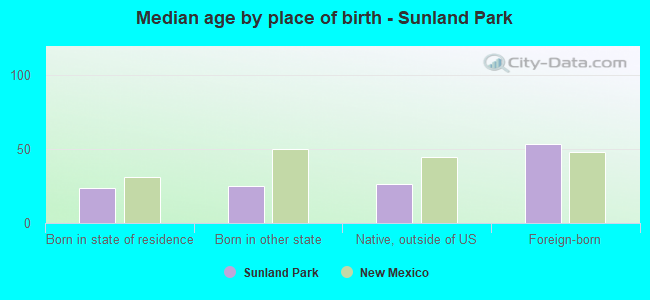
Median age by race in Sunland Park
33.6 Median age for White residents36.6 30.3 64.2 Median age for Black or African American residents48.3 -500,512,820.0 76.4 Median age for American Indian / Alaska Native residents29.4 67.0 -705,754,613.8 Median age for Asian residents-713,725,489.5 -695,364,237.7 -383,394,383.0 Median age for Native Hawaiian / Pacific Islander residents-685,897,435.2 -663,565,890.8 24.7 Median age for Other race residents22.7 32.3 42.6 Median age for Two or more races residents40.4 44.7 24.0 Median age for White alone residents22.9 24.2 33.5 Median age for Hispanic or Latino residents33.5 33.9
Owner/renter occupied households by race in Sunland Park
House owners and renters - White residents 1,764 83.7% Owner occupied344 16.3% Renter occupiedHouse owners and renters - Black or African American residents 191 87.4% Owner occupied27 12.6% Renter occupiedHouse owners and renters - American Indian / Alaska Native residents 37 100.0% Owner occupiedHouse owners and renters - Other race residents 1,322 76.1% Owner occupied416 23.9% Renter occupiedHouse owners and renters - Two or more races residents 2,594 81.7% Owner occupied581 18.3% Renter occupiedHouse owners and renters - White alone residents 203 65.7% Owner occupied106 34.3% Renter occupiedHouse owners and renters - Hispanic or Latino residents 4,859 82.0% Owner occupied1,068 18.0% Renter occupied
Language usage in Sunland Park
English speakers - Total 16.0% of residents of Sunland Park speak English at home.
87.3% of residents speak Spanish at home 5,519 40.8% Speak English very well7,992 59.2% Speak English less than very well0.9% of residents speak other language at home 137 100.0% Speak English very well
English speakers - Born in the United States 21.0% of residents of Sunland Park speak English at home.
79.4% of residents speak Spanish at home 3,565 53.6% Speak English very well3,085 46.4% Speak English less than very well
English speakers - Native, born elsewhere 35.9% of residents of Sunland Park speak English at home.
58.6% of residents speak Spanish at home 122 87.8% Speak English very well17 12.2% Speak English less than very well
English speakers - Foreign-born 4.8% of residents of Sunland Park speak English at home.
93.3% of residents speak Spanish at home 941 20.5% Speak English very well3,654 79.5% Speak English less than very well1.8% of residents speak other language at home 87 100.0% Speak English very well
White (Caucasian) - Speak only English Native:
31.9% (1,238)Foreign-born:
9.2% (93)
White (Caucasian) - Speak another language Native:
49.8% (1,931)Foreign-born:
100.0% (1,012)
Black or African American - Speak another language Native:
87.1% (7)Foreign-born:
59.1% (61)
American Indian / Alaska Native - Speak another language Native:
81.6% (23)Foreign-born:
84.9% (36)
Other race - Speak only English Native:
15.1% (422)Foreign-born:
0.6% (13)
Other race - Speak another language Native:
84.0% (2,352)Foreign-born:
100.0% (2,007)
Two or more races - Speak only English Native:
15.6% (702)Foreign-born:
8.0% (133)
Two or more races - Speak another language Native:
80.4% (3,623)Foreign-born:
91.9% (1,528)
White alone - Speak only English Native:
91.2% (550)Foreign-born:
100.0% (4)
Hispanic or Latino - Speak only English Native:
17.5% (1,714)Foreign-born:
3.3% (156)
Hispanic or Latino - Speak another language Native:
81.7% (7,986)Foreign-born:
96.8% (4,598)
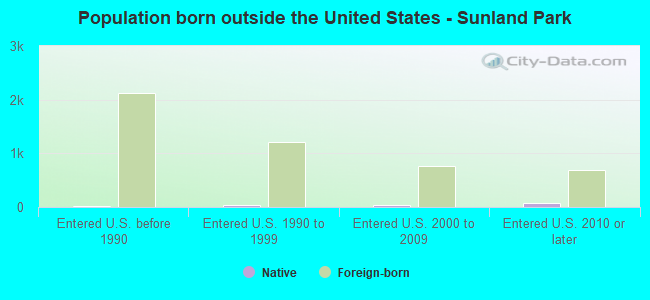
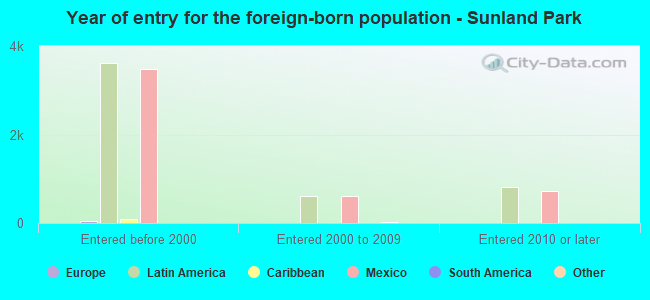
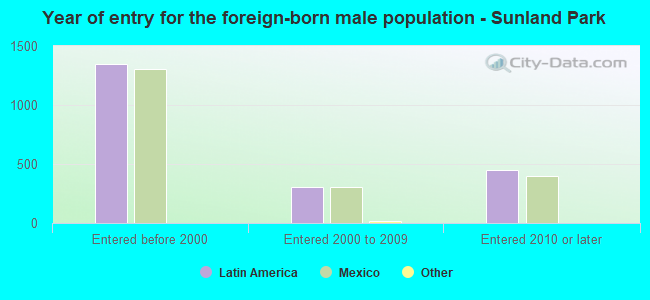
Foreign-born residents in Sunland Park 5,274 residents are foreign born (30.4% Latin America ).
This city:
31.0%New Mexico:
9.2%
Marital status for residents in Sunland Park Marital status - White (Caucasian) population 15 years and over
Males 40.8% Never married48.3% Now married2.9% Separated0.4% Widowed7.5% DivorcedFemales 41.7% Never married39.1% Now married3.6% Separated10.0% Widowed5.6% DivorcedWomen who gave birth in the past 12 months Now married:
0.0% (0)Unmarried:
100.0% (54)
Women who did not give birth in the past 12 months Now married:
32.7% (444)Unmarried:
67.3% (915)
Marital status - Black or African American population 15 years and over
Males 97.4% Never married0.0% Now married0.0% Separated0.0% Widowed2.6% DivorcedFemales 100.0% Never married0.0% Now married0.0% Separated0.0% Widowed0.0% DivorcedMarital status - American Indian / Alaska Native population 15 years and over
Males 58.8% Never married41.2% Now married0.0% Separated0.0% Widowed0.0% DivorcedFemales 0.0% Never married56.5% Now married0.0% Separated43.5% Widowed0.0% DivorcedMarital status - Other race population 15 years and over
Males 53.9% Never married32.4% Now married7.1% Separated2.8% Widowed3.8% DivorcedFemales 35.8% Never married32.0% Now married8.5% Separated11.1% Widowed12.7% DivorcedWomen who gave birth in the past 12 months Now married:
64.7% (128)Unmarried:
35.3% (70)
Women who did not give birth in the past 12 months Now married:
39.9% (502)Unmarried:
60.1% (755)
Marital status - Two or more races population 15 years and over
Males 39.0% Never married47.8% Now married3.5% Separated5.6% Widowed4.1% DivorcedFemales 43.1% Never married46.7% Now married2.1% Separated3.5% Widowed4.6% DivorcedWomen who gave birth in the past 12 months Now married:
2.6% (10)Unmarried:
97.4% (359)
Women who did not give birth in the past 12 months Now married:
51.9% (808)Unmarried:
48.1% (750)
Marital status - White alone, not Hispanic / Latino population 15 years and over
Males 42.2% Never married38.3% Now married0.0% Separated4.7% Widowed14.8% DivorcedFemales 47.0% Never married43.4% Now married5.6% Separated0.0% Widowed3.9% DivorcedWomen who did not give birth in the past 12 months Now married:
36.6% (87)Unmarried:
63.4% (151)
Marital status - Hispanic or Latino population 15 years and over
Males 43.2% Never married45.0% Now married4.2% Separated2.4% Widowed5.3% DivorcedFemales 40.8% Never married39.4% Now married4.1% Separated8.7% Widowed7.0% DivorcedWomen who gave birth in the past 12 months Now married:
18.0% (87)Unmarried:
82.0% (395)
Women who did not give birth in the past 12 months Now married:
39.1% (1,462)Unmarried:
60.9% (2,276)
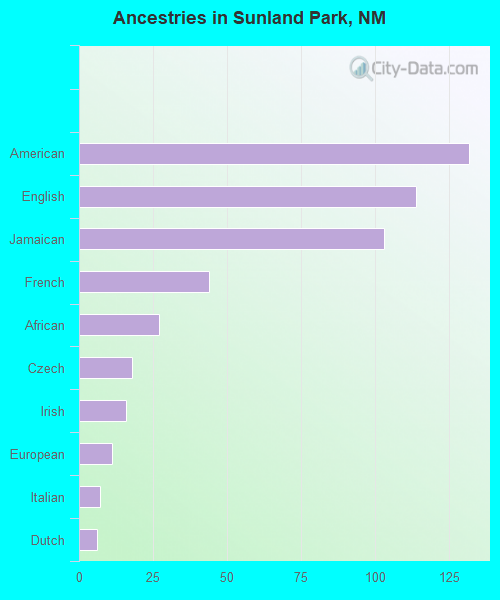
Ancestries in Sunland Park
132 0.9% American114 0.8% English103 0.7% Jamaican44 0.3% French27 0.2% African18 0.1% Czech16 0.1% Irish11 0.08% European7 0.05% Italian6 0.04% Dutch
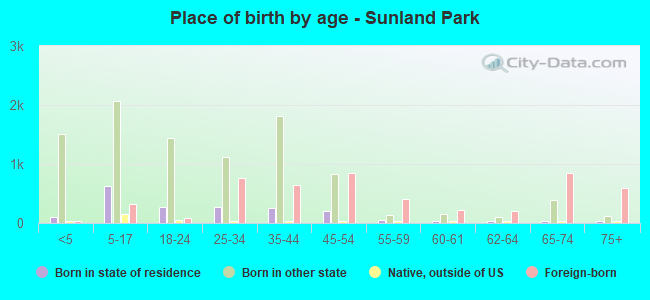
Children Nativity (place of birth) in Sunland Park
Children under 6 years - Living with two parents Both parents native 89 100.0% NativeBoth parents foreign-born 99 100.0% NativeOne native, one foreign-born parent 376 100.0% NativeChildren under 6 years - Living with one parent Native parent 1,134 100.0% NativeForeign-born parent 229 74.1% Native80 25.9% Foreign-bornChildren 6 to 17 years - Living with two parents Both parents native 507 100.0% NativeBoth parents foreign-born 359 75.7% Native115 24.3% Foreign-bornOne native, one foreign-born parent 427 100.0% NativeChildren 6 to 17 years - Living with one parent Native parent 677 100.0% NativeForeign-born parent 612 59.0% Native424 41.0% Foreign-born
Grandparents responsible for own grandchildren in Sunland Park
Grandparents (30 to 59 years) White / Caucasian 26 17.0% Responsible for grandchildren129 83.0% Not responsible for grandchildrenOther race 14 100.0% Not responsible for grandchildrenHispanic or Latino 49 17.3% Responsible for grandchildren232 82.7% Not responsible for grandchildrenGrandparents (60 years and over) White / Caucasian 12 19.4% Responsible for grandchildren51 80.6% Not responsible for grandchildrenOther race 26 79.4% Responsible for grandchildren7 20.6% Not responsible for grandchildrenHispanic or Latino 52 44.4% Responsible for grandchildren65 55.6% Not responsible for grandchildren