Races in Suquamish, Washington (WA) Detailed Stats
Data:
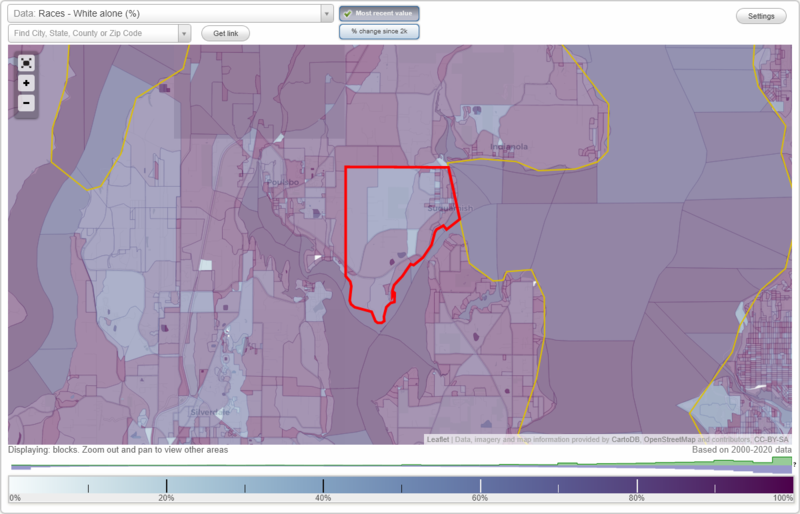
Races - White alone (%)
Races - White alone (% change since 2000)
Races - Black alone (%)
Races - Black alone (% change since 2000)
Races - American Indian alone (%)
Races - American Indian alone (% change since 2000)
Races - Asian alone (%)
Races - Asian alone (% change since 2000)
Races - Hispanic (%)
Races - Hispanic (% change since 2000)
Races - Native Hawaiian and Other Pacific Islander alone (%)
Races - Native Hawaiian and Other Pacific Islander alone (% change since 2000)
Races - Two or more races(%)
Races - Two or more races(% change since 2000)
Races - Other race alone (%)
Races - Other race alone (% change since 2000)
Racial diversity
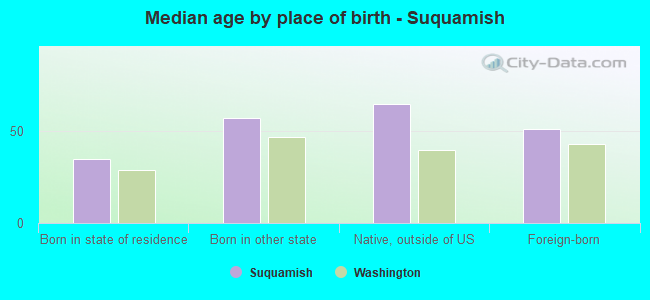
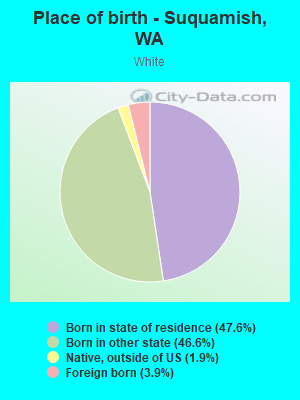
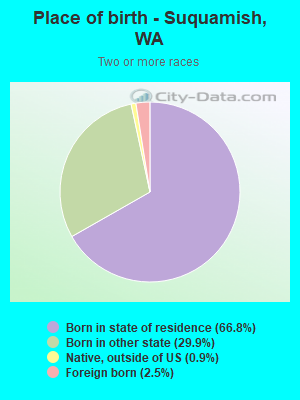
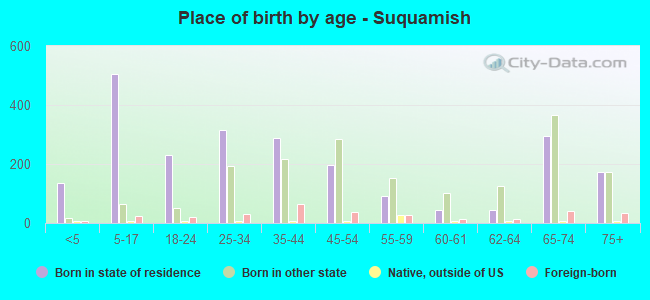
Place of birth - Born in state of residence (%)
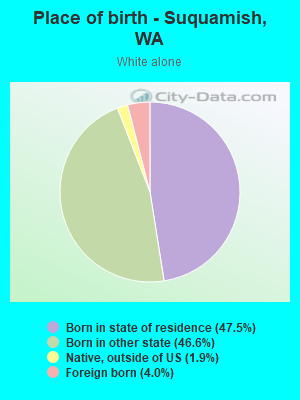
Place of birth - Born in state of residence (%) - White
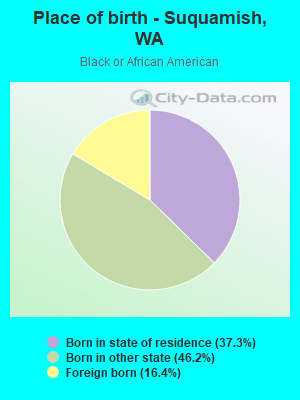
Place of birth - Born in state of residence (%) - Black or African American
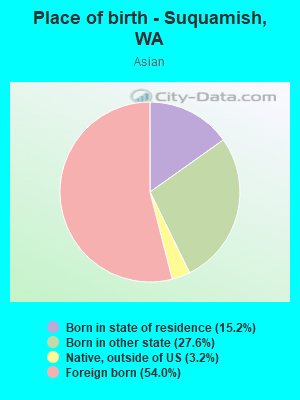
Place of birth - Born in state of residence (%) - Asian
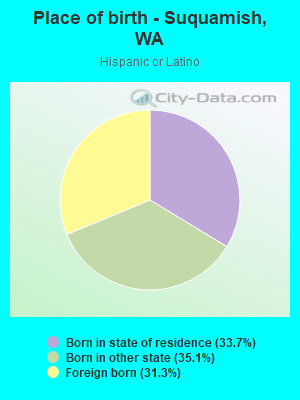
Place of birth - Born in state of residence (%) - Hispanic or Latino
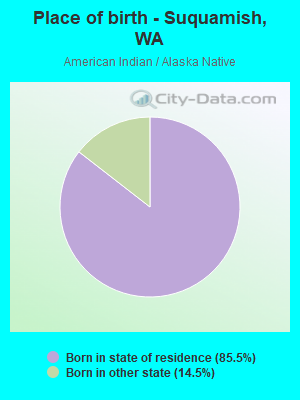
Place of birth - Born in state of residence (%) - American Indian and Alaska Native
Place of birth - Born in state of residence (%) - Multirace
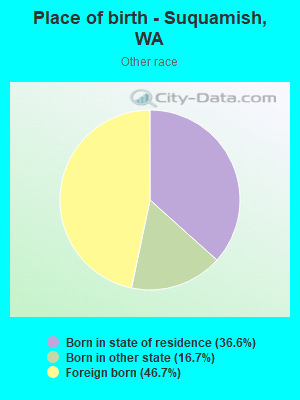
Place of birth - Born in state of residence (%) - Other Race
Place of birth - Born in other state (%)
Place of birth - Born in other state (%) - White
Place of birth - Born in other state (%) - Black or African American
Place of birth - Born in other state (%) - Asian
Place of birth - Born in other state (%) - Hispanic or Latino
Place of birth - Born in other state (%) - American Indian and Alaska Native
Place of birth - Born in other state (%) - Multirace
Place of birth - Born in other state (%) - Other Race
Place of birth - Native, outside of US (%)
Place of birth - Native, outside of US (%) - White
Place of birth - Native, outside of US (%) - Black or African American
Place of birth - Native, outside of US (%) - Asian
Place of birth - Native, outside of US (%) - Hispanic or Latino
Place of birth - Native, outside of US (%) - American Indian and Alaska Native
Place of birth - Native, outside of US (%) - Multirace
Place of birth - Native, outside of US (%) - Other Race
Place of birth - Foreign born (%)
Place of birth - Foreign born (%) - White
Place of birth - Foreign born (%) - Black or African American
Place of birth - Foreign born (%) - Asian
Place of birth - Foreign born (%) - Hispanic or Latino
Place of birth - Foreign born (%) - American Indian and Alaska Native
Place of birth - Foreign born (%) - Multirace
Place of birth - Foreign born (%) - Other Race
Residents speaking English at home (%)
Residents speaking English at home - Born in the United States (%)
Residents speaking English at home - Native, born elsewhere (%)
Residents speaking English at home - Foreign born (%)
Residents speaking Spanish at home (%)
Residents speaking Spanish at home - Born in the United States (%)
Residents speaking Spanish at home - Native, born elsewhere (%)
Residents speaking Spanish at home - Foreign born (%)
Residents speaking other language at home (%)
Residents speaking other language at home - Born in the United States (%)
Residents speaking other language at home - Native, born elsewhere (%)
Residents speaking other language at home - Foreign born (%)
Marital status - Never married (%)
Marital status - Now married (%)
Marital status - Separated (%)
Marital status - Widowed (%)
Marital status - Divorced (%)
Ancestries Reported - Arab (%)
Ancestries Reported - Czech (%)
Ancestries Reported - Danish (%)
Ancestries Reported - Dutch (%)
Ancestries Reported - English (%)
Ancestries Reported - French (%)
Ancestries Reported - French Canadian (%)
Ancestries Reported - German (%)
Ancestries Reported - Greek (%)
Ancestries Reported - Hungarian (%)
Ancestries Reported - Irish (%)
Ancestries Reported - Italian (%)
Ancestries Reported - Lithuanian (%)
Ancestries Reported - Norwegian (%)
Ancestries Reported - Polish (%)
Ancestries Reported - Portuguese (%)
Ancestries Reported - Russian (%)
Ancestries Reported - Scotch-Irish (%)
Ancestries Reported - Scottish (%)
Ancestries Reported - Slovak (%)
Ancestries Reported - Subsaharan African (%)
Ancestries Reported - Swedish (%)
Ancestries Reported - Swiss (%)
Ancestries Reported - Ukrainian (%)
Ancestries Reported - United States (%)
Ancestries Reported - Welsh (%)
Ancestries Reported - West Indian (%)
Ancestries Reported - Other (%)
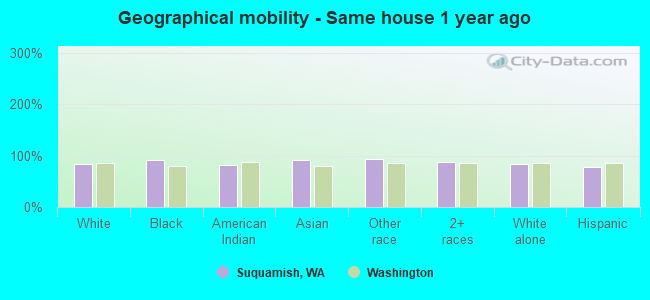
Geographical mobility - Same house 1 year ago (%)
Geographical mobility - Same house 1 year ago (%) - White
Geographical mobility - Same house 1 year ago (%) - Black or African American
Geographical mobility - Same house 1 year ago (%) - Asian
Geographical mobility - Same house 1 year ago (%) - Hispanic or Latino
Geographical mobility - Same house 1 year ago (%) - American Indian and Alaska Native
Geographical mobility - Same house 1 year ago (%) - Multirace
Geographical mobility - Same house 1 year ago (%) - Other Race
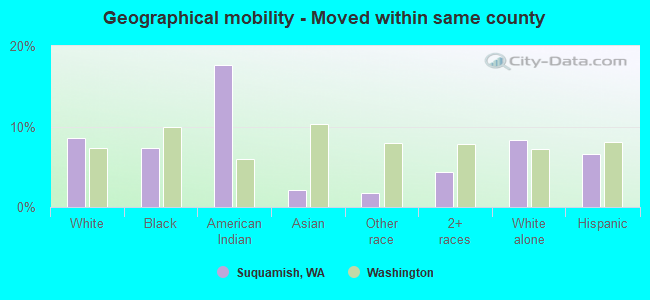
Geographical mobility - Moved within same county (%)
Geographical mobility - Moved within same county (%) - White
Geographical mobility - Moved within same county (%) - Black or African American
Geographical mobility - Moved within same county (%) - Asian
Geographical mobility - Moved within same county (%) - Hispanic or Latino
Geographical mobility - Moved within same county (%) - American Indian and Alaska Native
Geographical mobility - Moved within same county (%) - Multirace
Geographical mobility - Moved within same county (%) - Other Race
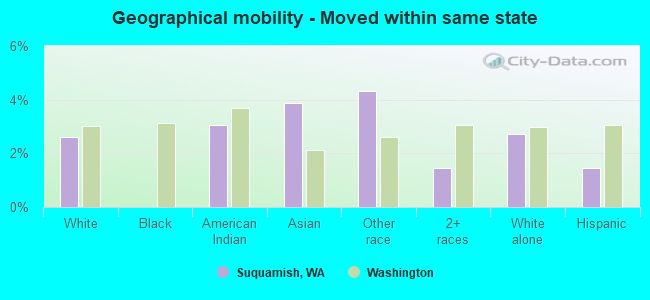
Geographical mobility - Moved from different county within same state (%)
Geographical mobility - Moved from different county within same state (%) - White
Geographical mobility - Moved from different county within same state (%) - Black or African American
Geographical mobility - Moved from different county within same state (%) - Asian
Geographical mobility - Moved from different county within same state (%) - Hispanic or Latino
Geographical mobility - Moved from different county within same state (%) - American Indian and Alaska Native
Geographical mobility - Moved from different county within same state (%) - Multirace
Geographical mobility - Moved from different county within same state (%) - Other Race
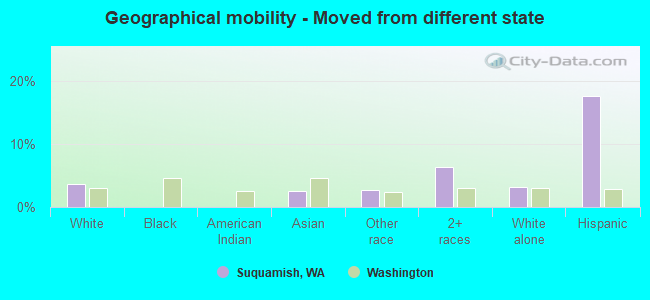
Geographical mobility - Moved from different state (%)
Geographical mobility - Moved from different state (%) - White
Geographical mobility - Moved from different state (%) - Black or African American
Geographical mobility - Moved from different state (%) - Asian
Geographical mobility - Moved from different state (%) - Hispanic or Latino
Geographical mobility - Moved from different state (%) - American Indian and Alaska Native
Geographical mobility - Moved from different state (%) - Multirace
Geographical mobility - Moved from different state (%) - Other Race
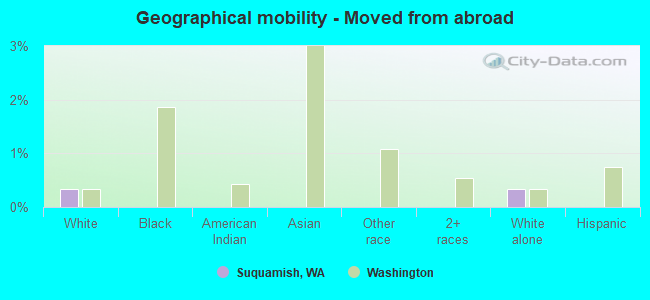
Geographical mobility - Moved from abroad (%)
Geographical mobility - Moved from abroad (%) - White
Geographical mobility - Moved from abroad (%) - Black or African American
Geographical mobility - Moved from abroad (%) - Asian
Geographical mobility - Moved from abroad (%) - Hispanic or Latino
Geographical mobility - Moved from abroad (%) - American Indian and Alaska Native
Geographical mobility - Moved from abroad (%) - Multirace
Geographical mobility - Moved from abroad (%) - Other Race
Place of birth for the foreign-born population - Ireland (%)
Place of birth for the foreign-born population - Denmark (%)
Place of birth for the foreign-born population - Norway (%)
Place of birth for the foreign-born population - Sweden (%)
Place of birth for the foreign-born population - United Kingdom (%)
Place of birth for the foreign-born population - England (%)
Place of birth for the foreign-born population - Scotland (%)
Place of birth for the foreign-born population - Other Northern Europe (%)
Place of birth for the foreign-born population - Austria (%)
Place of birth for the foreign-born population - Belgium (%)
Place of birth for the foreign-born population - France (%)
Place of birth for the foreign-born population - Germany (%)
Place of birth for the foreign-born population - Netherlands (%)
Place of birth for the foreign-born population - Switzerland (%)
Place of birth for the foreign-born population - Other Western Europe (%)
Place of birth for the foreign-born population - Greece (%)
Place of birth for the foreign-born population - Italy (%)
Place of birth for the foreign-born population - Portugal (%)
Place of birth for the foreign-born population - Spain (%)
Place of birth for the foreign-born population - Other Southern Europe (%)
Place of birth for the foreign-born population - Albania (%)
Place of birth for the foreign-born population - Belarus (%)
Place of birth for the foreign-born population - Bosnia and Herzegovina (%)
Place of birth for the foreign-born population - Bulgaria (%)
Place of birth for the foreign-born population - Croatia (%)
Place of birth for the foreign-born population - Czechoslovakia (%)
Place of birth for the foreign-born population - Hungary (%)
Place of birth for the foreign-born population - Latvia (%)
Place of birth for the foreign-born population - Lithuania (%)
Place of birth for the foreign-born population - North Macedonia (Macedonia) (%)
Place of birth for the foreign-born population - Moldova (%)
Place of birth for the foreign-born population - Poland (%)
Place of birth for the foreign-born population - Romania (%)
Place of birth for the foreign-born population - Russia (%)
Place of birth for the foreign-born population - Serbia (%)
Place of birth for the foreign-born population - Ukraine (%)
Place of birth for the foreign-born population - Other Eastern Europe (%)
Place of birth for the foreign-born population - China (%)
Place of birth for the foreign-born population - Hong Kong (%)
Place of birth for the foreign-born population - Taiwan (%)
Place of birth for the foreign-born population - Japan (%)
Place of birth for the foreign-born population - Korea (%)
Place of birth for the foreign-born population - Other Eastern Asia (%)
Place of birth for the foreign-born population - Afghanistan (%)
Place of birth for the foreign-born population - Bangladesh (%)
Place of birth for the foreign-born population - India (%)
Place of birth for the foreign-born population - Iran (%)
Place of birth for the foreign-born population - Kazakhstan (%)
Place of birth for the foreign-born population - Nepal (%)
Place of birth for the foreign-born population - Pakistan (%)
Place of birth for the foreign-born population - Sri Lanka (%)
Place of birth for the foreign-born population - Uzbekistan (%)
Place of birth for the foreign-born population - Other South Central Asia (%)
Place of birth for the foreign-born population - Burma (%)
Place of birth for the foreign-born population - Cambodia (%)
Place of birth for the foreign-born population - Indonesia (%)
Place of birth for the foreign-born population - Laos (%)
Place of birth for the foreign-born population - Malaysia (%)
Place of birth for the foreign-born population - Philippines (%)
Place of birth for the foreign-born population - Singapore (%)
Place of birth for the foreign-born population - Thailand (%)
Place of birth for the foreign-born population - Vietnam (%)
Place of birth for the foreign-born population - Other South Eastern Asia (%)
Place of birth for the foreign-born population - Armenia (%)
Place of birth for the foreign-born population - Iraq (%)
Place of birth for the foreign-born population - Israel (%)
Place of birth for the foreign-born population - Jordan (%)
Place of birth for the foreign-born population - Kuwait (%)
Place of birth for the foreign-born population - Lebanon (%)
Place of birth for the foreign-born population - Saudi Arabia (%)
Place of birth for the foreign-born population - Syria (%)
Place of birth for the foreign-born population - Turkey (%)
Place of birth for the foreign-born population - Yemen (%)
Place of birth for the foreign-born population - Other Western Asia (%)
Place of birth for the foreign-born population - Eritrea (%)
Place of birth for the foreign-born population - Ethiopia (%)
Place of birth for the foreign-born population - Kenya (%)
Place of birth for the foreign-born population - Somalia (%)
Place of birth for the foreign-born population - Uganda (%)
Place of birth for the foreign-born population - Zimbabwe (%)
Place of birth for the foreign-born population - Other Eastern Africa (%)
Place of birth for the foreign-born population - Cameroon (%)
Place of birth for the foreign-born population - Congo (%)
Place of birth for the foreign-born population - Democratic Republic of Congo (Zaire) (%)
Place of birth for the foreign-born population - Other Middle Africa (%)
Place of birth for the foreign-born population - Egypt (%)
Place of birth for the foreign-born population - Morocco (%)
Place of birth for the foreign-born population - Sudan (%)
Place of birth for the foreign-born population - Other Northern Africa (%)
Place of birth for the foreign-born population - South Africa (%)
Place of birth for the foreign-born population - Other Southern Africa (%)
Place of birth for the foreign-born population - Cabo Verde (%)
Place of birth for the foreign-born population - Ghana (%)
Place of birth for the foreign-born population - Liberia (%)
Place of birth for the foreign-born population - Nigeria (%)
Place of birth for the foreign-born population - Senegal (%)
Place of birth for the foreign-born population - Sierra Leone (%)
Place of birth for the foreign-born population - Other Western Africa (%)
Place of birth for the foreign-born population - Australia (%)
Place of birth for the foreign-born population - New Zealand (%)
Place of birth for the foreign-born population - Fiji (%)
Place of birth for the foreign-born population - Micronesia (%)
Place of birth for the foreign-born population - Bahamas (%)
Place of birth for the foreign-born population - Barbados (%)
Place of birth for the foreign-born population - Cuba (%)
Place of birth for the foreign-born population - Dominica (%)
Place of birth for the foreign-born population - Dominican Republic (%)
Place of birth for the foreign-born population - Grenada (%)
Place of birth for the foreign-born population - Haiti (%)
Place of birth for the foreign-born population - Jamaica (%)
Place of birth for the foreign-born population - St. Vincent and the Grenadines (%)
Place of birth for the foreign-born population - Trinidad and Tobago (%)
Place of birth for the foreign-born population - West Indies (%)
Place of birth for the foreign-born population - Other Caribbean (%)
Place of birth for the foreign-born population - Belize (%)
Place of birth for the foreign-born population - Costa Rica (%)
Place of birth for the foreign-born population - El Salvador (%)
Place of birth for the foreign-born population - Guatemala (%)
Place of birth for the foreign-born population - Honduras (%)
Place of birth for the foreign-born population - Mexico (%)
Place of birth for the foreign-born population - Nicaragua (%)
Place of birth for the foreign-born population - Panama (%)
Place of birth for the foreign-born population - Other Central America (%)
Place of birth for the foreign-born population - Argentina (%)
Place of birth for the foreign-born population - Bolivia (%)
Place of birth for the foreign-born population - Brazil (%)
Place of birth for the foreign-born population - Chile (%)
Place of birth for the foreign-born population - Colombia (%)
Place of birth for the foreign-born population - Ecuador (%)
Place of birth for the foreign-born population - Guyana (%)
Place of birth for the foreign-born population - Peru (%)
Place of birth for the foreign-born population - Uruguay (%)
Place of birth for the foreign-born population - Venezuela (%)
Place of birth for the foreign-born population - Other South America (%)
Place of birth for the foreign-born population - Canada (%)
Place of birth for the foreign-born population - Other Northern America (%)
Place of birth for the foreign-born population - Other (%)
Latest news about races in Suquamish, WA collected exclusively by city-data.com from local newspapers, TV, and radio stations
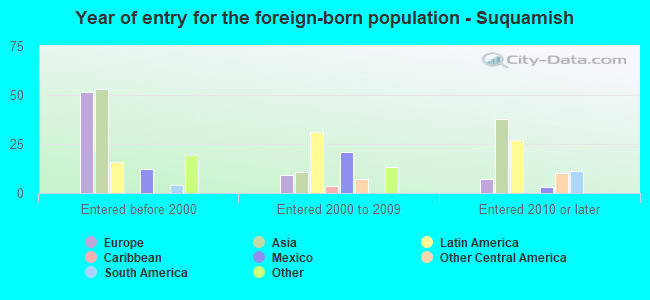
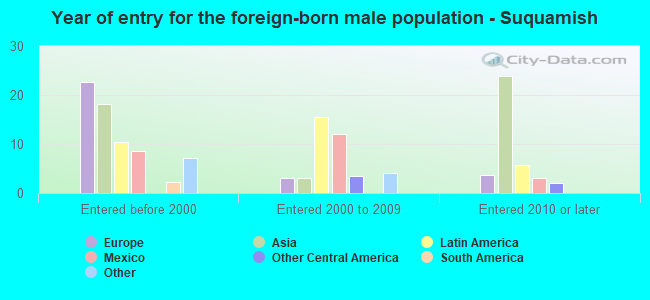
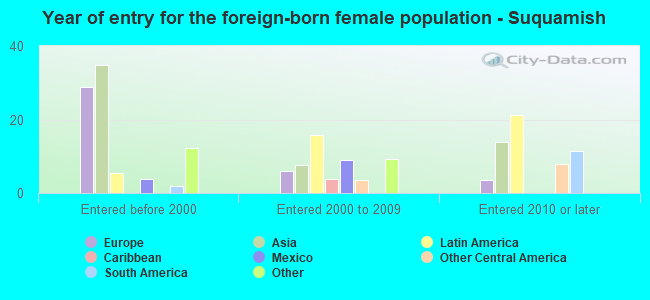
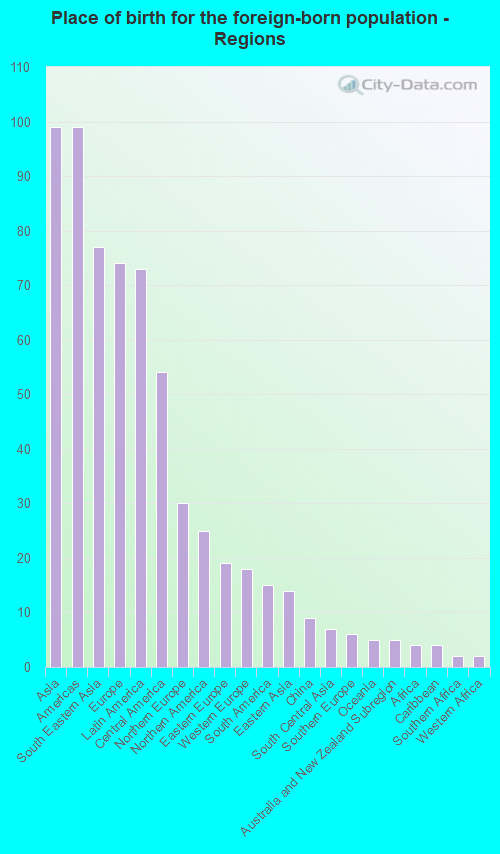
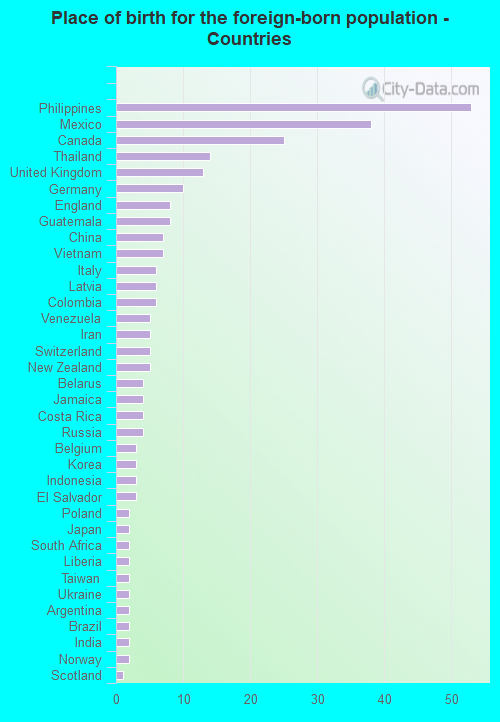
According to 2022 data, the most numerous races in Suquamish, WA are White alone (2,902 residents), Hispanic (277 residents), and Asian alone (144 residents). 92.5% of Suquamish residents speak English at home. 6.5% of Suquamish, WA residents are foreign-born (2.2% born in Asia, 1.6% born in Europe, 1.6% born in Latin America), which is 131.4% less than the foreign-born rate of 15.0% across the entire state of Washington.
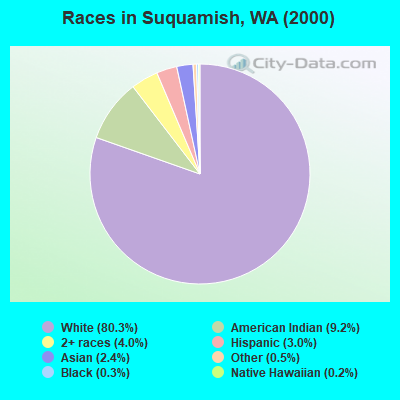
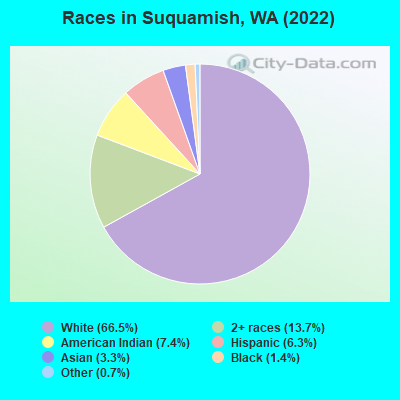
Race distribution in Suquamish
2000 2022
4,652,490 78.9% White alone 441,509 7.5% Hispanic 319,401 5.4% Asian alone 184,631 3.1% Black alone 175,926 3.0% Two or more races 85,396 1.4% American Indian alone 22,779 0.4% Native Hawaiian and Other 11,989 0.2% Other race alone
4,941,456 63.5% White alone 1,093,313 14.0% Hispanic 755,832 9.7% Asian alone 523,448 6.7% Two or more races 299,537 3.8% Black alone 69,024 0.9% American Indian alone 52,231 0.7% Native Hawaiian and Other 50,945 0.7% Other race alone
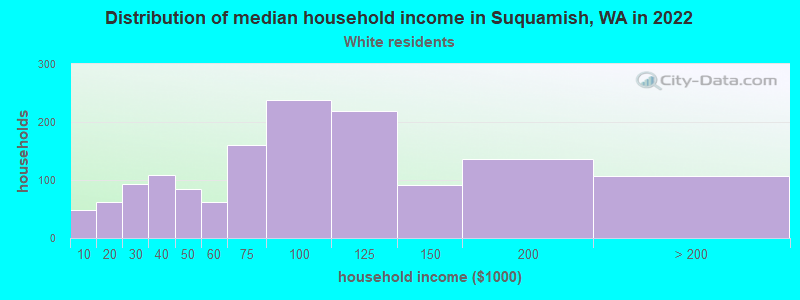
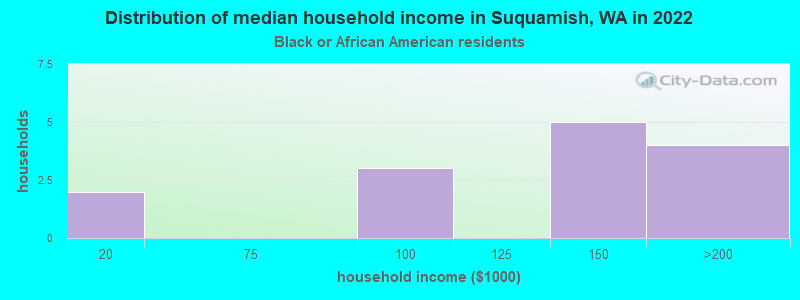
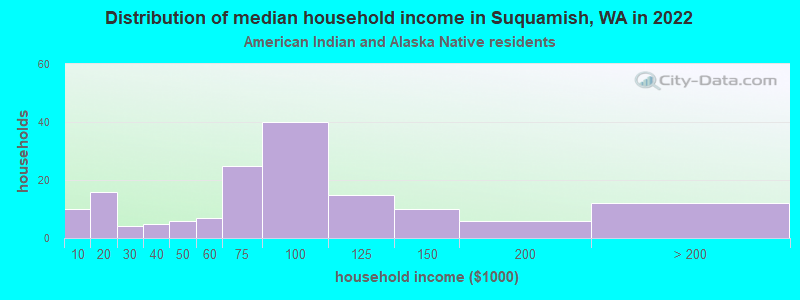
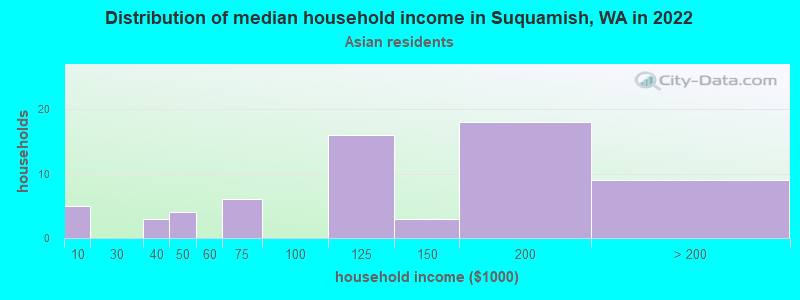
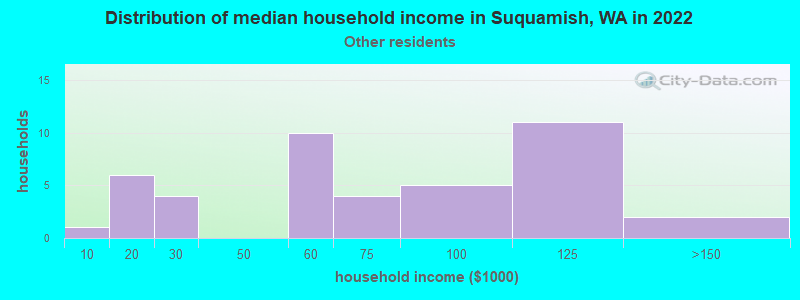
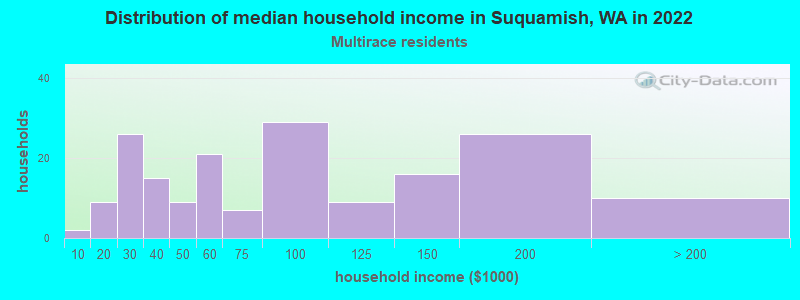
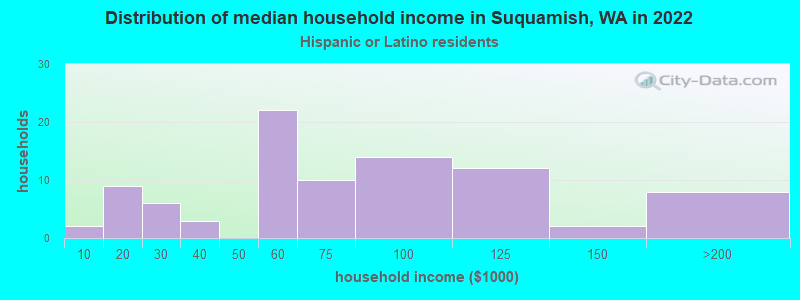
Income and house value in Suquamish Median household income in 2022 $80,934 White non-Hispanic householders$160,605 Black householders$68,934 American Indian and Alaska Native householders$168,925 Asian householders$55,618 Some other race householders$67,106 Two or more races householders$64,572 Hispanic or Latino race householdersMedian 2022 house value $535,635 White Non-Hispanic householders$507,230 Black or African American householders$415,006 American Indian or Alaska Native householders $380,330 Asian householders$350,450 Some other race householders$403,571 Two or more races householders$449,682 Hispanic or Latino householders
Median age by race in Suquamish
53.2 Median age for White residents53.3 54.1 45.5 Median age for Black or African American residents23.6 58.4 38.1 Median age for American Indian / Alaska Native residents40.7 33.4 48.3 Median age for Asian residents44.4 59.2 -608,782,434.5 Median age for Native Hawaiian / Pacific Islander residents-639,639,639.0 -686,716,791.3 37.4 Median age for Other race residents41.3 29.4 27.3 Median age for Two or more races residents22.8 34.1 54.0 Median age for White alone residents53.8 54.6 29.2 Median age for Hispanic or Latino residents30.9 29.5
Owner/renter occupied households by race in Suquamish
House owners and renters - White residents 1,136 80.1% Owner occupied283 19.9% Renter occupiedHouse owners and renters - Black or African American residents 8 65.3% Owner occupied4 34.7% Renter occupiedHouse owners and renters - American Indian / Alaska Native residents 94 53.6% Owner occupied82 46.4% Renter occupiedHouse owners and renters - Asian residents 61 88.0% Owner occupied8 12.0% Renter occupiedHouse owners and renters - Other race residents 41 77.7% Owner occupied12 22.3% Renter occupiedHouse owners and renters - Two or more races residents 141 74.6% Owner occupied48 25.4% Renter occupiedHouse owners and renters - White alone residents 1,125 80.4% Owner occupied274 19.6% Renter occupiedHouse owners and renters - Hispanic or Latino residents 65 72.2% Owner occupied25 27.8% Renter occupied
Language usage in Suquamish
English speakers - Total 92.5% of residents of Suquamish speak English at home.
3.1% of residents speak Spanish at home 74 56.1% Speak English very well58 43.9% Speak English less than very well4.1% of residents speak other language at home 138 79.8% Speak English very well35 20.2% Speak English less than very well
English speakers - Born in the United States 96.8% of residents of Suquamish speak English at home.
1.9% of residents speak Spanish at home 25 78.1% Speak English very well7 21.9% Speak English less than very well1.0% of residents speak other language at home 16 94.1% Speak English very well1 5.9% Speak English less than very well
All residents speak only English at home
English speakers - Foreign-born 36.6% of residents of Suquamish speak English at home.
27.1% of residents speak Spanish at home 23 28.0% Speak English very well59 72.0% Speak English less than very well36.0% of residents speak other language at home 78 71.6% Speak English very well31 28.4% Speak English less than very well
White (Caucasian) - Speak only English Native:
98.4% (2,734)Foreign-born:
58.9% (68)
White (Caucasian) - Speak another language Native:
1.6% (45)Foreign-born:
37.3% (43)
Black or African American - Speak only English Native:
91.5% (56)Foreign-born:
37.3% (2)
Black or African American - Speak another language Native:
8.5% (5)Foreign-born:
64.7% (4)
Asian - Speak only English Native:
100.0% (65)Foreign-born:
14.7% (11)
Asian - Speak another language Native:
1.4% (1)Foreign-born:
84.6% (66)
Other race - Speak only English Native:
52.2% (38)Foreign-born:
17.2% (13)
Other race - Speak another language Native:
48.2% (36)Foreign-born:
85.6% (66)
Two or more races - Speak only English Native:
100.0% (605)Foreign-born:
84.1% (15)
White alone - Speak only English Native:
98.8% (2,694)Foreign-born:
58.1% (68)
White alone - Speak another language Native:
1.2% (32)Foreign-born:
35.1% (41)
Hispanic or Latino - Speak only English Native:
75.7% (134)Foreign-born:
8.3% (8)
Hispanic or Latino - Speak another language Native:
24.2% (43)Foreign-born:
92.1% (83)
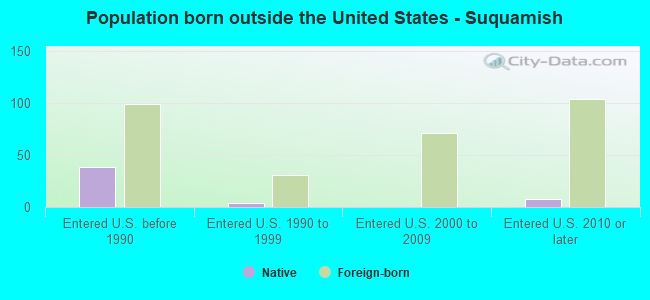
Foreign-born residents in Suquamish 283 residents are foreign born (2.2% Asia , 1.6% Europe , 1.6% Latin America ).
This city:
6.5%Washington:
14.9%
Marital status for residents in Suquamish Marital status - White (Caucasian) population 15 years and over
Males 24.7% Never married55.4% Now married1.8% Separated4.1% Widowed14.0% DivorcedFemales 21.1% Never married51.5% Now married1.0% Separated8.4% Widowed18.1% DivorcedWomen who gave birth in the past 12 months Now married:
71.4% (10)Unmarried:
28.6% (4)
Women who did not give birth in the past 12 months Now married:
45.6% (231)Unmarried:
54.4% (275)
Marital status - Black or African American population 15 years and over
Males 68.3% Never married17.1% Now married0.0% Separated0.0% Widowed14.6% DivorcedFemales 50.0% Never married33.3% Now married5.6% Separated0.0% Widowed11.1% DivorcedWomen who did not give birth in the past 12 months Now married:
40.0% (6)Unmarried:
60.0% (9)
Marital status - American Indian / Alaska Native population 15 years and over
Males 52.1% Never married28.5% Now married0.0% Separated2.1% Widowed17.4% DivorcedFemales 44.5% Never married18.9% Now married1.2% Separated8.5% Widowed26.8% DivorcedWomen who gave birth in the past 12 months Now married:
66.7% (2)Unmarried:
33.3% (1)
Women who did not give birth in the past 12 months Now married:
18.1% (20)Unmarried:
81.9% (91)
Marital status - Asian population 15 years and over
Males 24.5% Never married66.0% Now married0.0% Separated9.4% Widowed0.0% DivorcedFemales 23.5% Never married39.7% Now married0.0% Separated30.9% Widowed5.9% DivorcedWomen who did not give birth in the past 12 months Now married:
40.0% (11)Unmarried:
60.0% (16)
Marital status - Other race population 15 years and over
Males 27.9% Never married67.4% Now married0.0% Separated0.0% Widowed4.7% DivorcedFemales 33.3% Never married59.6% Now married0.0% Separated0.0% Widowed7.0% DivorcedWomen who gave birth in the past 12 months Now married:
0.0% (0)Unmarried:
100.0% (4)
Women who did not give birth in the past 12 months Now married:
55.6% (29)Unmarried:
44.4% (23)
Marital status - Two or more races population 15 years and over
Males 54.1% Never married31.4% Now married0.0% Separated1.5% Widowed12.9% DivorcedFemales 40.8% Never married43.5% Now married0.0% Separated4.0% Widowed11.7% DivorcedWomen who gave birth in the past 12 months Now married:
75.0% (7)Unmarried:
25.0% (2)
Women who did not give birth in the past 12 months Now married:
32.6% (53)Unmarried:
67.4% (110)
Marital status - White alone, not Hispanic / Latino population 15 years and over
Males 24.7% Never married55.3% Now married1.9% Separated4.2% Widowed14.0% DivorcedFemales 21.0% Never married51.3% Now married1.0% Separated8.5% Widowed18.2% DivorcedWomen who gave birth in the past 12 months Now married:
63.6% (7)Unmarried:
36.4% (4)
Women who did not give birth in the past 12 months Now married:
45.3% (226)Unmarried:
54.7% (273)
Marital status - Hispanic or Latino population 15 years and over
Males 40.2% Never married52.1% Now married0.0% Separated0.0% Widowed7.7% DivorcedFemales 34.8% Never married58.4% Now married0.0% Separated0.0% Widowed6.7% DivorcedWomen who gave birth in the past 12 months Now married:
50.0% (3)Unmarried:
50.0% (3)
Women who did not give birth in the past 12 months Now married:
53.1% (35)Unmarried:
46.9% (31)
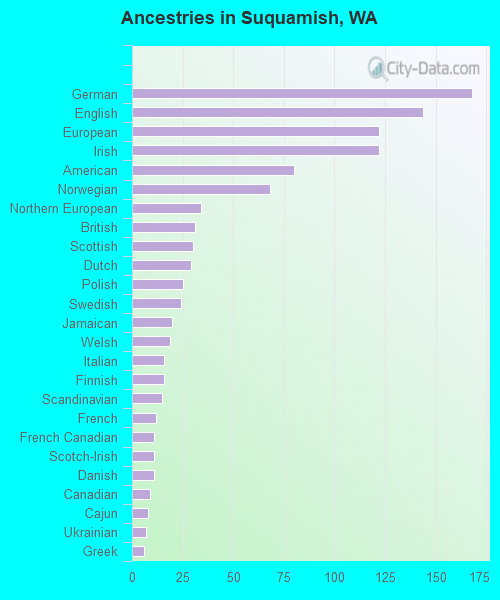
Ancestries in Suquamish
168 9.1% German144 7.8% English122 6.6% European122 6.6% Irish80 4.3% American68 3.7% Norwegian34 1.8% Northern European31 1.7% British30 1.6% Scottish29 1.6% Dutch25 1.3% Polish24 1.3% Swedish20 1.1% Jamaican19 1.0% Welsh16 0.9% Italian16 0.9% Finnish15 0.8% Scandinavian12 0.6% French11 0.6% French Canadian11 0.6% Scotch-Irish11 0.6% Danish9 0.5% Canadian8 0.4% Cajun7 0.4% Ukrainian6 0.3% Greek5 0.3% Basque5 0.3% Latvian5 0.3% Russian5 0.3% Serbian4 0.2% Armenian4 0.2% Hungarian4 0.2% Swiss4 0.2% Iranian3 0.2% Belgian3 0.2% Brazilian3 0.2% Czech3 0.2% Liberian2 0.1% Lithuanian
Children Nativity (place of birth) in Suquamish
Children under 6 years - Living with two parents Both parents native 91 100.0% NativeBoth parents foreign-born 2 100.0% NativeOne native, one foreign-born parent 6 100.0% NativeChildren under 6 years - Living with one parent Native parent 85 100.0% NativeForeign-born parent 4 100.0% NativeChildren 6 to 17 years - Living with two parents Both parents native 268 100.0% NativeBoth parents foreign-born 17 47.1% Native19 52.9% Foreign-bornOne native, one foreign-born parent 4 100.0% NativeChildren 6 to 17 years - Living with one parent Native parent 165 100.0% NativeForeign-born parent 41 57.4% Native30 42.6% Foreign-born
Grandparents responsible for own grandchildren in Suquamish
Grandparents (30 to 59 years) White / Caucasian 17 53.7% Responsible for grandchildren15 46.3% Not responsible for grandchildrenAmerican Indian / Alaska Native 2 53.8% Responsible for grandchildren1 46.2% Not responsible for grandchildrenTwo or more races 6 100.0% Not responsible for grandchildrenWhite alone, not Hispanic / Latino 18 53.2% Responsible for grandchildren16 46.8% Not responsible for grandchildrenGrandparents (60 years and over) White / Caucasian 10 17.0% Responsible for grandchildren50 83.0% Not responsible for grandchildrenAmerican Indian / Alaska Native 1 14.7% Responsible for grandchildren5 85.3% Not responsible for grandchildrenTwo or more races 1 91.1% Responsible for grandchildrenWhite alone, not Hispanic / Latino 10 17.4% Responsible for grandchildren49 82.6% Not responsible for grandchildren