Races in Tampa, Florida (FL) Detailed Stats
Data:
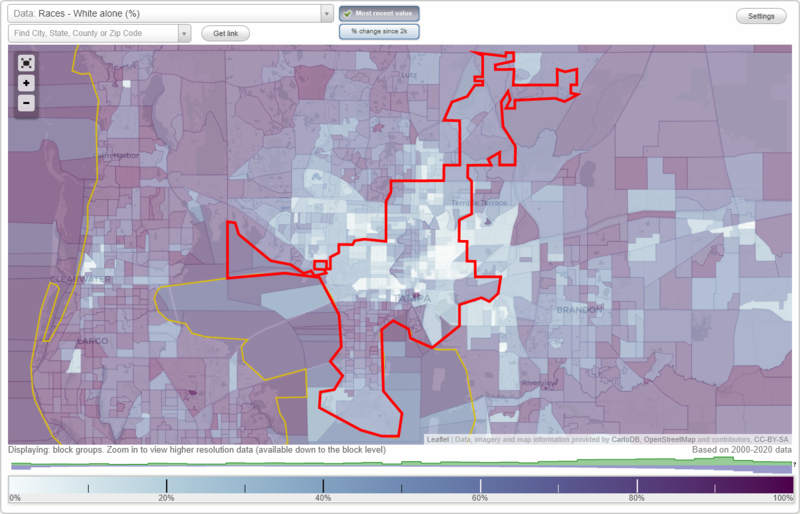
Races - White alone (%)
Races - White alone (% change since 2000)
Races - Black alone (%)
Races - Black alone (% change since 2000)
Races - American Indian alone (%)
Races - American Indian alone (% change since 2000)
Races - Asian alone (%)
Races - Asian alone (% change since 2000)
Races - Hispanic (%)
Races - Hispanic (% change since 2000)
Races - Native Hawaiian and Other Pacific Islander alone (%)
Races - Native Hawaiian and Other Pacific Islander alone (% change since 2000)
Races - Two or more races(%)
Races - Two or more races(% change since 2000)
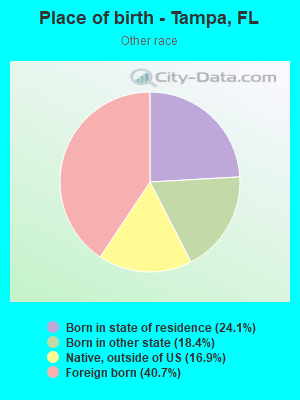
Races - Other race alone (%)
Races - Other race alone (% change since 2000)
Racial diversity
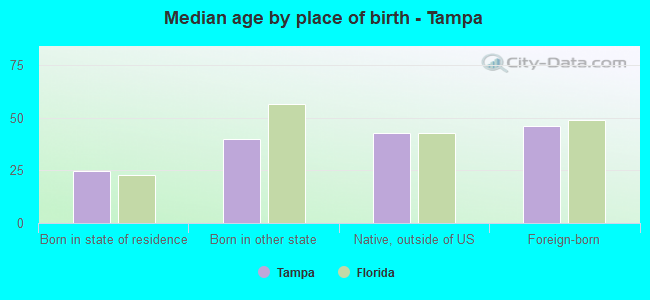
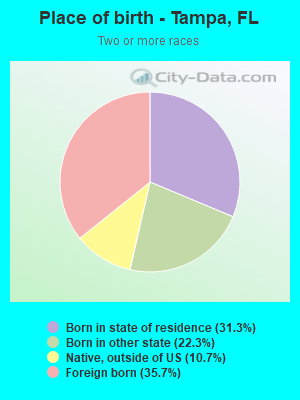
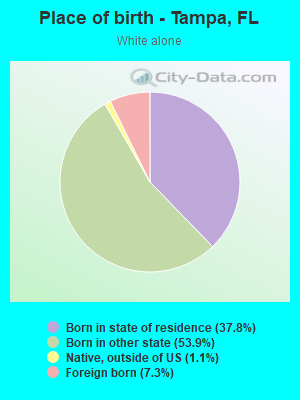
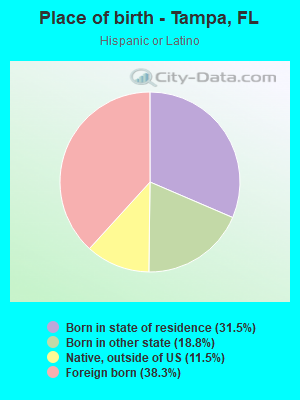
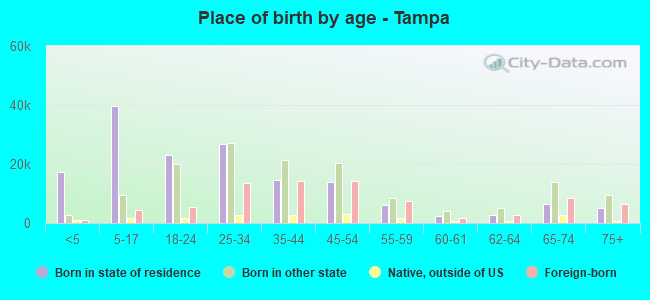
Place of birth - Born in state of residence (%)
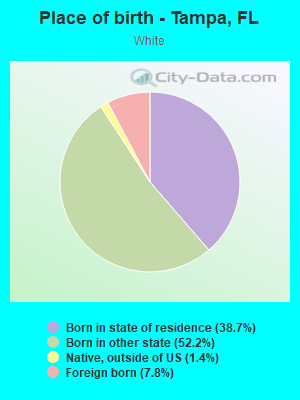
Place of birth - Born in state of residence (%) - White
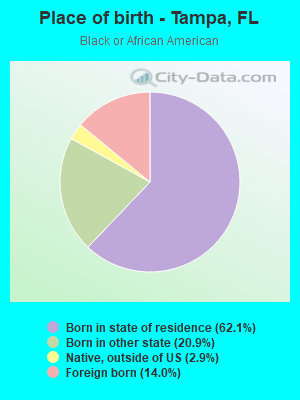
Place of birth - Born in state of residence (%) - Black or African American
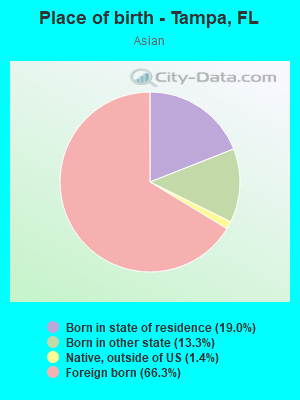
Place of birth - Born in state of residence (%) - Asian
Place of birth - Born in state of residence (%) - Hispanic or Latino
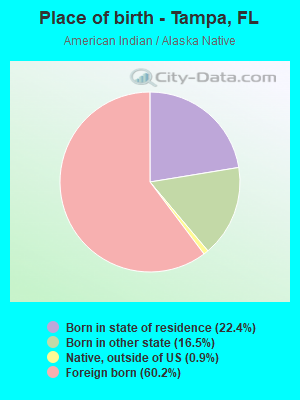
Place of birth - Born in state of residence (%) - American Indian and Alaska Native
Place of birth - Born in state of residence (%) - Multirace
Place of birth - Born in state of residence (%) - Other Race
Place of birth - Born in other state (%)
Place of birth - Born in other state (%) - White
Place of birth - Born in other state (%) - Black or African American
Place of birth - Born in other state (%) - Asian
Place of birth - Born in other state (%) - Hispanic or Latino
Place of birth - Born in other state (%) - American Indian and Alaska Native
Place of birth - Born in other state (%) - Multirace
Place of birth - Born in other state (%) - Other Race
Place of birth - Native, outside of US (%)
Place of birth - Native, outside of US (%) - White
Place of birth - Native, outside of US (%) - Black or African American
Place of birth - Native, outside of US (%) - Asian
Place of birth - Native, outside of US (%) - Hispanic or Latino
Place of birth - Native, outside of US (%) - American Indian and Alaska Native
Place of birth - Native, outside of US (%) - Multirace
Place of birth - Native, outside of US (%) - Other Race
Place of birth - Foreign born (%)
Place of birth - Foreign born (%) - White
Place of birth - Foreign born (%) - Black or African American
Place of birth - Foreign born (%) - Asian
Place of birth - Foreign born (%) - Hispanic or Latino
Place of birth - Foreign born (%) - American Indian and Alaska Native
Place of birth - Foreign born (%) - Multirace
Place of birth - Foreign born (%) - Other Race
Residents speaking English at home (%)
Residents speaking English at home - Born in the United States (%)
Residents speaking English at home - Native, born elsewhere (%)
Residents speaking English at home - Foreign born (%)
Residents speaking Spanish at home (%)
Residents speaking Spanish at home - Born in the United States (%)
Residents speaking Spanish at home - Native, born elsewhere (%)
Residents speaking Spanish at home - Foreign born (%)
Residents speaking other language at home (%)
Residents speaking other language at home - Born in the United States (%)
Residents speaking other language at home - Native, born elsewhere (%)
Residents speaking other language at home - Foreign born (%)
Marital status - Never married (%)
Marital status - Now married (%)
Marital status - Separated (%)
Marital status - Widowed (%)
Marital status - Divorced (%)
Ancestries Reported - Arab (%)
Ancestries Reported - Czech (%)
Ancestries Reported - Danish (%)
Ancestries Reported - Dutch (%)
Ancestries Reported - English (%)
Ancestries Reported - French (%)
Ancestries Reported - French Canadian (%)
Ancestries Reported - German (%)
Ancestries Reported - Greek (%)
Ancestries Reported - Hungarian (%)
Ancestries Reported - Irish (%)
Ancestries Reported - Italian (%)
Ancestries Reported - Lithuanian (%)
Ancestries Reported - Norwegian (%)
Ancestries Reported - Polish (%)
Ancestries Reported - Portuguese (%)
Ancestries Reported - Russian (%)
Ancestries Reported - Scotch-Irish (%)
Ancestries Reported - Scottish (%)
Ancestries Reported - Slovak (%)
Ancestries Reported - Subsaharan African (%)
Ancestries Reported - Swedish (%)
Ancestries Reported - Swiss (%)
Ancestries Reported - Ukrainian (%)
Ancestries Reported - United States (%)
Ancestries Reported - Welsh (%)
Ancestries Reported - West Indian (%)
Ancestries Reported - Other (%)
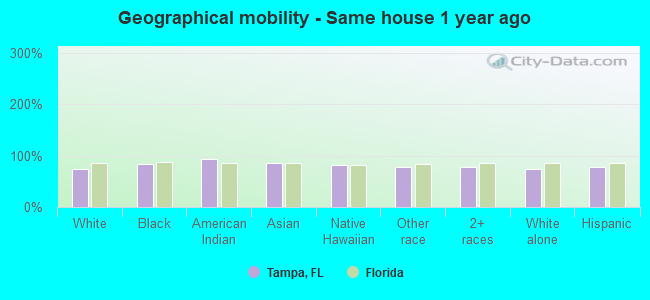
Geographical mobility - Same house 1 year ago (%)
Geographical mobility - Same house 1 year ago (%) - White
Geographical mobility - Same house 1 year ago (%) - Black or African American
Geographical mobility - Same house 1 year ago (%) - Asian
Geographical mobility - Same house 1 year ago (%) - Hispanic or Latino
Geographical mobility - Same house 1 year ago (%) - American Indian and Alaska Native
Geographical mobility - Same house 1 year ago (%) - Multirace
Geographical mobility - Same house 1 year ago (%) - Other Race
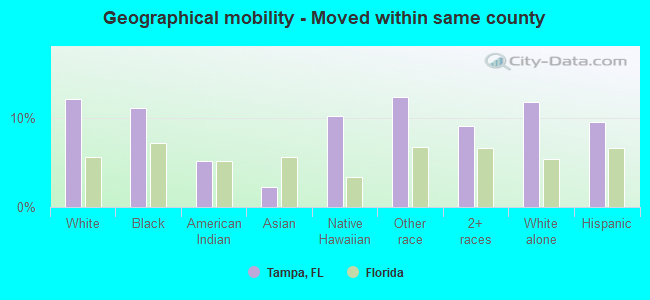
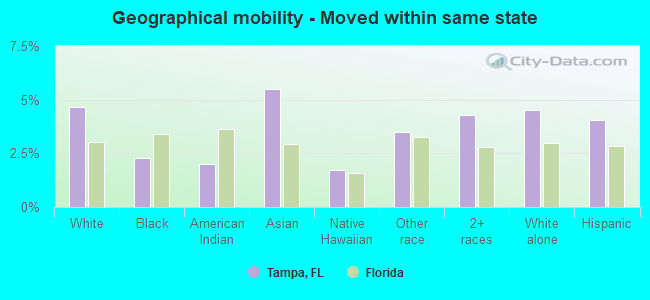
Geographical mobility - Moved within same county (%)
Geographical mobility - Moved within same county (%) - White
Geographical mobility - Moved within same county (%) - Black or African American
Geographical mobility - Moved within same county (%) - Asian
Geographical mobility - Moved within same county (%) - Hispanic or Latino
Geographical mobility - Moved within same county (%) - American Indian and Alaska Native
Geographical mobility - Moved within same county (%) - Multirace
Geographical mobility - Moved within same county (%) - Other Race
Geographical mobility - Moved from different county within same state (%)
Geographical mobility - Moved from different county within same state (%) - White
Geographical mobility - Moved from different county within same state (%) - Black or African American
Geographical mobility - Moved from different county within same state (%) - Asian
Geographical mobility - Moved from different county within same state (%) - Hispanic or Latino
Geographical mobility - Moved from different county within same state (%) - American Indian and Alaska Native
Geographical mobility - Moved from different county within same state (%) - Multirace
Geographical mobility - Moved from different county within same state (%) - Other Race
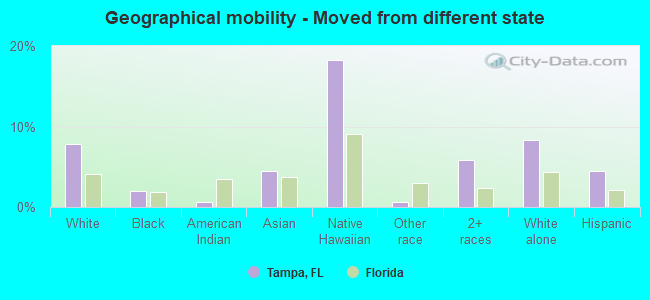
Geographical mobility - Moved from different state (%)
Geographical mobility - Moved from different state (%) - White
Geographical mobility - Moved from different state (%) - Black or African American
Geographical mobility - Moved from different state (%) - Asian
Geographical mobility - Moved from different state (%) - Hispanic or Latino
Geographical mobility - Moved from different state (%) - American Indian and Alaska Native
Geographical mobility - Moved from different state (%) - Multirace
Geographical mobility - Moved from different state (%) - Other Race
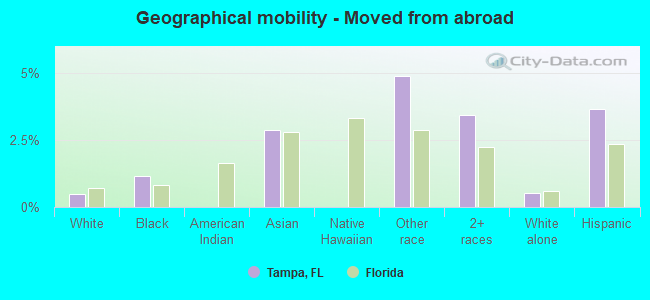
Geographical mobility - Moved from abroad (%)
Geographical mobility - Moved from abroad (%) - White
Geographical mobility - Moved from abroad (%) - Black or African American
Geographical mobility - Moved from abroad (%) - Asian
Geographical mobility - Moved from abroad (%) - Hispanic or Latino
Geographical mobility - Moved from abroad (%) - American Indian and Alaska Native
Geographical mobility - Moved from abroad (%) - Multirace
Geographical mobility - Moved from abroad (%) - Other Race
Place of birth for the foreign-born population - Ireland (%)
Place of birth for the foreign-born population - Denmark (%)
Place of birth for the foreign-born population - Norway (%)
Place of birth for the foreign-born population - Sweden (%)
Place of birth for the foreign-born population - United Kingdom (%)
Place of birth for the foreign-born population - England (%)
Place of birth for the foreign-born population - Scotland (%)
Place of birth for the foreign-born population - Other Northern Europe (%)
Place of birth for the foreign-born population - Austria (%)
Place of birth for the foreign-born population - Belgium (%)
Place of birth for the foreign-born population - France (%)
Place of birth for the foreign-born population - Germany (%)
Place of birth for the foreign-born population - Netherlands (%)
Place of birth for the foreign-born population - Switzerland (%)
Place of birth for the foreign-born population - Other Western Europe (%)
Place of birth for the foreign-born population - Greece (%)
Place of birth for the foreign-born population - Italy (%)
Place of birth for the foreign-born population - Portugal (%)
Place of birth for the foreign-born population - Spain (%)
Place of birth for the foreign-born population - Other Southern Europe (%)
Place of birth for the foreign-born population - Albania (%)
Place of birth for the foreign-born population - Belarus (%)
Place of birth for the foreign-born population - Bosnia and Herzegovina (%)
Place of birth for the foreign-born population - Bulgaria (%)
Place of birth for the foreign-born population - Croatia (%)
Place of birth for the foreign-born population - Czechoslovakia (%)
Place of birth for the foreign-born population - Hungary (%)
Place of birth for the foreign-born population - Latvia (%)
Place of birth for the foreign-born population - Lithuania (%)
Place of birth for the foreign-born population - North Macedonia (Macedonia) (%)
Place of birth for the foreign-born population - Moldova (%)
Place of birth for the foreign-born population - Poland (%)
Place of birth for the foreign-born population - Romania (%)
Place of birth for the foreign-born population - Russia (%)
Place of birth for the foreign-born population - Serbia (%)
Place of birth for the foreign-born population - Ukraine (%)
Place of birth for the foreign-born population - Other Eastern Europe (%)
Place of birth for the foreign-born population - China (%)
Place of birth for the foreign-born population - Hong Kong (%)
Place of birth for the foreign-born population - Taiwan (%)
Place of birth for the foreign-born population - Japan (%)
Place of birth for the foreign-born population - Korea (%)
Place of birth for the foreign-born population - Other Eastern Asia (%)
Place of birth for the foreign-born population - Afghanistan (%)
Place of birth for the foreign-born population - Bangladesh (%)
Place of birth for the foreign-born population - India (%)
Place of birth for the foreign-born population - Iran (%)
Place of birth for the foreign-born population - Kazakhstan (%)
Place of birth for the foreign-born population - Nepal (%)
Place of birth for the foreign-born population - Pakistan (%)
Place of birth for the foreign-born population - Sri Lanka (%)
Place of birth for the foreign-born population - Uzbekistan (%)
Place of birth for the foreign-born population - Other South Central Asia (%)
Place of birth for the foreign-born population - Burma (%)
Place of birth for the foreign-born population - Cambodia (%)
Place of birth for the foreign-born population - Indonesia (%)
Place of birth for the foreign-born population - Laos (%)
Place of birth for the foreign-born population - Malaysia (%)
Place of birth for the foreign-born population - Philippines (%)
Place of birth for the foreign-born population - Singapore (%)
Place of birth for the foreign-born population - Thailand (%)
Place of birth for the foreign-born population - Vietnam (%)
Place of birth for the foreign-born population - Other South Eastern Asia (%)
Place of birth for the foreign-born population - Armenia (%)
Place of birth for the foreign-born population - Iraq (%)
Place of birth for the foreign-born population - Israel (%)
Place of birth for the foreign-born population - Jordan (%)
Place of birth for the foreign-born population - Kuwait (%)
Place of birth for the foreign-born population - Lebanon (%)
Place of birth for the foreign-born population - Saudi Arabia (%)
Place of birth for the foreign-born population - Syria (%)
Place of birth for the foreign-born population - Turkey (%)
Place of birth for the foreign-born population - Yemen (%)
Place of birth for the foreign-born population - Other Western Asia (%)
Place of birth for the foreign-born population - Eritrea (%)
Place of birth for the foreign-born population - Ethiopia (%)
Place of birth for the foreign-born population - Kenya (%)
Place of birth for the foreign-born population - Somalia (%)
Place of birth for the foreign-born population - Uganda (%)
Place of birth for the foreign-born population - Zimbabwe (%)
Place of birth for the foreign-born population - Other Eastern Africa (%)
Place of birth for the foreign-born population - Cameroon (%)
Place of birth for the foreign-born population - Congo (%)
Place of birth for the foreign-born population - Democratic Republic of Congo (Zaire) (%)
Place of birth for the foreign-born population - Other Middle Africa (%)
Place of birth for the foreign-born population - Egypt (%)
Place of birth for the foreign-born population - Morocco (%)
Place of birth for the foreign-born population - Sudan (%)
Place of birth for the foreign-born population - Other Northern Africa (%)
Place of birth for the foreign-born population - South Africa (%)
Place of birth for the foreign-born population - Other Southern Africa (%)
Place of birth for the foreign-born population - Cabo Verde (%)
Place of birth for the foreign-born population - Ghana (%)
Place of birth for the foreign-born population - Liberia (%)
Place of birth for the foreign-born population - Nigeria (%)
Place of birth for the foreign-born population - Senegal (%)
Place of birth for the foreign-born population - Sierra Leone (%)
Place of birth for the foreign-born population - Other Western Africa (%)
Place of birth for the foreign-born population - Australia (%)
Place of birth for the foreign-born population - New Zealand (%)
Place of birth for the foreign-born population - Fiji (%)
Place of birth for the foreign-born population - Micronesia (%)
Place of birth for the foreign-born population - Bahamas (%)
Place of birth for the foreign-born population - Barbados (%)
Place of birth for the foreign-born population - Cuba (%)
Place of birth for the foreign-born population - Dominica (%)
Place of birth for the foreign-born population - Dominican Republic (%)
Place of birth for the foreign-born population - Grenada (%)
Place of birth for the foreign-born population - Haiti (%)
Place of birth for the foreign-born population - Jamaica (%)
Place of birth for the foreign-born population - St. Vincent and the Grenadines (%)
Place of birth for the foreign-born population - Trinidad and Tobago (%)
Place of birth for the foreign-born population - West Indies (%)
Place of birth for the foreign-born population - Other Caribbean (%)
Place of birth for the foreign-born population - Belize (%)
Place of birth for the foreign-born population - Costa Rica (%)
Place of birth for the foreign-born population - El Salvador (%)
Place of birth for the foreign-born population - Guatemala (%)
Place of birth for the foreign-born population - Honduras (%)
Place of birth for the foreign-born population - Mexico (%)
Place of birth for the foreign-born population - Nicaragua (%)
Place of birth for the foreign-born population - Panama (%)
Place of birth for the foreign-born population - Other Central America (%)
Place of birth for the foreign-born population - Argentina (%)
Place of birth for the foreign-born population - Bolivia (%)
Place of birth for the foreign-born population - Brazil (%)
Place of birth for the foreign-born population - Chile (%)
Place of birth for the foreign-born population - Colombia (%)
Place of birth for the foreign-born population - Ecuador (%)
Place of birth for the foreign-born population - Guyana (%)
Place of birth for the foreign-born population - Peru (%)
Place of birth for the foreign-born population - Uruguay (%)
Place of birth for the foreign-born population - Venezuela (%)
Place of birth for the foreign-born population - Other South America (%)
Place of birth for the foreign-born population - Canada (%)
Place of birth for the foreign-born population - Other Northern America (%)
Place of birth for the foreign-born population - Other (%)
Latest news about races in Tampa, FL collected exclusively by city-data.com from local newspapers, TV, and radio stations
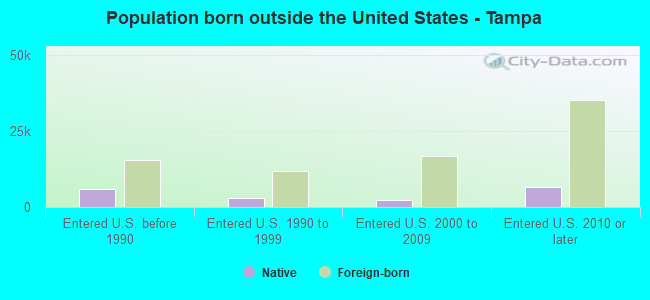
According to 2022 data, the most numerous races in Tampa, FL are White alone (174,866 residents), Hispanic (115,722 residents), and Black alone (71,388 residents). 70.5% of Tampa residents speak English at home. 18.8% of Tampa, FL residents are foreign-born (12.0% born in Latin America, 3.8% born in Asia), which is 11.7% less than the foreign-born rate of 21.0% across the entire state of Florida.
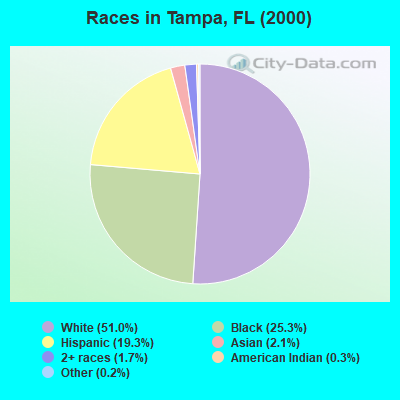
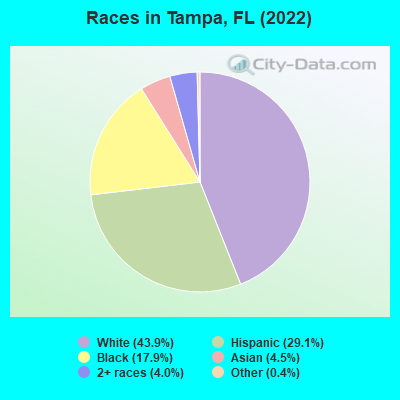
Race distribution in Tampa
2000 2022
154,872 51.0% White alone 76,711 25.3% Black alone 58,522 19.3% Hispanic 6,443 2.1% Asian alone 5,211 1.7% Two or more races 829 0.3% American Indian alone 618 0.2% Other race alone 241 0.08% Native Hawaiian and Other
174,866 43.9% White alone 115,722 29.1% Hispanic 71,388 17.9% Black alone 18,038 4.5% Asian alone 16,038 4.0% Two or more races 1,635 0.4% Other race alone 261 0.07% Native Hawaiian and Other 212 0.05% American Indian alone
2000 2022
10,458,509 65.4% White alone 2,682,715 16.8% Hispanic 2,264,268 14.2% Black alone 261,693 1.6% Asian alone 236,954 1.5% Two or more races 42,358 0.3% American Indian alone 28,994 0.2% Other race alone 6,887 0.04% Native Hawaiian and Other
11,309,403 50.8% White alone 6,025,039 27.1% Hispanic 3,241,015 14.6% Black alone 861,630 3.9% Two or more races 623,692 2.8% Asian alone 152,054 0.7% Other race alone 22,504 0.1% American Indian alone 9,486 0.04% Native Hawaiian and Other
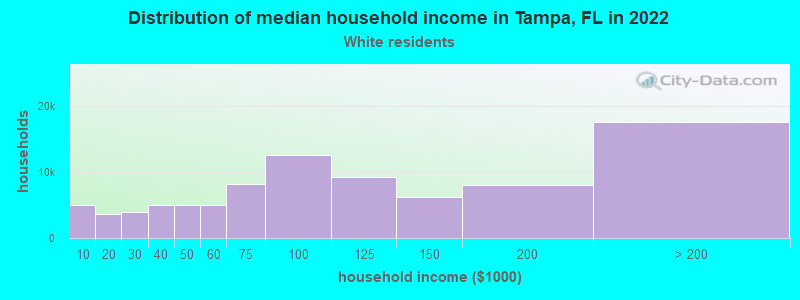
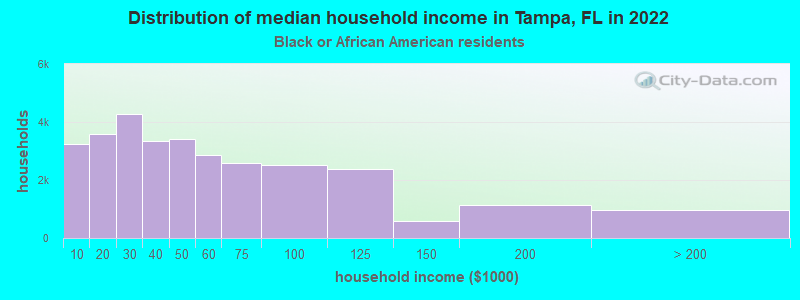
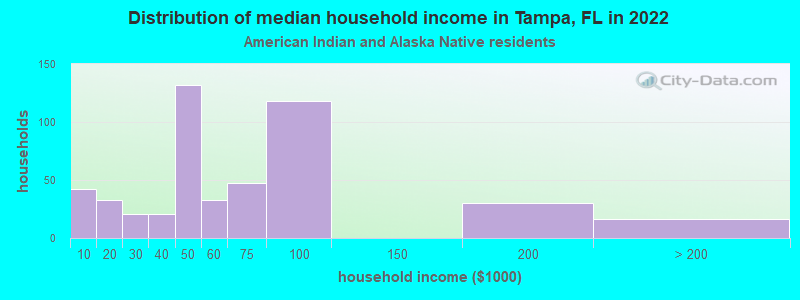
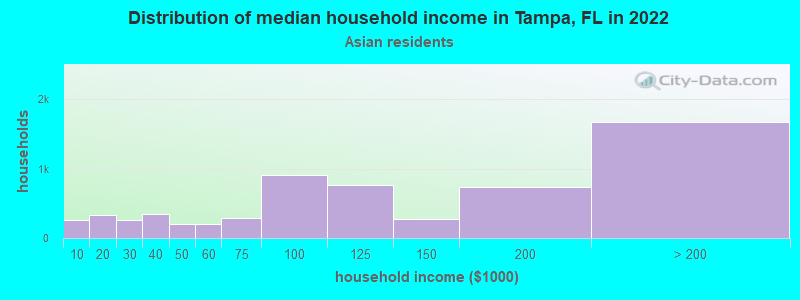
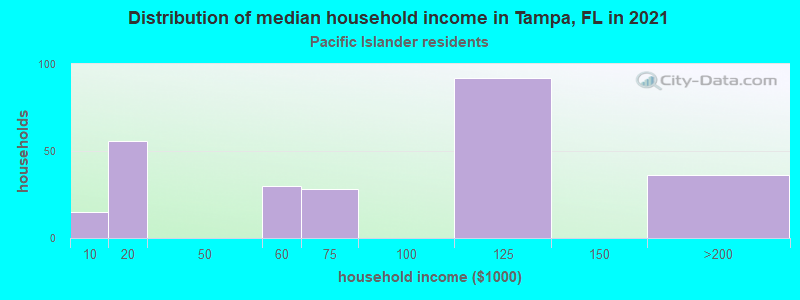
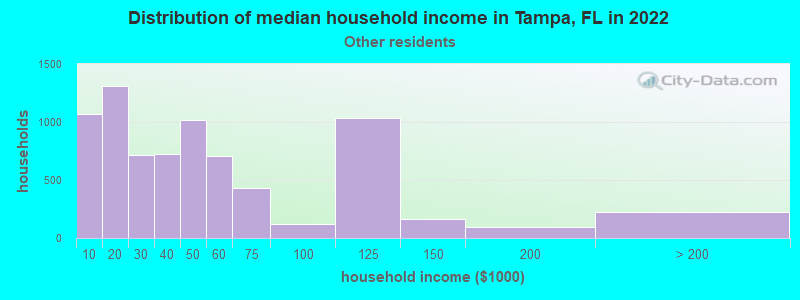
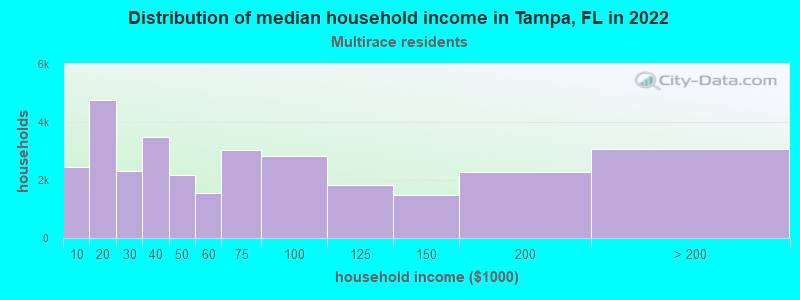
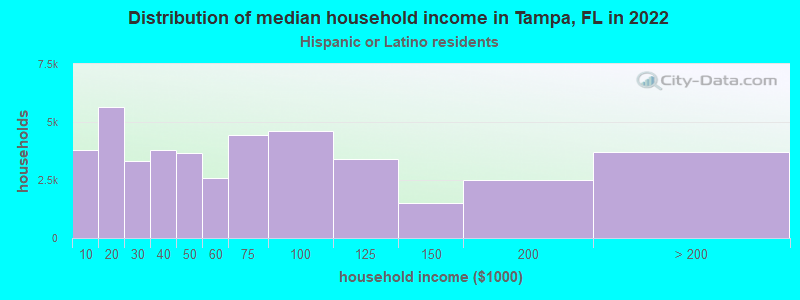
Income and house value in Tampa Median household income in 2022 $94,299 White non-Hispanic householders$42,269 Black householders$49,963 American Indian and Alaska Native householders$116,203 Asian householders$39,948 Some other race householders$52,339 Two or more races householders$55,201 Hispanic or Latino race householdersMedian 2022 house value $485,324 White Non-Hispanic householders$330,268 Black or African American householders$576,807 American Indian or Alaska Native householders $496,695 Asian householders$609,369 Native Hawaiian and other Pacific Islander householders$350,942 Some other race householders$396,425 Two or more races householders$380,403 Hispanic or Latino householders
Median age by race in Tampa
36.2 Median age for White residents37.0 34.8 34.7 Median age for Black or African American residents32.5 35.8 41.1 Median age for American Indian / Alaska Native residents34.9 41.5 38.0 Median age for Asian residents34.9 39.3 19.9 Median age for Native Hawaiian / Pacific Islander residents47.5 -666,666,666.0 35.1 Median age for Other race residents33.6 35.6 33.2 Median age for Two or more races residents31.5 34.0 36.3 Median age for White alone residents37.1 35.0 35.3 Median age for Hispanic or Latino residents34.3 36.3
Owner/renter occupied households by race in Tampa
House owners and renters - White residents 48,154 53.8% Owner occupied41,316 46.2% Renter occupiedHouse owners and renters - Black or African American residents 11,314 36.6% Owner occupied19,611 63.4% Renter occupiedHouse owners and renters - American Indian / Alaska Native residents 287 37.4% Owner occupied480 62.6% Renter occupiedHouse owners and renters - Asian residents 3,972 65.3% Owner occupied2,107 34.7% Renter occupiedHouse owners and renters - Native Hawaiian / Pacific Islander residents 147 56.0% Owner occupied115 44.0% Renter occupiedHouse owners and renters - Other race residents 2,491 32.7% Owner occupied5,131 67.3% Renter occupiedHouse owners and renters - Two or more races residents 15,228 48.7% Owner occupied16,025 51.3% Renter occupiedHouse owners and renters - White alone residents 44,107 53.8% Owner occupied37,864 46.2% Renter occupiedHouse owners and renters - Hispanic or Latino residents 20,256 47.2% Owner occupied22,701 52.8% Renter occupied
Language usage in Tampa
English speakers - Total 70.5% of residents of Tampa speak English at home.
21.0% of residents speak Spanish at home 41,171 52.2% Speak English very well37,734 47.8% Speak English less than very well8.6% of residents speak other language at home 23,000 71.4% Speak English very well9,234 28.6% Speak English less than very well
English speakers - Born in the United States 89.8% of residents of Tampa speak English at home.
8.1% of residents speak Spanish at home 10,140 89.9% Speak English very well1,144 10.1% Speak English less than very well2.1% of residents speak other language at home 2,601 88.7% Speak English very well332 11.3% Speak English less than very well
English speakers - Native, born elsewhere 30.1% of residents of Tampa speak English at home.
67.2% of residents speak Spanish at home 6,743 57.8% Speak English very well4,930 42.2% Speak English less than very well2.8% of residents speak other language at home 427 89.1% Speak English very well52 10.9% Speak English less than very well
English speakers - Foreign-born 18.9% of residents of Tampa speak English at home.
51.5% of residents speak Spanish at home 10,213 25.2% Speak English very well30,283 74.8% Speak English less than very well29.6% of residents speak other language at home 15,085 64.7% Speak English very well8,216 35.3% Speak English less than very well
White (Caucasian) - Speak only English Native:
94.1% (158,767)Foreign-born:
35.7% (5,229)
White (Caucasian) - Speak another language Native:
5.9% (9,871)Foreign-born:
64.3% (9,412)
Black or African American - Speak only English Native:
92.9% (55,691)Foreign-born:
39.9% (4,242)
Black or African American - Speak another language Native:
7.1% (4,286)Foreign-born:
60.1% (6,378)
American Indian / Alaska Native - Speak only English Native:
33.6% (225)Foreign-born:
1.3% (11)
American Indian / Alaska Native - Speak another language Native:
52.5% (351)Foreign-born:
100.0% (849)
Asian - Speak only English Native:
52.8% (3,017)Foreign-born:
20.2% (2,480)
Asian - Speak another language Native:
47.2% (2,695)Foreign-born:
79.8% (9,782)
Native Hawaiian / Pacific Islander - Speak another language Native:
15.8% (81)Foreign-born:
100.0% (9)
Other race - Speak only English Native:
38.2% (4,326)Foreign-born:
7.9% (681)
Other race - Speak another language Native:
61.8% (6,986)Foreign-born:
92.1% (7,966)
Two or more races - Speak only English Native:
55.2% (28,024)Foreign-born:
7.2% (2,233)
Two or more races - Speak another language Native:
44.8% (22,731)Foreign-born:
92.8% (28,682)
White alone - Speak only English Native:
96.5% (149,264)Foreign-born:
39.4% (4,925)
White alone - Speak another language Native:
3.5% (5,380)Foreign-born:
60.6% (7,573)
Hispanic or Latino - Speak only English Native:
45.6% (29,784)Foreign-born:
7.1% (3,093)
Hispanic or Latino - Speak another language Native:
54.4% (35,561)Foreign-born:
92.9% (40,480)
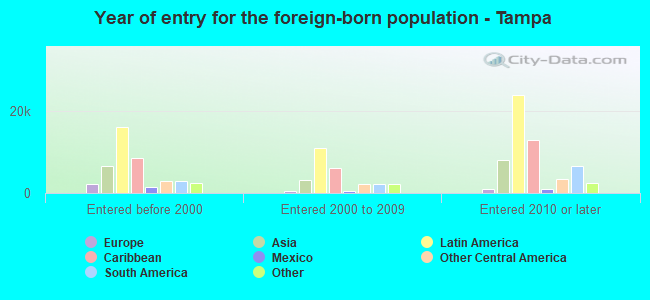
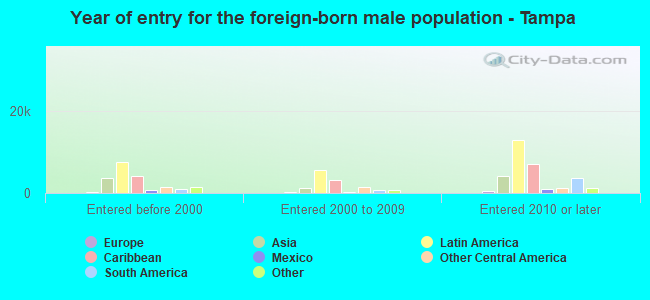
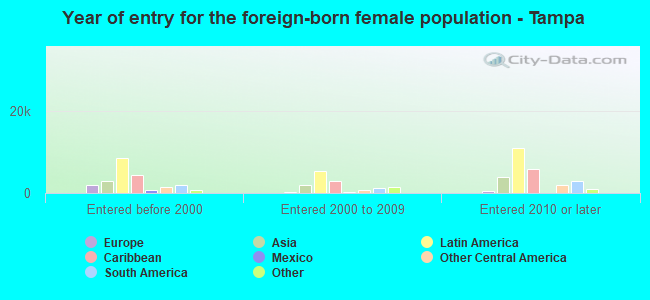
Foreign-born residents in Tampa 75,294 residents are foreign born (12.0% Latin America , 3.8% Asia ).
This city:
18.8%Florida:
21.1%
Marital status for residents in Tampa Marital status - White (Caucasian) population 15 years and over
Males 46.0% Never married42.5% Now married1.1% Separated1.4% Widowed8.9% DivorcedFemales 40.4% Never married40.5% Now married0.9% Separated5.9% Widowed12.2% DivorcedWomen who gave birth in the past 12 months Now married:
66.7% (1,215)Unmarried:
33.3% (607)
Women who did not give birth in the past 12 months Now married:
34.3% (17,727)Unmarried:
65.7% (33,959)
Marital status - Black or African American population 15 years and over
Males 53.5% Never married28.3% Now married2.4% Separated2.3% Widowed13.4% DivorcedFemales 47.2% Never married25.9% Now married5.6% Separated10.8% Widowed10.6% DivorcedWomen who gave birth in the past 12 months Now married:
76.4% (683)Unmarried:
23.6% (211)
Women who did not give birth in the past 12 months Now married:
24.4% (4,315)Unmarried:
75.6% (13,403)
Marital status - American Indian / Alaska Native population 15 years and over
Males 48.0% Never married25.6% Now married11.2% Separated0.0% Widowed15.3% DivorcedFemales 58.4% Never married33.8% Now married3.5% Separated0.0% Widowed4.3% DivorcedWomen who gave birth in the past 12 months Now married:
0.0% (0)Unmarried:
100.0% (22)
Women who did not give birth in the past 12 months Now married:
31.0% (181)Unmarried:
69.0% (402)
Marital status - Asian population 15 years and over
Males 45.5% Never married51.6% Now married2.3% Separated0.0% Widowed0.6% DivorcedFemales 24.4% Never married67.2% Now married0.0% Separated3.1% Widowed5.3% DivorcedWomen who gave birth in the past 12 months Now married:
100.0% (207)Unmarried:
0.0% (0)
Women who did not give birth in the past 12 months Now married:
58.3% (2,975)Unmarried:
41.7% (2,124)
Marital status - Native Hawaiian / Pacific Islander population 15 years and over
Males 25.4% Never married66.5% Now married0.0% Separated0.0% Widowed8.1% DivorcedFemales 61.2% Never married21.1% Now married1.0% Separated13.4% Widowed3.3% DivorcedWomen who did not give birth in the past 12 months Now married:
33.1% (35)Unmarried:
66.9% (70)
Marital status - Other race population 15 years and over
Males 49.5% Never married38.3% Now married0.0% Separated3.4% Widowed8.8% DivorcedFemales 49.1% Never married27.1% Now married1.8% Separated7.7% Widowed14.3% DivorcedWomen who gave birth in the past 12 months Now married:
33.3% (126)Unmarried:
66.7% (253)
Women who did not give birth in the past 12 months Now married:
35.0% (2,030)Unmarried:
65.0% (3,771)
Marital status - Two or more races population 15 years and over
Males 45.7% Never married41.4% Now married3.1% Separated1.2% Widowed8.6% DivorcedFemales 40.8% Never married35.8% Now married1.4% Separated6.5% Widowed15.6% DivorcedWomen who gave birth in the past 12 months Now married:
67.3% (429)Unmarried:
32.7% (208)
Women who did not give birth in the past 12 months Now married:
31.1% (7,155)Unmarried:
68.9% (15,816)
Marital status - White alone, not Hispanic / Latino population 15 years and over
Males 45.9% Never married42.8% Now married1.1% Separated1.6% Widowed8.6% DivorcedFemales 39.7% Never married41.2% Now married0.8% Separated5.9% Widowed12.4% DivorcedWomen who gave birth in the past 12 months Now married:
60.6% (934)Unmarried:
39.4% (607)
Women who did not give birth in the past 12 months Now married:
35.5% (16,802)Unmarried:
64.5% (30,496)
Marital status - Hispanic or Latino population 15 years and over
Males 46.4% Never married39.9% Now married3.0% Separated1.3% Widowed9.4% DivorcedFemales 40.7% Never married34.4% Now married2.4% Separated7.4% Widowed15.2% DivorcedWomen who gave birth in the past 12 months Now married:
55.7% (836)Unmarried:
44.3% (664)
Women who did not give birth in the past 12 months Now married:
31.6% (9,530)Unmarried:
68.4% (20,587)
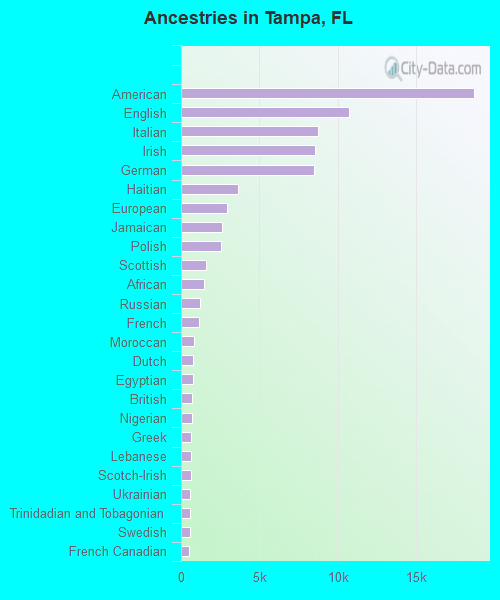
Ancestries in Tampa
18,740 8.1% American10,717 4.6% English8,751 3.8% Italian8,577 3.7% Irish8,521 3.7% German3,627 1.6% Haitian2,966 1.3% European2,591 1.1% Jamaican2,545 1.1% Polish1,566 0.7% Scottish1,456 0.6% African1,189 0.5% Russian1,119 0.5% French822 0.4% Moroccan794 0.3% Dutch757 0.3% Egyptian698 0.3% British686 0.3% Nigerian666 0.3% Greek633 0.3% Lebanese620 0.3% Scotch-Irish606 0.3% Ukrainian598 0.3% Trinidadian and Tobagonian569 0.2% Swedish529 0.2% French Canadian525 0.2% Bahamian497 0.2% Arab490 0.2% Iranian480 0.2% Eastern European479 0.2% Palestinian473 0.2% Norwegian440 0.2% Portuguese408 0.2% British West Indian347 0.2% Hungarian335 0.1% Iraqi331 0.1% Brazilian328 0.1% Albanian321 0.1% Syrian317 0.1% Bulgarian314 0.1% Israeli286 0.1% U.S. Virgin Islander285 0.1% Ethiopian279 0.1% Czech279 0.1% Turkish275 0.1% Romanian252 0.1% West Indian228 0.10% Northern European228 0.10% Welsh227 0.10% Lithuanian226 0.10% Scandinavian208 0.09% Canadian182 0.08% Danish179 0.08% Slovak171 0.07% Yugoslavian159 0.07% Jordanian149 0.06% Austrian130 0.06% Swiss128 0.06% Guyanese121 0.05% Croatian117 0.05% South African81 0.04% Slavic79 0.03% Australian74 0.03% Afghan73 0.03% Belgian64 0.03% Kenyan64 0.03% Armenian64 0.03% Macedonian61 0.03% Icelander61 0.03% Serbian52 0.02% Basque43 0.02% Celtic40 0.02% Finnish35 0.02% Dutch West Indian31 0.01% Belizean28 0.01% Ugandan26 0.01% Cypriot23 0.01% Zimbabwean22 0.01% Assyrian21 0.01% Slovene19 0.01% Maltese19 0.01% Sierra Leonean17 0.01% Liberian
Geographical mobility in Tampa Same house 1 year ago 142,876 75.0% White (Caucasian)62,869 83.5% Black or African American1,364 93.2% American Indian / Alaska Native15,839 84.9% Asian417 81.3% Native Hawaiian / Pacific Islander16,617 78.6% Other race67,507 77.5% Two or more races130,164 74.8% White alone, not Hispanic / Latino89,643 78.3% Hispanic or LatinoMoved within same county 22,963 12.0% White / Caucasian8,363 11.1% Black or African American74 5.1% American Indian / Alaska Native421 2.3% Asian52 10.2% Native Hawaiian / Pacific Islander2,606 12.3% Other race7,843 9.0% Two or more races20,532 11.8% White alone, not Hispanic / Latino10,922 9.5% Hispanic or LatinoMoved within same state 8,921 4.7% White / Caucasian1,730 2.3% Black or African American29 2.0% American Indian / Alaska Native1,028 5.5% Asian9 1.7% Native Hawaiian / Pacific Islander743 3.5% Other race3,716 4.3% Two or more races7,882 4.5% White alone, not Hispanic / Latino4,632 4.0% Hispanic or LatinoMoved from different state 14,919 7.8% White / Caucasian1,491 2.0% Black or African American10 0.7% American Indian / Alaska Native824 4.4% Asian94 18.3% Native Hawaiian / Pacific Islander129 0.6% Other race5,067 5.8% Two or more races14,600 8.4% White alone, not Hispanic / Latino5,102 4.5% Hispanic or LatinoMoved from abroad 934 0.5% White870 1.2% Black or African American535 2.9% Asian1,034 4.9% Other race2,984 3.4% Two or more races934 0.5% White alone, not Hispanic / Latino4,176 3.6% Hispanic or Latino
Children Nativity (place of birth) in Tampa
Children under 6 years - Living with two parents Both parents native 9,364 100.0% NativeBoth parents foreign-born 1,779 73.3% Native648 26.7% Foreign-bornOne native, one foreign-born parent 1,726 100.0% NativeChildren under 6 years - Living with one parent Native parent 6,971 100.0% NativeForeign-born parent 2,897 85.5% Native490 14.5% Foreign-bornChildren 6 to 17 years - Living with two parents Both parents native 16,888 100.0% NativeBoth parents foreign-born 6,931 80.0% Native1,729 20.0% Foreign-bornOne native, one foreign-born parent 2,190 91.6% Native201 8.4% Foreign-bornChildren 6 to 17 years - Living with one parent Native parent 13,474 100.0% NativeForeign-born parent 5,946 60.2% Native3,931 39.8% Foreign-born
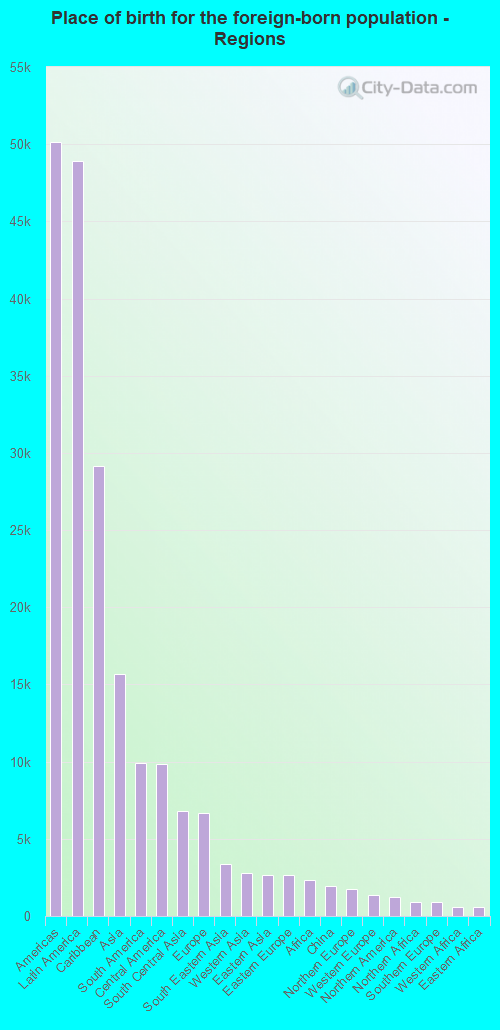
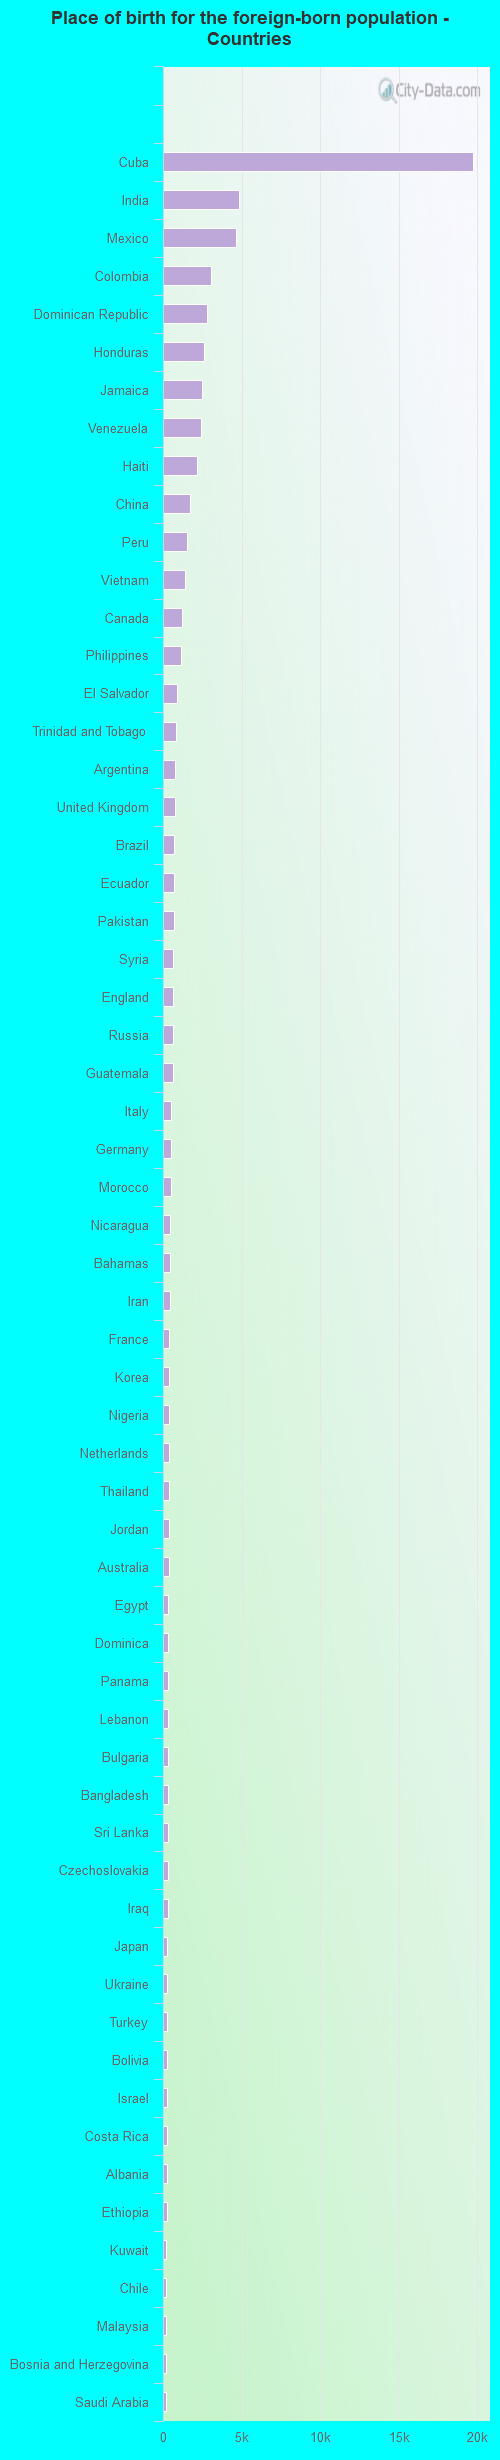
Place of birth for residents in Tampa 50,150 Americas48,941 Latin America29,170 Caribbean15,667 Asia9,897 South America9,873 Central America6,790 South Central Asia6,682 Europe3,342 South Eastern Asia2,806 Western Asia2,641 Eastern Asia2,634 Eastern Europe2,362 Africa1,950 China1,780 Northern Europe1,334 Western Europe1,208 Northern America909 Northern Africa895 Southern Europe581 Western Africa569 Eastern Africa431 Oceania417 Australia and New Zealand Subregion119 Southern Africa106 Middle Africa19,763 Cuba4,836 India4,630 Mexico3,056 Colombia2,827 Dominican Republic2,639 Honduras2,504 Jamaica2,391 Venezuela2,146 Haiti1,724 China1,540 Peru1,401 Vietnam1,190 Canada1,138 Philippines911 El Salvador805 Trinidad and Tobago772 Argentina752 United Kingdom725 Brazil702 Ecuador699 Pakistan635 Syria624 England618 Russia608 Guatemala527 Italy527 Germany494 Morocco470 Nicaragua437 Bahamas423 Iran401 France398 Korea392 Nigeria386 Netherlands375 Thailand353 Jordan353 Australia328 Egypt316 Dominica308 Panama306 Lebanon303 Bulgaria298 Bangladesh293 Sri Lanka291 Czechoslovakia291 Iraq283 Japan282 Ukraine271 Turkey267 Bolivia253 Israel246 Costa Rica242 Albania235 Ethiopia213 Kuwait202 Chile192 Malaysia189 Bosnia and Herzegovina187 Saudi Arabia162 Kenya154 Greece142 Guyana136 Romania136 Indonesia134 Ireland133 Poland120 Taiwan108 Spain105 Hong Kong94 Armenia91 Hungary90 West Indies90 Congo87 South Africa74 Nepal70 Sweden69 Grenada69 Uruguay65 Kazakhstan64 Ivory Coast63 Portugal63 New Zealand61 Uganda57 Belize51 Barbados48 Moldova46 Scotland43 Denmark37 Afghanistan36 Croatia36 Sierra Leone35 Burma (Myanmar)34 Ghana33 Belarus32 Liberia31 Zimbabwe30 Georgia30 United Arab Emirates29 Norway29 Azerbaijan28 Cambodia28 St. Vincent and the Grenadines23 Eritrea20 Laos20 Togo17 Tanzania15 Cameroon13 Austria12 Singapore12 Azores Islands8 Uzbekistan6 Latvia5 Fiji5 Belgium
Grandparents responsible for own grandchildren in Tampa
Grandparents (30 to 59 years) White / Caucasian 140 22.5% Responsible for grandchildren484 77.5% Not responsible for grandchildrenBlack or African American 136 17.6% Responsible for grandchildren638 82.4% Not responsible for grandchildrenAsian 53 31.0% Responsible for grandchildren118 69.0% Not responsible for grandchildrenOther race 31 18.0% Responsible for grandchildren139 82.0% Not responsible for grandchildrenTwo or more races 288 60.9% Responsible for grandchildren185 39.1% Not responsible for grandchildrenWhite alone, not Hispanic / Latino 85 28.2% Responsible for grandchildren217 71.8% Not responsible for grandchildrenHispanic or Latino 469 53.5% Responsible for grandchildren408 46.5% Not responsible for grandchildrenGrandparents (60 years and over) White / Caucasian 603 37.3% Responsible for grandchildren1,015 62.7% Not responsible for grandchildrenBlack or African American 370 39.5% Responsible for grandchildren567 60.5% Not responsible for grandchildrenAsian 5 1.1% Responsible for grandchildren425 98.9% Not responsible for grandchildrenOther race 32 11.2% Responsible for grandchildren249 88.8% Not responsible for grandchildrenTwo or more races 153 9.7% Responsible for grandchildren1,419 90.3% Not responsible for grandchildrenWhite alone, not Hispanic / Latino 614 38.9% Responsible for grandchildren965 61.1% Not responsible for grandchildrenHispanic or Latino 322 16.5% Responsible for grandchildren1,630 83.5% Not responsible for grandchildren
Zip codes: 33602 , 33603 , 33605 , 33606 , 33607 , 33609 , 33611 , 33615 , 33616 , 33620 , 33621 , 33629 , 33634 , 33635 .