Races in Tarpon Springs, Florida (FL) Detailed Stats
Data:
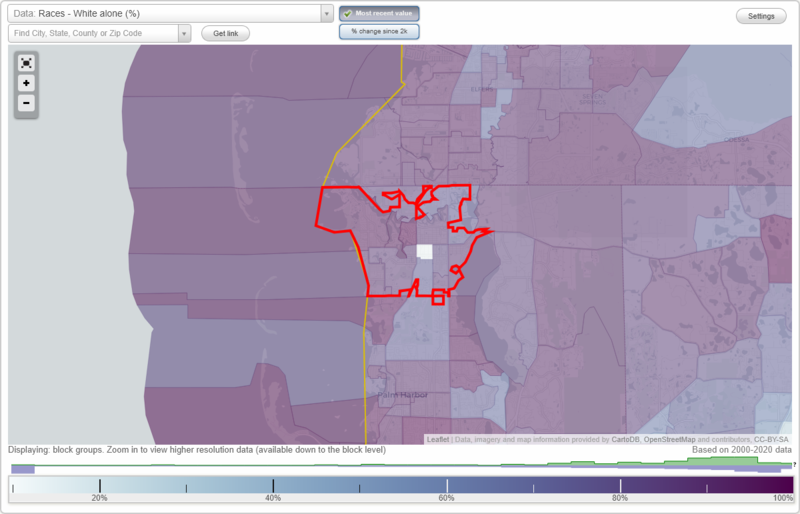
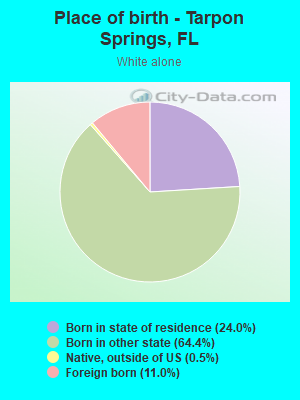
Races - White alone (%)
Races - White alone (% change since 2000)
Races - Black alone (%)
Races - Black alone (% change since 2000)
Races - American Indian alone (%)
Races - American Indian alone (% change since 2000)
Races - Asian alone (%)
Races - Asian alone (% change since 2000)
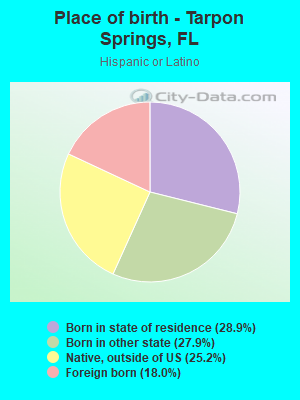
Races - Hispanic (%)
Races - Hispanic (% change since 2000)
Races - Native Hawaiian and Other Pacific Islander alone (%)
Races - Native Hawaiian and Other Pacific Islander alone (% change since 2000)
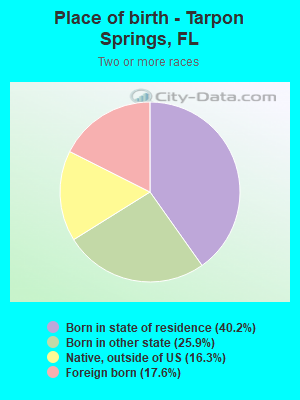
Races - Two or more races(%)
Races - Two or more races(% change since 2000)
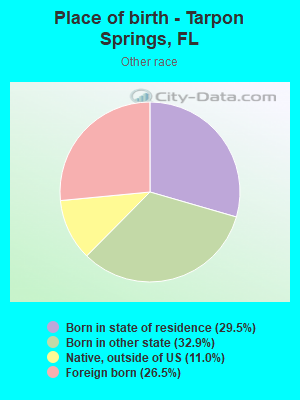
Races - Other race alone (%)
Races - Other race alone (% change since 2000)
Racial diversity
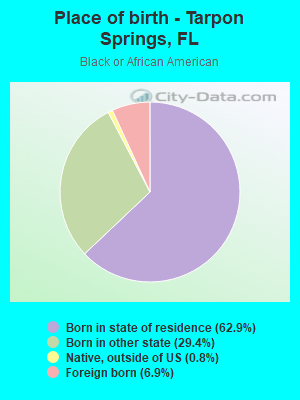
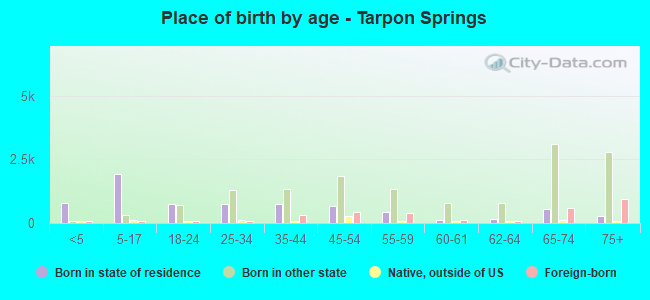
Place of birth - Born in state of residence (%)
Place of birth - Born in state of residence (%) - White
Place of birth - Born in state of residence (%) - Black or African American
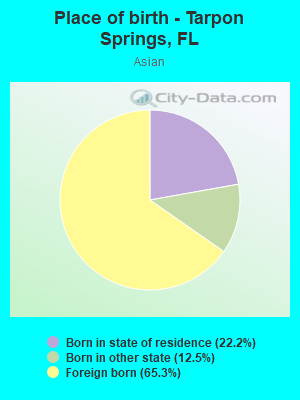
Place of birth - Born in state of residence (%) - Asian
Place of birth - Born in state of residence (%) - Hispanic or Latino
Place of birth - Born in state of residence (%) - American Indian and Alaska Native
Place of birth - Born in state of residence (%) - Multirace
Place of birth - Born in state of residence (%) - Other Race
Place of birth - Born in other state (%)
Place of birth - Born in other state (%) - White
Place of birth - Born in other state (%) - Black or African American
Place of birth - Born in other state (%) - Asian
Place of birth - Born in other state (%) - Hispanic or Latino
Place of birth - Born in other state (%) - American Indian and Alaska Native
Place of birth - Born in other state (%) - Multirace
Place of birth - Born in other state (%) - Other Race
Place of birth - Native, outside of US (%)
Place of birth - Native, outside of US (%) - White
Place of birth - Native, outside of US (%) - Black or African American
Place of birth - Native, outside of US (%) - Asian
Place of birth - Native, outside of US (%) - Hispanic or Latino
Place of birth - Native, outside of US (%) - American Indian and Alaska Native
Place of birth - Native, outside of US (%) - Multirace
Place of birth - Native, outside of US (%) - Other Race
Place of birth - Foreign born (%)
Place of birth - Foreign born (%) - White
Place of birth - Foreign born (%) - Black or African American
Place of birth - Foreign born (%) - Asian
Place of birth - Foreign born (%) - Hispanic or Latino
Place of birth - Foreign born (%) - American Indian and Alaska Native
Place of birth - Foreign born (%) - Multirace
Place of birth - Foreign born (%) - Other Race
Residents speaking English at home (%)
Residents speaking English at home - Born in the United States (%)
Residents speaking English at home - Native, born elsewhere (%)
Residents speaking English at home - Foreign born (%)
Residents speaking Spanish at home (%)
Residents speaking Spanish at home - Born in the United States (%)
Residents speaking Spanish at home - Native, born elsewhere (%)
Residents speaking Spanish at home - Foreign born (%)
Residents speaking other language at home (%)
Residents speaking other language at home - Born in the United States (%)
Residents speaking other language at home - Native, born elsewhere (%)
Residents speaking other language at home - Foreign born (%)
Marital status - Never married (%)
Marital status - Now married (%)
Marital status - Separated (%)
Marital status - Widowed (%)
Marital status - Divorced (%)
Ancestries Reported - Arab (%)
Ancestries Reported - Czech (%)
Ancestries Reported - Danish (%)
Ancestries Reported - Dutch (%)
Ancestries Reported - English (%)
Ancestries Reported - French (%)
Ancestries Reported - French Canadian (%)
Ancestries Reported - German (%)
Ancestries Reported - Greek (%)
Ancestries Reported - Hungarian (%)
Ancestries Reported - Irish (%)
Ancestries Reported - Italian (%)
Ancestries Reported - Lithuanian (%)
Ancestries Reported - Norwegian (%)
Ancestries Reported - Polish (%)
Ancestries Reported - Portuguese (%)
Ancestries Reported - Russian (%)
Ancestries Reported - Scotch-Irish (%)
Ancestries Reported - Scottish (%)
Ancestries Reported - Slovak (%)
Ancestries Reported - Subsaharan African (%)
Ancestries Reported - Swedish (%)
Ancestries Reported - Swiss (%)
Ancestries Reported - Ukrainian (%)
Ancestries Reported - United States (%)
Ancestries Reported - Welsh (%)
Ancestries Reported - West Indian (%)
Ancestries Reported - Other (%)
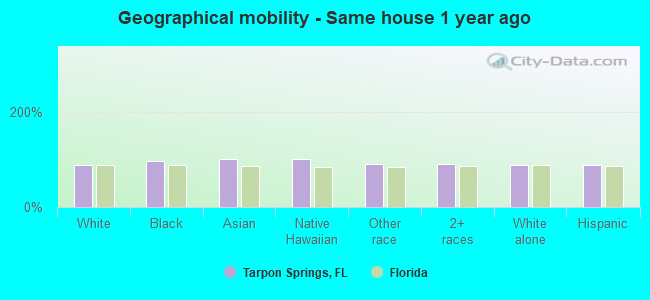
Geographical mobility - Same house 1 year ago (%)
Geographical mobility - Same house 1 year ago (%) - White
Geographical mobility - Same house 1 year ago (%) - Black or African American
Geographical mobility - Same house 1 year ago (%) - Asian
Geographical mobility - Same house 1 year ago (%) - Hispanic or Latino
Geographical mobility - Same house 1 year ago (%) - American Indian and Alaska Native
Geographical mobility - Same house 1 year ago (%) - Multirace
Geographical mobility - Same house 1 year ago (%) - Other Race
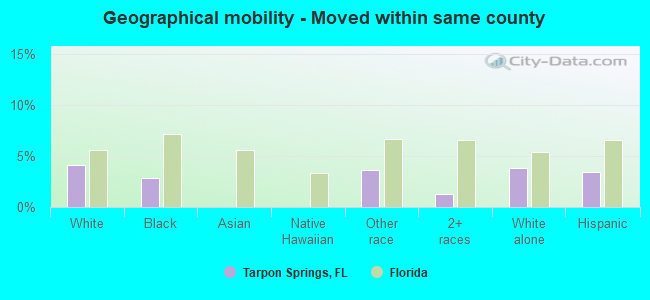
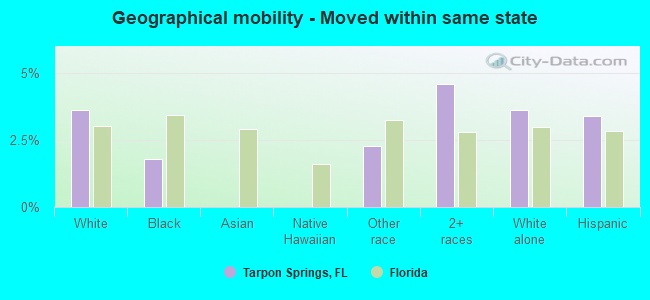
Geographical mobility - Moved within same county (%)
Geographical mobility - Moved within same county (%) - White
Geographical mobility - Moved within same county (%) - Black or African American
Geographical mobility - Moved within same county (%) - Asian
Geographical mobility - Moved within same county (%) - Hispanic or Latino
Geographical mobility - Moved within same county (%) - American Indian and Alaska Native
Geographical mobility - Moved within same county (%) - Multirace
Geographical mobility - Moved within same county (%) - Other Race
Geographical mobility - Moved from different county within same state (%)
Geographical mobility - Moved from different county within same state (%) - White
Geographical mobility - Moved from different county within same state (%) - Black or African American
Geographical mobility - Moved from different county within same state (%) - Asian
Geographical mobility - Moved from different county within same state (%) - Hispanic or Latino
Geographical mobility - Moved from different county within same state (%) - American Indian and Alaska Native
Geographical mobility - Moved from different county within same state (%) - Multirace
Geographical mobility - Moved from different county within same state (%) - Other Race
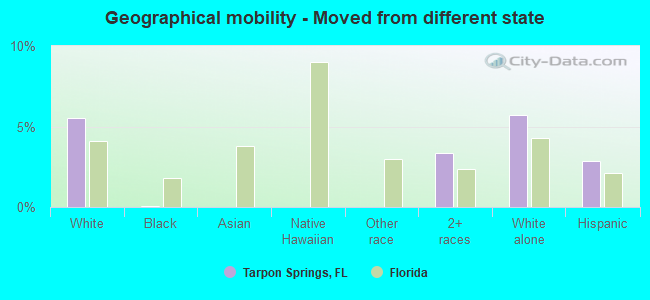
Geographical mobility - Moved from different state (%)
Geographical mobility - Moved from different state (%) - White
Geographical mobility - Moved from different state (%) - Black or African American
Geographical mobility - Moved from different state (%) - Asian
Geographical mobility - Moved from different state (%) - Hispanic or Latino
Geographical mobility - Moved from different state (%) - American Indian and Alaska Native
Geographical mobility - Moved from different state (%) - Multirace
Geographical mobility - Moved from different state (%) - Other Race
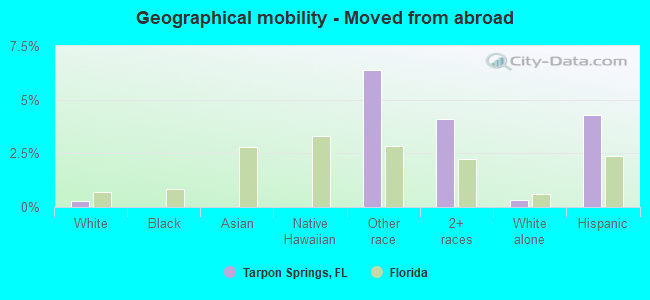
Geographical mobility - Moved from abroad (%)
Geographical mobility - Moved from abroad (%) - White
Geographical mobility - Moved from abroad (%) - Black or African American
Geographical mobility - Moved from abroad (%) - Asian
Geographical mobility - Moved from abroad (%) - Hispanic or Latino
Geographical mobility - Moved from abroad (%) - American Indian and Alaska Native
Geographical mobility - Moved from abroad (%) - Multirace
Geographical mobility - Moved from abroad (%) - Other Race
Place of birth for the foreign-born population - Ireland (%)
Place of birth for the foreign-born population - Denmark (%)
Place of birth for the foreign-born population - Norway (%)
Place of birth for the foreign-born population - Sweden (%)
Place of birth for the foreign-born population - United Kingdom (%)
Place of birth for the foreign-born population - England (%)
Place of birth for the foreign-born population - Scotland (%)
Place of birth for the foreign-born population - Other Northern Europe (%)
Place of birth for the foreign-born population - Austria (%)
Place of birth for the foreign-born population - Belgium (%)
Place of birth for the foreign-born population - France (%)
Place of birth for the foreign-born population - Germany (%)
Place of birth for the foreign-born population - Netherlands (%)
Place of birth for the foreign-born population - Switzerland (%)
Place of birth for the foreign-born population - Other Western Europe (%)
Place of birth for the foreign-born population - Greece (%)
Place of birth for the foreign-born population - Italy (%)
Place of birth for the foreign-born population - Portugal (%)
Place of birth for the foreign-born population - Spain (%)
Place of birth for the foreign-born population - Other Southern Europe (%)
Place of birth for the foreign-born population - Albania (%)
Place of birth for the foreign-born population - Belarus (%)
Place of birth for the foreign-born population - Bosnia and Herzegovina (%)
Place of birth for the foreign-born population - Bulgaria (%)
Place of birth for the foreign-born population - Croatia (%)
Place of birth for the foreign-born population - Czechoslovakia (%)
Place of birth for the foreign-born population - Hungary (%)
Place of birth for the foreign-born population - Latvia (%)
Place of birth for the foreign-born population - Lithuania (%)
Place of birth for the foreign-born population - North Macedonia (Macedonia) (%)
Place of birth for the foreign-born population - Moldova (%)
Place of birth for the foreign-born population - Poland (%)
Place of birth for the foreign-born population - Romania (%)
Place of birth for the foreign-born population - Russia (%)
Place of birth for the foreign-born population - Serbia (%)
Place of birth for the foreign-born population - Ukraine (%)
Place of birth for the foreign-born population - Other Eastern Europe (%)
Place of birth for the foreign-born population - China (%)
Place of birth for the foreign-born population - Hong Kong (%)
Place of birth for the foreign-born population - Taiwan (%)
Place of birth for the foreign-born population - Japan (%)
Place of birth for the foreign-born population - Korea (%)
Place of birth for the foreign-born population - Other Eastern Asia (%)
Place of birth for the foreign-born population - Afghanistan (%)
Place of birth for the foreign-born population - Bangladesh (%)
Place of birth for the foreign-born population - India (%)
Place of birth for the foreign-born population - Iran (%)
Place of birth for the foreign-born population - Kazakhstan (%)
Place of birth for the foreign-born population - Nepal (%)
Place of birth for the foreign-born population - Pakistan (%)
Place of birth for the foreign-born population - Sri Lanka (%)
Place of birth for the foreign-born population - Uzbekistan (%)
Place of birth for the foreign-born population - Other South Central Asia (%)
Place of birth for the foreign-born population - Burma (%)
Place of birth for the foreign-born population - Cambodia (%)
Place of birth for the foreign-born population - Indonesia (%)
Place of birth for the foreign-born population - Laos (%)
Place of birth for the foreign-born population - Malaysia (%)
Place of birth for the foreign-born population - Philippines (%)
Place of birth for the foreign-born population - Singapore (%)
Place of birth for the foreign-born population - Thailand (%)
Place of birth for the foreign-born population - Vietnam (%)
Place of birth for the foreign-born population - Other South Eastern Asia (%)
Place of birth for the foreign-born population - Armenia (%)
Place of birth for the foreign-born population - Iraq (%)
Place of birth for the foreign-born population - Israel (%)
Place of birth for the foreign-born population - Jordan (%)
Place of birth for the foreign-born population - Kuwait (%)
Place of birth for the foreign-born population - Lebanon (%)
Place of birth for the foreign-born population - Saudi Arabia (%)
Place of birth for the foreign-born population - Syria (%)
Place of birth for the foreign-born population - Turkey (%)
Place of birth for the foreign-born population - Yemen (%)
Place of birth for the foreign-born population - Other Western Asia (%)
Place of birth for the foreign-born population - Eritrea (%)
Place of birth for the foreign-born population - Ethiopia (%)
Place of birth for the foreign-born population - Kenya (%)
Place of birth for the foreign-born population - Somalia (%)
Place of birth for the foreign-born population - Uganda (%)
Place of birth for the foreign-born population - Zimbabwe (%)
Place of birth for the foreign-born population - Other Eastern Africa (%)
Place of birth for the foreign-born population - Cameroon (%)
Place of birth for the foreign-born population - Congo (%)
Place of birth for the foreign-born population - Democratic Republic of Congo (Zaire) (%)
Place of birth for the foreign-born population - Other Middle Africa (%)
Place of birth for the foreign-born population - Egypt (%)
Place of birth for the foreign-born population - Morocco (%)
Place of birth for the foreign-born population - Sudan (%)
Place of birth for the foreign-born population - Other Northern Africa (%)
Place of birth for the foreign-born population - South Africa (%)
Place of birth for the foreign-born population - Other Southern Africa (%)
Place of birth for the foreign-born population - Cabo Verde (%)
Place of birth for the foreign-born population - Ghana (%)
Place of birth for the foreign-born population - Liberia (%)
Place of birth for the foreign-born population - Nigeria (%)
Place of birth for the foreign-born population - Senegal (%)
Place of birth for the foreign-born population - Sierra Leone (%)
Place of birth for the foreign-born population - Other Western Africa (%)
Place of birth for the foreign-born population - Australia (%)
Place of birth for the foreign-born population - New Zealand (%)
Place of birth for the foreign-born population - Fiji (%)
Place of birth for the foreign-born population - Micronesia (%)
Place of birth for the foreign-born population - Bahamas (%)
Place of birth for the foreign-born population - Barbados (%)
Place of birth for the foreign-born population - Cuba (%)
Place of birth for the foreign-born population - Dominica (%)
Place of birth for the foreign-born population - Dominican Republic (%)
Place of birth for the foreign-born population - Grenada (%)
Place of birth for the foreign-born population - Haiti (%)
Place of birth for the foreign-born population - Jamaica (%)
Place of birth for the foreign-born population - St. Vincent and the Grenadines (%)
Place of birth for the foreign-born population - Trinidad and Tobago (%)
Place of birth for the foreign-born population - West Indies (%)
Place of birth for the foreign-born population - Other Caribbean (%)
Place of birth for the foreign-born population - Belize (%)
Place of birth for the foreign-born population - Costa Rica (%)
Place of birth for the foreign-born population - El Salvador (%)
Place of birth for the foreign-born population - Guatemala (%)
Place of birth for the foreign-born population - Honduras (%)
Place of birth for the foreign-born population - Mexico (%)
Place of birth for the foreign-born population - Nicaragua (%)
Place of birth for the foreign-born population - Panama (%)
Place of birth for the foreign-born population - Other Central America (%)
Place of birth for the foreign-born population - Argentina (%)
Place of birth for the foreign-born population - Bolivia (%)
Place of birth for the foreign-born population - Brazil (%)
Place of birth for the foreign-born population - Chile (%)
Place of birth for the foreign-born population - Colombia (%)
Place of birth for the foreign-born population - Ecuador (%)
Place of birth for the foreign-born population - Guyana (%)
Place of birth for the foreign-born population - Peru (%)
Place of birth for the foreign-born population - Uruguay (%)
Place of birth for the foreign-born population - Venezuela (%)
Place of birth for the foreign-born population - Other South America (%)
Place of birth for the foreign-born population - Canada (%)
Place of birth for the foreign-born population - Other Northern America (%)
Place of birth for the foreign-born population - Other (%)
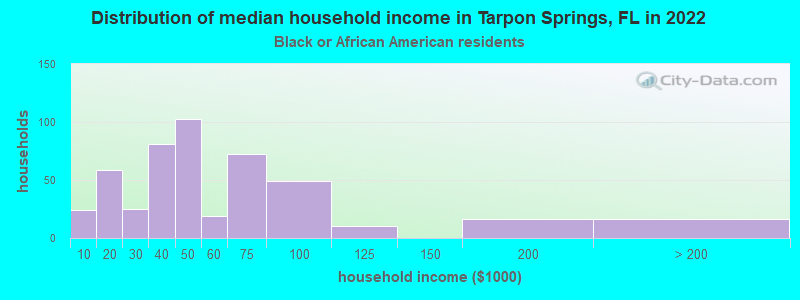
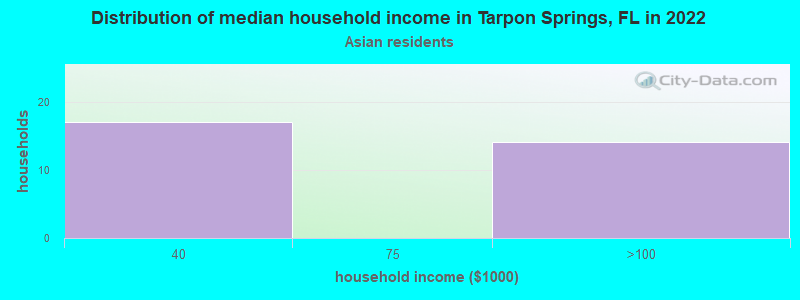
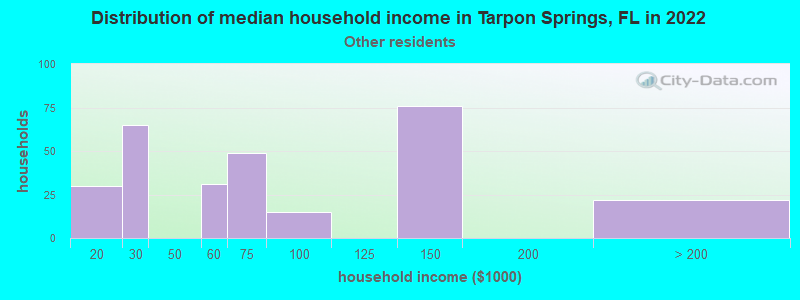
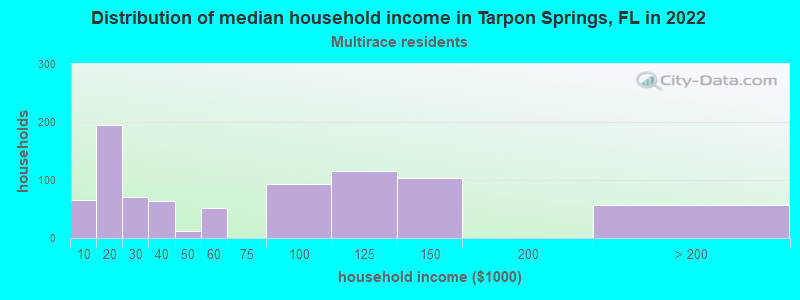
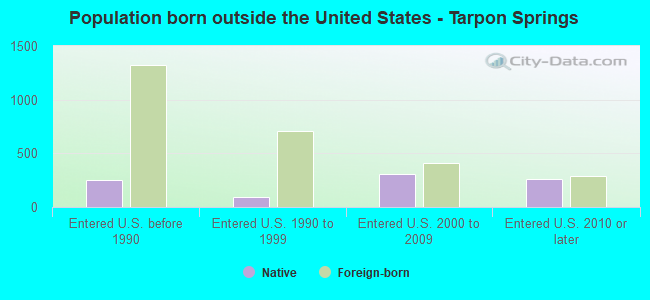
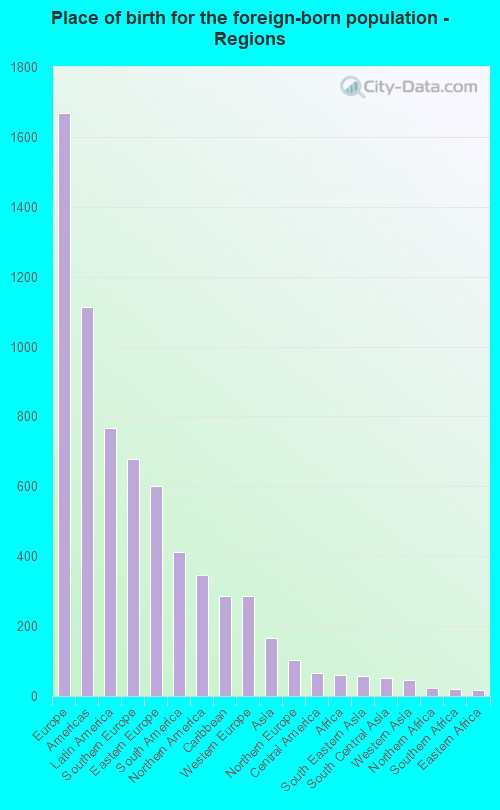
According to 2022 data, the most numerous races in Tarpon Springs, FL are White alone (19,668 residents), Hispanic (3,068 residents), and Black alone (1,519 residents). 82.7% of Tarpon Springs residents speak English at home. 11.8% of Tarpon Springs, FL residents are foreign-born (6.3% born in Europe, 2.9% born in Latin America, 1.3% born in North America), which is 77.3% less than the foreign-born rate of 21.0% across the entire state of Florida.
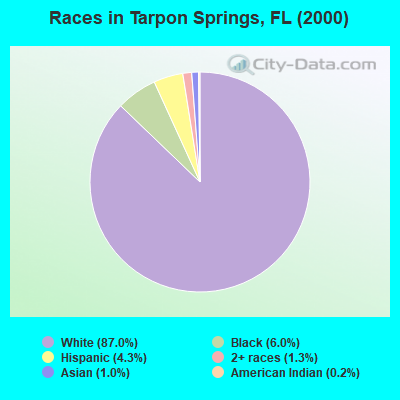
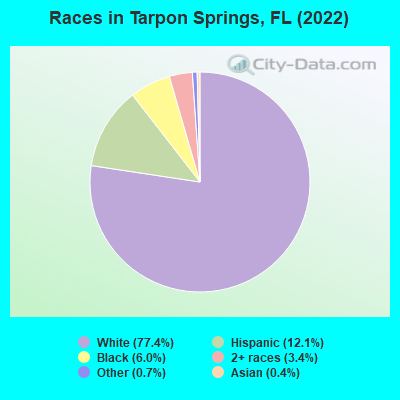
Race distribution in Tarpon Springs
2000 2022
10,458,509 65.4% White alone 2,682,715 16.8% Hispanic 2,264,268 14.2% Black alone 261,693 1.6% Asian alone 236,954 1.5% Two or more races 42,358 0.3% American Indian alone 28,994 0.2% Other race alone 6,887 0.04% Native Hawaiian and Other
11,309,403 50.8% White alone 6,025,039 27.1% Hispanic 3,241,015 14.6% Black alone 861,630 3.9% Two or more races 623,692 2.8% Asian alone 152,054 0.7% Other race alone 22,504 0.1% American Indian alone 9,486 0.04% Native Hawaiian and Other
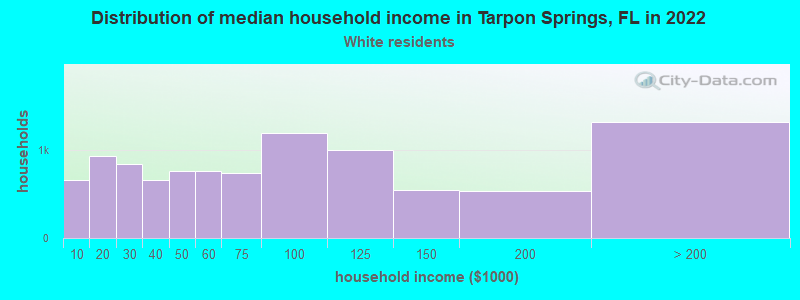
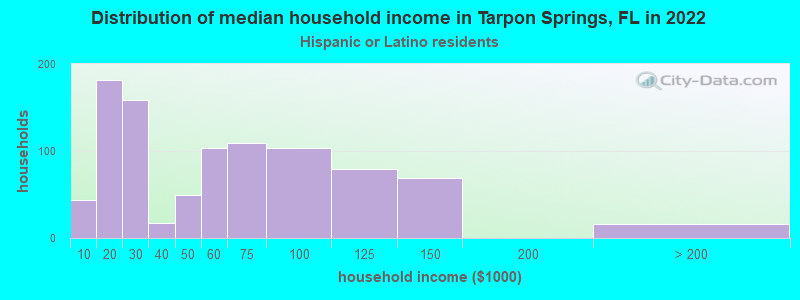
Income and house value in Tarpon Springs Median household income in 2022 $67,234 White non-Hispanic householders$45,900 Black householders$61,515 Some other race householders$55,808 Hispanic or Latino race householdersMedian 2022 house value $429,721 White Non-Hispanic householders$255,047 Black or African American householders $629,859 Asian householders$611,158 Two or more races householders$382,372 Hispanic or Latino householders
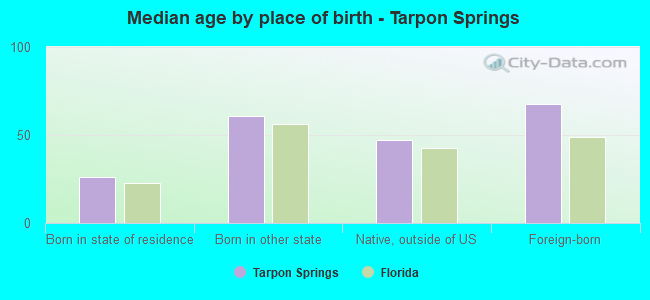
Median age by race in Tarpon Springs
57.2 Median age for White residents56.2 58.6 58.2 Median age for Black or African American residents52.1 58.9 -323,450,134.4 Median age for American Indian / Alaska Native residents-535,303,776.1 -323,863,636.0 44.7 Median age for Asian residents46.0 61.1 -556,089,743.0 Median age for Native Hawaiian / Pacific Islander residents-663,446,054.1 -373,522,458.3 36.3 Median age for Other race residents36.8 24.6 33.2 Median age for Two or more races residents39.5 29.3 58.4 Median age for White alone residents57.1 59.2 37.1 Median age for Hispanic or Latino residents44.4 35.9
Owner/renter occupied households by race in Tarpon Springs
House owners and renters - White residents 7,910 80.5% Owner occupied1,914 19.5% Renter occupiedHouse owners and renters - Black or African American residents 356 77.0% Owner occupied107 23.0% Renter occupiedHouse owners and renters - Asian residents 40 100.0% Owner occupiedHouse owners and renters - Other race residents 137 39.5% Owner occupied209 60.5% Renter occupiedHouse owners and renters - Two or more races residents 506 59.5% Owner occupied345 40.5% Renter occupiedHouse owners and renters - White alone residents 7,792 81.6% Owner occupied1,754 18.4% Renter occupiedHouse owners and renters - Hispanic or Latino residents 474 48.6% Owner occupied501 51.4% Renter occupied
Language usage in Tarpon Springs
English speakers - Total 82.7% of residents of Tarpon Springs speak English at home.
7.7% of residents speak Spanish at home 920 48.7% Speak English very well970 51.3% Speak English less than very well9.5% of residents speak other language at home 1,672 71.6% Speak English very well663 28.4% Speak English less than very well
English speakers - Born in the United States 93.3% of residents of Tarpon Springs speak English at home.
2.7% of residents speak Spanish at home 337 86.0% Speak English very well55 14.0% Speak English less than very well3.7% of residents speak other language at home 441 84.0% Speak English very well84 16.0% Speak English less than very well
English speakers - Native, born elsewhere 18.9% of residents of Tarpon Springs speak English at home.
83.4% of residents speak Spanish at home 314 40.5% Speak English very well462 59.5% Speak English less than very well4.1% of residents speak other language at home 24 63.2% Speak English very well14 36.8% Speak English less than very well
English speakers - Foreign-born 39.7% of residents of Tarpon Springs speak English at home.
17.2% of residents speak Spanish at home 139 27.3% Speak English very well371 72.7% Speak English less than very well42.1% of residents speak other language at home 699 55.9% Speak English very well552 44.1% Speak English less than very well
White (Caucasian) - Speak only English Native:
91.5% (16,122)Foreign-born:
46.9% (953)
White (Caucasian) - Speak another language Native:
7.3% (1,289)Foreign-born:
53.4% (1,086)
Black or African American - Speak only English Native:
93.5% (1,265)Foreign-born:
38.2% (39)
Black or African American - Speak another language Native:
4.9% (67)Foreign-born:
55.9% (57)
Asian - Speak only English Native:
75.6% (17)Foreign-born:
87.8% (63)
Asian - Speak another language Native:
23.3% (5)Foreign-born:
13.5% (10)
Other race - Speak only English Native:
74.7% (465)Foreign-born:
11.0% (26)
Other race - Speak another language Native:
25.7% (160)Foreign-born:
89.4% (212)
Two or more races - Speak only English Native:
65.4% (1,347)Foreign-born:
19.1% (87)
Two or more races - Speak another language Native:
34.2% (704)Foreign-born:
81.0% (368)
White alone - Speak only English Native:
94.2% (15,978)Foreign-born:
43.8% (954)
White alone - Speak another language Native:
5.2% (879)Foreign-born:
55.6% (1,210)
Hispanic or Latino - Speak only English Native:
48.0% (1,153)Foreign-born:
9.1% (49)
Hispanic or Latino - Speak another language Native:
52.1% (1,250)Foreign-born:
90.0% (490)
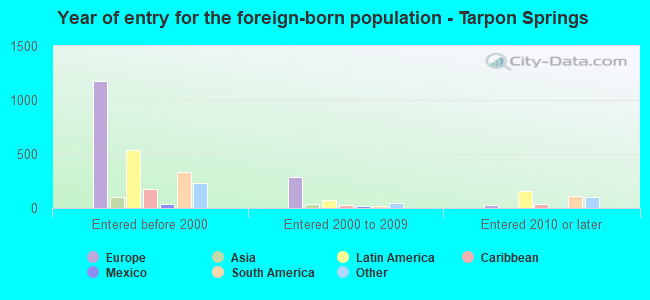
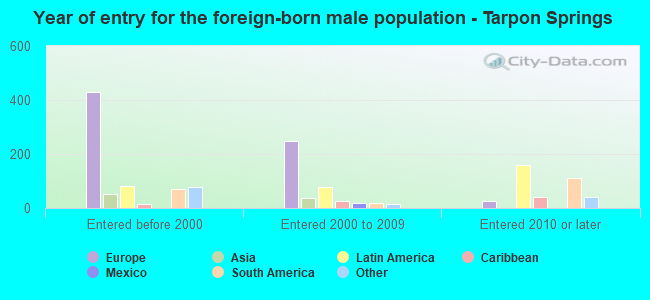
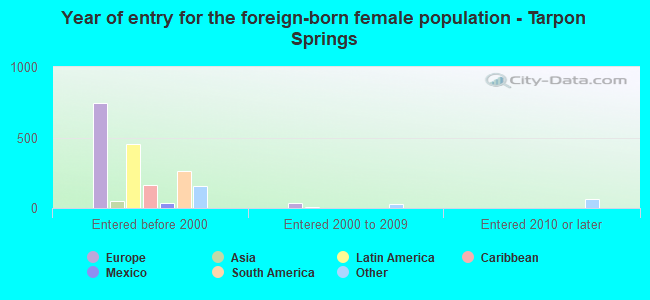
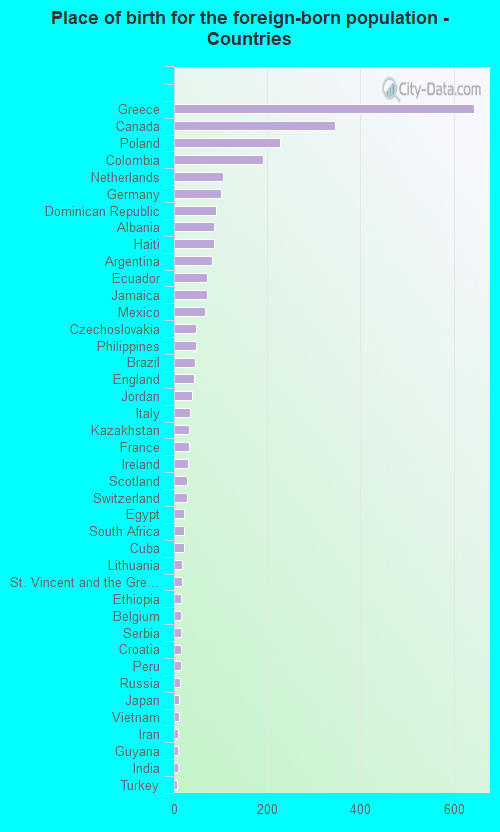
Foreign-born residents in Tarpon Springs 3,009 residents are foreign born (6.3% Europe , 2.9% Latin America , 1.3% North America ).
This city:
11.8%Florida:
21.1%
Marital status for residents in Tarpon Springs Marital status - White (Caucasian) population 15 years and over
Males 27.7% Never married55.5% Now married2.9% Separated3.7% Widowed10.2% DivorcedFemales 19.0% Never married49.3% Now married0.7% Separated15.9% Widowed15.1% DivorcedWomen who gave birth in the past 12 months Now married:
100.0% (118)Unmarried:
0.0% (0)
Women who did not give birth in the past 12 months Now married:
41.6% (1,287)Unmarried:
58.4% (1,809)
Marital status - Black or African American population 15 years and over
Males 63.6% Never married29.8% Now married0.4% Separated0.0% Widowed6.2% DivorcedFemales 22.3% Never married30.9% Now married0.0% Separated40.0% Widowed6.8% DivorcedWomen who gave birth in the past 12 months Now married:
52.3% (21)Unmarried:
47.7% (20)
Women who did not give birth in the past 12 months Now married:
0.0% (0)Unmarried:
100.0% (60)
Marital status - Asian population 15 years and over
Males 37.9% Never married62.1% Now married0.0% Separated0.0% Widowed0.0% DivorcedFemales 0.0% Never married71.1% Now married0.0% Separated28.9% Widowed0.0% DivorcedMarital status - Other race population 15 years and over
Males 32.9% Never married40.4% Now married13.7% Separated0.0% Widowed13.0% DivorcedFemales 63.8% Never married6.3% Now married0.0% Separated0.0% Widowed29.9% DivorcedWomen who gave birth in the past 12 months Now married:
0.0% (0)Unmarried:
100.0% (64)
Women who did not give birth in the past 12 months Now married:
0.0% (0)Unmarried:
100.0% (324)
Marital status - Two or more races population 15 years and over
Males 45.6% Never married31.9% Now married2.9% Separated15.8% Widowed3.8% DivorcedFemales 49.6% Never married23.5% Now married3.3% Separated10.1% Widowed13.5% DivorcedWomen who did not give birth in the past 12 months Now married:
18.3% (144)Unmarried:
81.7% (641)
Marital status - White alone, not Hispanic / Latino population 15 years and over
Males 26.6% Never married55.8% Now married2.9% Separated3.9% Widowed10.7% DivorcedFemales 18.5% Never married49.9% Now married0.4% Separated16.0% Widowed15.2% DivorcedWomen who gave birth in the past 12 months Now married:
100.0% (123)Unmarried:
0.0% (0)
Women who did not give birth in the past 12 months Now married:
43.2% (1,306)Unmarried:
56.8% (1,718)
Marital status - Hispanic or Latino population 15 years and over
Males 45.2% Never married39.1% Now married3.1% Separated8.8% Widowed3.8% DivorcedFemales 44.2% Never married27.6% Now married2.3% Separated11.7% Widowed14.2% DivorcedWomen who did not give birth in the past 12 months Now married:
14.3% (112)Unmarried:
85.7% (671)
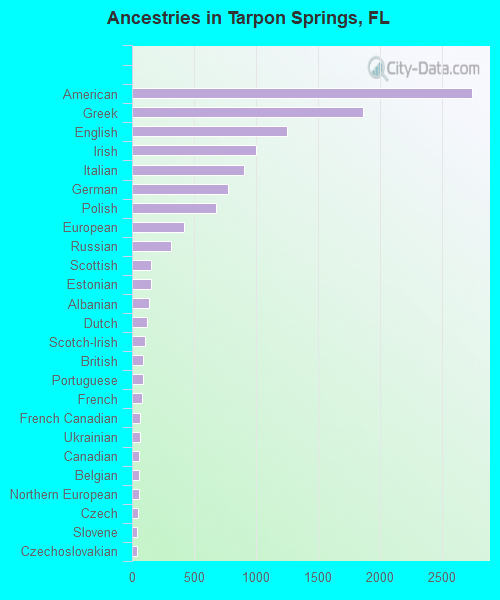
Ancestries in Tarpon Springs
2,744 19.7% American1,868 13.4% Greek1,247 9.0% English998 7.2% Irish901 6.5% Italian771 5.5% German675 4.8% Polish422 3.0% European317 2.3% Russian155 1.1% Scottish153 1.1% Estonian138 1.0% Albanian124 0.9% Dutch101 0.7% Scotch-Irish92 0.7% British85 0.6% Portuguese83 0.6% French61 0.4% French Canadian61 0.4% Ukrainian59 0.4% Canadian57 0.4% Belgian55 0.4% Northern European51 0.4% Czech43 0.3% Slovene41 0.3% Czechoslovakian39 0.3% Jamaican34 0.2% Eastern European28 0.2% Norwegian25 0.2% Swiss22 0.2% Cypriot14 0.1% Romanian14 0.1% Haitian13 0.09% Macedonian13 0.09% Croatian12 0.09% Latvian12 0.09% Swedish10 0.07% Carpatho Rusyn10 0.07% Iranian9 0.06% Pennsylvania German9 0.06% Serbian3 0.02% Brazilian
Geographical mobility in Tarpon Springs Same house 1 year ago 17,519 86.7% White (Caucasian)1,405 96.7% Black or African American97 100.0% Asian20 100.0% Native Hawaiian / Pacific Islander838 90.6% Other race2,422 90.1% Two or more races17,036 86.8% White alone, not Hispanic / Latino2,719 88.6% Hispanic or LatinoMoved within same county 838 4.1% White / Caucasian42 2.9% Black or African American33 3.6% Other race34 1.3% Two or more races758 3.9% White alone, not Hispanic / Latino107 3.5% Hispanic or LatinoMoved within same state 727 3.6% White / Caucasian26 1.8% Black or African American21 2.3% Other race123 4.6% Two or more races709 3.6% White alone, not Hispanic / Latino105 3.4% Hispanic or LatinoMoved from different state 1,117 5.5% White / Caucasian1 0.1% Black or African American91 3.4% Two or more races1,122 5.7% White alone, not Hispanic / Latino88 2.9% Hispanic or LatinoMoved from abroad 59 0.3% White59 6.4% Other race110 4.1% Two or more races66 0.3% White alone, not Hispanic / Latino131 4.3% Hispanic or Latino
Children Nativity (place of birth) in Tarpon Springs
Children under 6 years - Living with two parents Both parents native 620 100.0% NativeBoth parents foreign-born 28 100.0% NativeOne native, one foreign-born parent 27 100.0% NativeChildren under 6 years - Living with one parent Native parent 332 100.0% NativeForeign-born parent 19 100.0% NativeChildren 6 to 17 years - Living with two parents Both parents native 774 99.4% Native5 0.6% Foreign-bornBoth parents foreign-born 100 100.0% NativeOne native, one foreign-born parent 215 85.7% Native36 14.3% Foreign-bornChildren 6 to 17 years - Living with one parent Native parent 829 100.0% NativeForeign-born parent 79 50.7% Native77 49.3% Foreign-born
Grandparents responsible for own grandchildren in Tarpon Springs
Grandparents (30 to 59 years) White / Caucasian 61 36.2% Responsible for grandchildren107 63.8% Not responsible for grandchildrenBlack or African American 26 100.0% Not responsible for grandchildrenWhite alone, not Hispanic / Latino 71 39.7% Responsible for grandchildren109 60.3% Not responsible for grandchildren
Grandparents (60 years and over) White / Caucasian 199 100.0% Not responsible for grandchildrenWhite alone, not Hispanic / Latino 199 100.0% Not responsible for grandchildren