Races in Tempe, Arizona (AZ) Detailed Stats
Data:
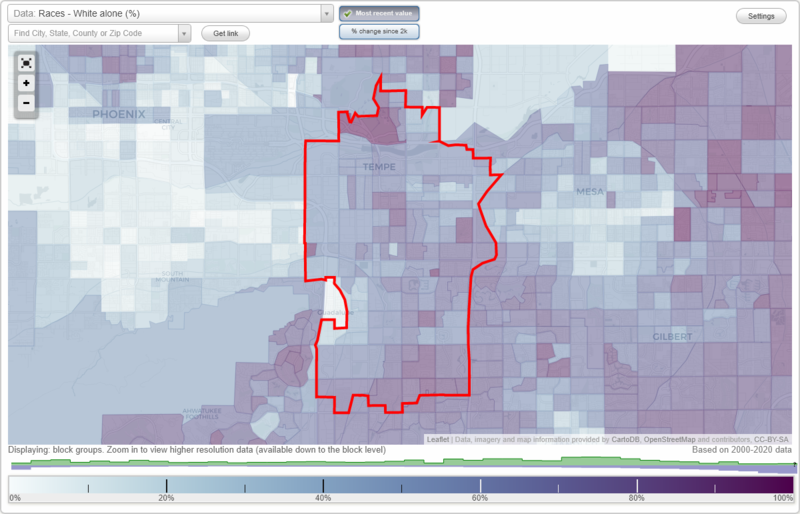
Races - White alone (%)
Races - White alone (% change since 2000)
Races - Black alone (%)
Races - Black alone (% change since 2000)
Races - American Indian alone (%)
Races - American Indian alone (% change since 2000)
Races - Asian alone (%)
Races - Asian alone (% change since 2000)
Races - Hispanic (%)
Races - Hispanic (% change since 2000)
Races - Native Hawaiian and Other Pacific Islander alone (%)
Races - Native Hawaiian and Other Pacific Islander alone (% change since 2000)
Races - Two or more races(%)
Races - Two or more races(% change since 2000)
Races - Other race alone (%)
Races - Other race alone (% change since 2000)
Racial diversity
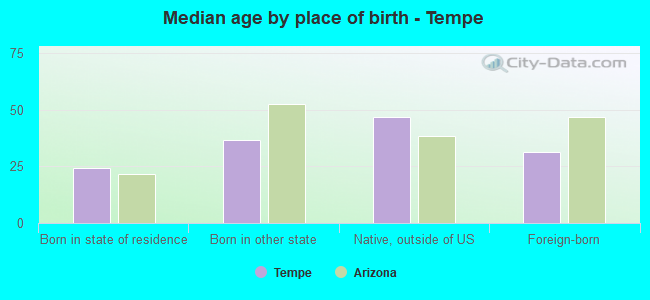
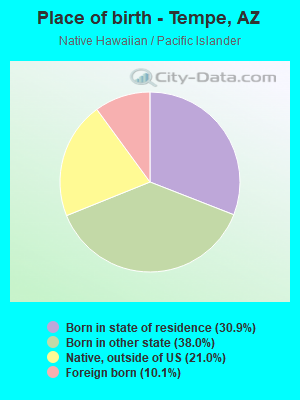
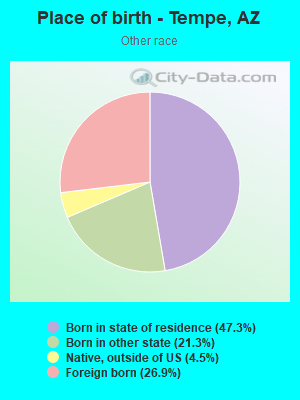
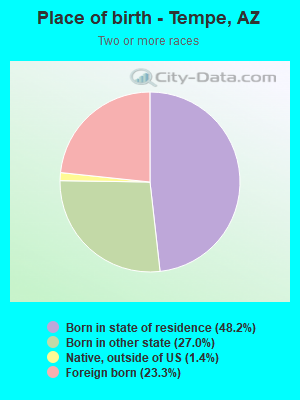
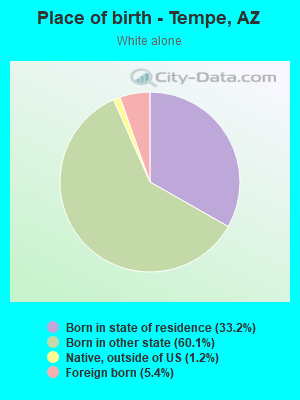
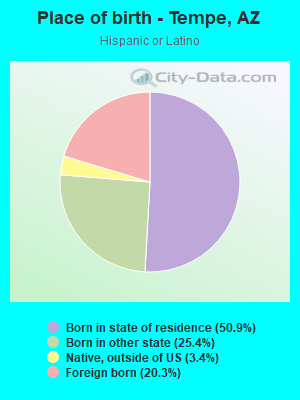
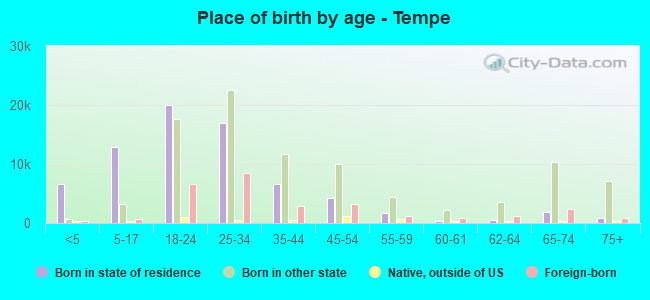
Place of birth - Born in state of residence (%)
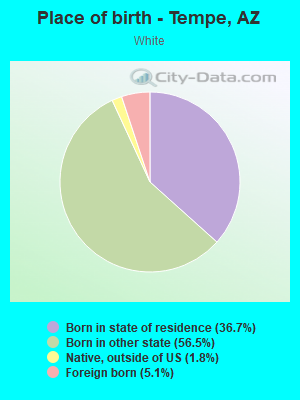
Place of birth - Born in state of residence (%) - White
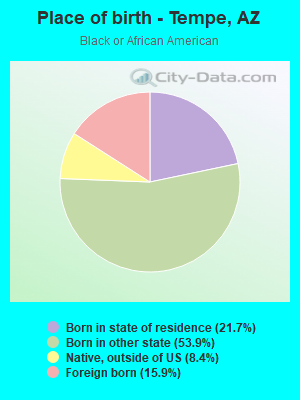
Place of birth - Born in state of residence (%) - Black or African American
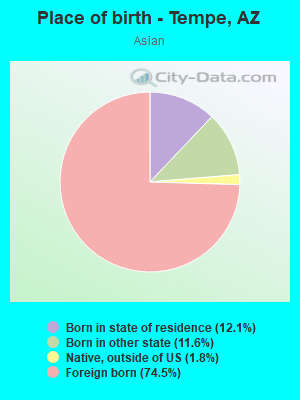
Place of birth - Born in state of residence (%) - Asian
Place of birth - Born in state of residence (%) - Hispanic or Latino
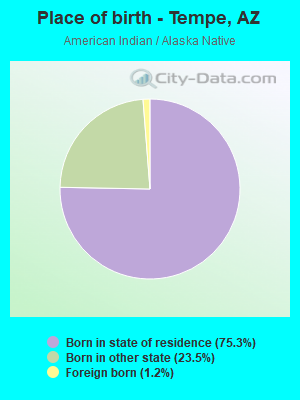
Place of birth - Born in state of residence (%) - American Indian and Alaska Native
Place of birth - Born in state of residence (%) - Multirace
Place of birth - Born in state of residence (%) - Other Race
Place of birth - Born in other state (%)
Place of birth - Born in other state (%) - White
Place of birth - Born in other state (%) - Black or African American
Place of birth - Born in other state (%) - Asian
Place of birth - Born in other state (%) - Hispanic or Latino
Place of birth - Born in other state (%) - American Indian and Alaska Native
Place of birth - Born in other state (%) - Multirace
Place of birth - Born in other state (%) - Other Race
Place of birth - Native, outside of US (%)
Place of birth - Native, outside of US (%) - White
Place of birth - Native, outside of US (%) - Black or African American
Place of birth - Native, outside of US (%) - Asian
Place of birth - Native, outside of US (%) - Hispanic or Latino
Place of birth - Native, outside of US (%) - American Indian and Alaska Native
Place of birth - Native, outside of US (%) - Multirace
Place of birth - Native, outside of US (%) - Other Race
Place of birth - Foreign born (%)
Place of birth - Foreign born (%) - White
Place of birth - Foreign born (%) - Black or African American
Place of birth - Foreign born (%) - Asian
Place of birth - Foreign born (%) - Hispanic or Latino
Place of birth - Foreign born (%) - American Indian and Alaska Native
Place of birth - Foreign born (%) - Multirace
Place of birth - Foreign born (%) - Other Race
Residents speaking English at home (%)
Residents speaking English at home - Born in the United States (%)
Residents speaking English at home - Native, born elsewhere (%)
Residents speaking English at home - Foreign born (%)
Residents speaking Spanish at home (%)
Residents speaking Spanish at home - Born in the United States (%)
Residents speaking Spanish at home - Native, born elsewhere (%)
Residents speaking Spanish at home - Foreign born (%)
Residents speaking other language at home (%)
Residents speaking other language at home - Born in the United States (%)
Residents speaking other language at home - Native, born elsewhere (%)
Residents speaking other language at home - Foreign born (%)
Marital status - Never married (%)
Marital status - Now married (%)
Marital status - Separated (%)
Marital status - Widowed (%)
Marital status - Divorced (%)
Ancestries Reported - Arab (%)
Ancestries Reported - Czech (%)
Ancestries Reported - Danish (%)
Ancestries Reported - Dutch (%)
Ancestries Reported - English (%)
Ancestries Reported - French (%)
Ancestries Reported - French Canadian (%)
Ancestries Reported - German (%)
Ancestries Reported - Greek (%)
Ancestries Reported - Hungarian (%)
Ancestries Reported - Irish (%)
Ancestries Reported - Italian (%)
Ancestries Reported - Lithuanian (%)
Ancestries Reported - Norwegian (%)
Ancestries Reported - Polish (%)
Ancestries Reported - Portuguese (%)
Ancestries Reported - Russian (%)
Ancestries Reported - Scotch-Irish (%)
Ancestries Reported - Scottish (%)
Ancestries Reported - Slovak (%)
Ancestries Reported - Subsaharan African (%)
Ancestries Reported - Swedish (%)
Ancestries Reported - Swiss (%)
Ancestries Reported - Ukrainian (%)
Ancestries Reported - United States (%)
Ancestries Reported - Welsh (%)
Ancestries Reported - West Indian (%)
Ancestries Reported - Other (%)
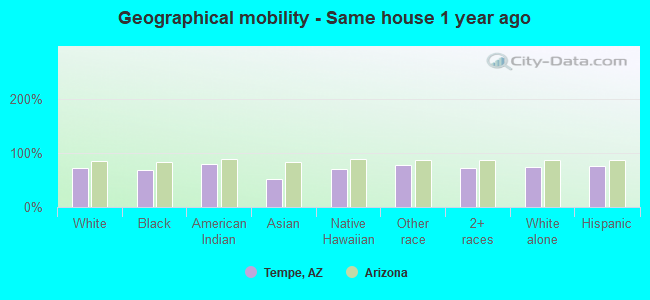
Geographical mobility - Same house 1 year ago (%)
Geographical mobility - Same house 1 year ago (%) - White
Geographical mobility - Same house 1 year ago (%) - Black or African American
Geographical mobility - Same house 1 year ago (%) - Asian
Geographical mobility - Same house 1 year ago (%) - Hispanic or Latino
Geographical mobility - Same house 1 year ago (%) - American Indian and Alaska Native
Geographical mobility - Same house 1 year ago (%) - Multirace
Geographical mobility - Same house 1 year ago (%) - Other Race
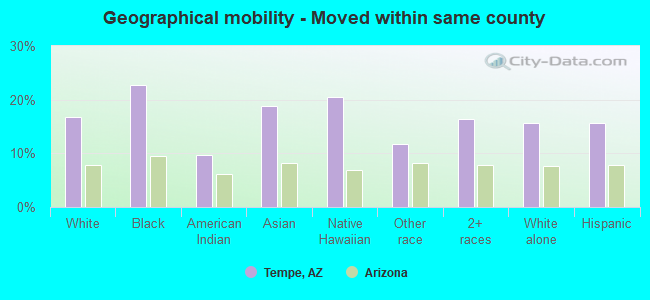
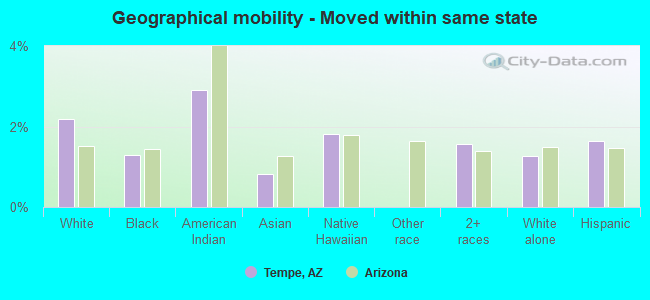
Geographical mobility - Moved within same county (%)
Geographical mobility - Moved within same county (%) - White
Geographical mobility - Moved within same county (%) - Black or African American
Geographical mobility - Moved within same county (%) - Asian
Geographical mobility - Moved within same county (%) - Hispanic or Latino
Geographical mobility - Moved within same county (%) - American Indian and Alaska Native
Geographical mobility - Moved within same county (%) - Multirace
Geographical mobility - Moved within same county (%) - Other Race
Geographical mobility - Moved from different county within same state (%)
Geographical mobility - Moved from different county within same state (%) - White
Geographical mobility - Moved from different county within same state (%) - Black or African American
Geographical mobility - Moved from different county within same state (%) - Asian
Geographical mobility - Moved from different county within same state (%) - Hispanic or Latino
Geographical mobility - Moved from different county within same state (%) - American Indian and Alaska Native
Geographical mobility - Moved from different county within same state (%) - Multirace
Geographical mobility - Moved from different county within same state (%) - Other Race
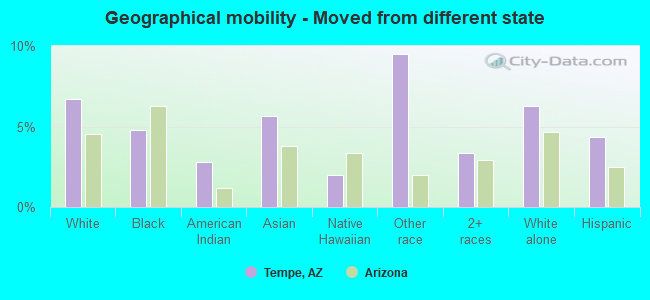
Geographical mobility - Moved from different state (%)
Geographical mobility - Moved from different state (%) - White
Geographical mobility - Moved from different state (%) - Black or African American
Geographical mobility - Moved from different state (%) - Asian
Geographical mobility - Moved from different state (%) - Hispanic or Latino
Geographical mobility - Moved from different state (%) - American Indian and Alaska Native
Geographical mobility - Moved from different state (%) - Multirace
Geographical mobility - Moved from different state (%) - Other Race
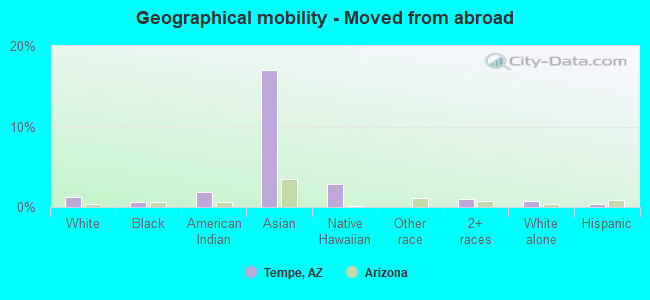
Geographical mobility - Moved from abroad (%)
Geographical mobility - Moved from abroad (%) - White
Geographical mobility - Moved from abroad (%) - Black or African American
Geographical mobility - Moved from abroad (%) - Asian
Geographical mobility - Moved from abroad (%) - Hispanic or Latino
Geographical mobility - Moved from abroad (%) - American Indian and Alaska Native
Geographical mobility - Moved from abroad (%) - Multirace
Geographical mobility - Moved from abroad (%) - Other Race
Place of birth for the foreign-born population - Ireland (%)
Place of birth for the foreign-born population - Denmark (%)
Place of birth for the foreign-born population - Norway (%)
Place of birth for the foreign-born population - Sweden (%)
Place of birth for the foreign-born population - United Kingdom (%)
Place of birth for the foreign-born population - England (%)
Place of birth for the foreign-born population - Scotland (%)
Place of birth for the foreign-born population - Other Northern Europe (%)
Place of birth for the foreign-born population - Austria (%)
Place of birth for the foreign-born population - Belgium (%)
Place of birth for the foreign-born population - France (%)
Place of birth for the foreign-born population - Germany (%)
Place of birth for the foreign-born population - Netherlands (%)
Place of birth for the foreign-born population - Switzerland (%)
Place of birth for the foreign-born population - Other Western Europe (%)
Place of birth for the foreign-born population - Greece (%)
Place of birth for the foreign-born population - Italy (%)
Place of birth for the foreign-born population - Portugal (%)
Place of birth for the foreign-born population - Spain (%)
Place of birth for the foreign-born population - Other Southern Europe (%)
Place of birth for the foreign-born population - Albania (%)
Place of birth for the foreign-born population - Belarus (%)
Place of birth for the foreign-born population - Bosnia and Herzegovina (%)
Place of birth for the foreign-born population - Bulgaria (%)
Place of birth for the foreign-born population - Croatia (%)
Place of birth for the foreign-born population - Czechoslovakia (%)
Place of birth for the foreign-born population - Hungary (%)
Place of birth for the foreign-born population - Latvia (%)
Place of birth for the foreign-born population - Lithuania (%)
Place of birth for the foreign-born population - North Macedonia (Macedonia) (%)
Place of birth for the foreign-born population - Moldova (%)
Place of birth for the foreign-born population - Poland (%)
Place of birth for the foreign-born population - Romania (%)
Place of birth for the foreign-born population - Russia (%)
Place of birth for the foreign-born population - Serbia (%)
Place of birth for the foreign-born population - Ukraine (%)
Place of birth for the foreign-born population - Other Eastern Europe (%)
Place of birth for the foreign-born population - China (%)
Place of birth for the foreign-born population - Hong Kong (%)
Place of birth for the foreign-born population - Taiwan (%)
Place of birth for the foreign-born population - Japan (%)
Place of birth for the foreign-born population - Korea (%)
Place of birth for the foreign-born population - Other Eastern Asia (%)
Place of birth for the foreign-born population - Afghanistan (%)
Place of birth for the foreign-born population - Bangladesh (%)
Place of birth for the foreign-born population - India (%)
Place of birth for the foreign-born population - Iran (%)
Place of birth for the foreign-born population - Kazakhstan (%)
Place of birth for the foreign-born population - Nepal (%)
Place of birth for the foreign-born population - Pakistan (%)
Place of birth for the foreign-born population - Sri Lanka (%)
Place of birth for the foreign-born population - Uzbekistan (%)
Place of birth for the foreign-born population - Other South Central Asia (%)
Place of birth for the foreign-born population - Burma (%)
Place of birth for the foreign-born population - Cambodia (%)
Place of birth for the foreign-born population - Indonesia (%)
Place of birth for the foreign-born population - Laos (%)
Place of birth for the foreign-born population - Malaysia (%)
Place of birth for the foreign-born population - Philippines (%)
Place of birth for the foreign-born population - Singapore (%)
Place of birth for the foreign-born population - Thailand (%)
Place of birth for the foreign-born population - Vietnam (%)
Place of birth for the foreign-born population - Other South Eastern Asia (%)
Place of birth for the foreign-born population - Armenia (%)
Place of birth for the foreign-born population - Iraq (%)
Place of birth for the foreign-born population - Israel (%)
Place of birth for the foreign-born population - Jordan (%)
Place of birth for the foreign-born population - Kuwait (%)
Place of birth for the foreign-born population - Lebanon (%)
Place of birth for the foreign-born population - Saudi Arabia (%)
Place of birth for the foreign-born population - Syria (%)
Place of birth for the foreign-born population - Turkey (%)
Place of birth for the foreign-born population - Yemen (%)
Place of birth for the foreign-born population - Other Western Asia (%)
Place of birth for the foreign-born population - Eritrea (%)
Place of birth for the foreign-born population - Ethiopia (%)
Place of birth for the foreign-born population - Kenya (%)
Place of birth for the foreign-born population - Somalia (%)
Place of birth for the foreign-born population - Uganda (%)
Place of birth for the foreign-born population - Zimbabwe (%)
Place of birth for the foreign-born population - Other Eastern Africa (%)
Place of birth for the foreign-born population - Cameroon (%)
Place of birth for the foreign-born population - Congo (%)
Place of birth for the foreign-born population - Democratic Republic of Congo (Zaire) (%)
Place of birth for the foreign-born population - Other Middle Africa (%)
Place of birth for the foreign-born population - Egypt (%)
Place of birth for the foreign-born population - Morocco (%)
Place of birth for the foreign-born population - Sudan (%)
Place of birth for the foreign-born population - Other Northern Africa (%)
Place of birth for the foreign-born population - South Africa (%)
Place of birth for the foreign-born population - Other Southern Africa (%)
Place of birth for the foreign-born population - Cabo Verde (%)
Place of birth for the foreign-born population - Ghana (%)
Place of birth for the foreign-born population - Liberia (%)
Place of birth for the foreign-born population - Nigeria (%)
Place of birth for the foreign-born population - Senegal (%)
Place of birth for the foreign-born population - Sierra Leone (%)
Place of birth for the foreign-born population - Other Western Africa (%)
Place of birth for the foreign-born population - Australia (%)
Place of birth for the foreign-born population - New Zealand (%)
Place of birth for the foreign-born population - Fiji (%)
Place of birth for the foreign-born population - Micronesia (%)
Place of birth for the foreign-born population - Bahamas (%)
Place of birth for the foreign-born population - Barbados (%)
Place of birth for the foreign-born population - Cuba (%)
Place of birth for the foreign-born population - Dominica (%)
Place of birth for the foreign-born population - Dominican Republic (%)
Place of birth for the foreign-born population - Grenada (%)
Place of birth for the foreign-born population - Haiti (%)
Place of birth for the foreign-born population - Jamaica (%)
Place of birth for the foreign-born population - St. Vincent and the Grenadines (%)
Place of birth for the foreign-born population - Trinidad and Tobago (%)
Place of birth for the foreign-born population - West Indies (%)
Place of birth for the foreign-born population - Other Caribbean (%)
Place of birth for the foreign-born population - Belize (%)
Place of birth for the foreign-born population - Costa Rica (%)
Place of birth for the foreign-born population - El Salvador (%)
Place of birth for the foreign-born population - Guatemala (%)
Place of birth for the foreign-born population - Honduras (%)
Place of birth for the foreign-born population - Mexico (%)
Place of birth for the foreign-born population - Nicaragua (%)
Place of birth for the foreign-born population - Panama (%)
Place of birth for the foreign-born population - Other Central America (%)
Place of birth for the foreign-born population - Argentina (%)
Place of birth for the foreign-born population - Bolivia (%)
Place of birth for the foreign-born population - Brazil (%)
Place of birth for the foreign-born population - Chile (%)
Place of birth for the foreign-born population - Colombia (%)
Place of birth for the foreign-born population - Ecuador (%)
Place of birth for the foreign-born population - Guyana (%)
Place of birth for the foreign-born population - Peru (%)
Place of birth for the foreign-born population - Uruguay (%)
Place of birth for the foreign-born population - Venezuela (%)
Place of birth for the foreign-born population - Other South America (%)
Place of birth for the foreign-born population - Canada (%)
Place of birth for the foreign-born population - Other Northern America (%)
Place of birth for the foreign-born population - Other (%)
Latest news about races in Tempe, AZ collected exclusively by city-data.com from local newspapers, TV, and radio stations
According to 2022 data, the most numerous races in Tempe, AZ are White alone (113,473 residents), Hispanic (42,445 residents), and Black alone (14,727 residents). 75.0% of Tempe residents speak English at home. 15.6% of Tempe, AZ residents are foreign-born (8.5% born in Asia, 4.9% born in Latin America), which is 16.7% greater than the foreign-born rate of 13.0% across the entire state of Arizona.
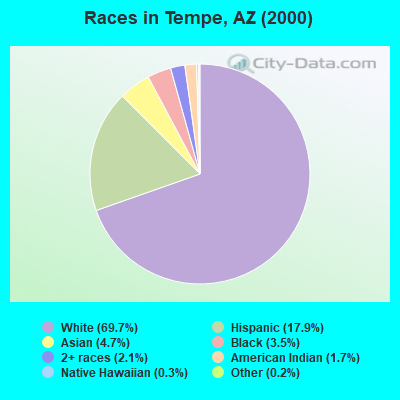
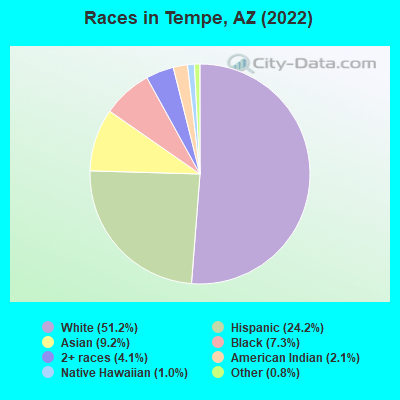
Race distribution in Tempe
2000 2022
110,517 69.7% White alone 28,473 17.9% Hispanic 7,405 4.7% Asian alone 5,546 3.5% Black alone 3,337 2.1% Two or more races 2,678 1.7% American Indian alone 425 0.3% Native Hawaiian and Other 244 0.2% Other race alone
113,473 57.0% White alone 42,445 21.3% Hispanic 18,196 9.1% Asian alone 14,727 7.4% Black alone 7,524 3.8% Two or more races 2,469 1.2% American Indian alone 375 0.2% Other race alone 202 0.1% Native Hawaiian and Other
2000 2022
3,274,258 63.8% White alone 1,295,617 25.3% Hispanic 233,370 4.5% American Indian alone 149,941 2.9% Black alone 89,315 1.7% Asian alone 76,372 1.5% Two or more races 6,120 0.1% Other race alone 5,639 0.1% Native Hawaiian and Other
3,814,587 51.8% White alone 2,388,520 32.5% Hispanic 322,459 4.4% Black alone 284,994 3.9% Two or more races 257,020 3.5% Asian alone 241,688 3.3% American Indian alone 36,042 0.5% Other race alone 13,887 0.2% Native Hawaiian and Other
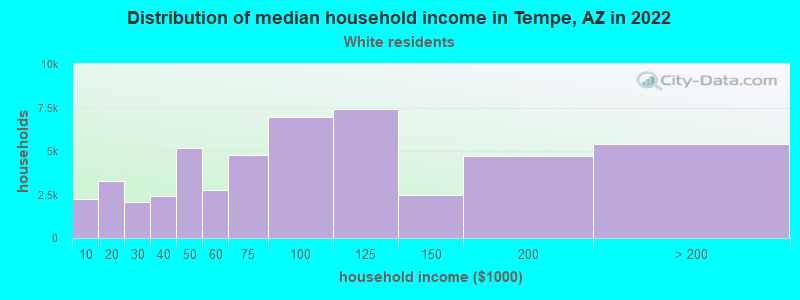
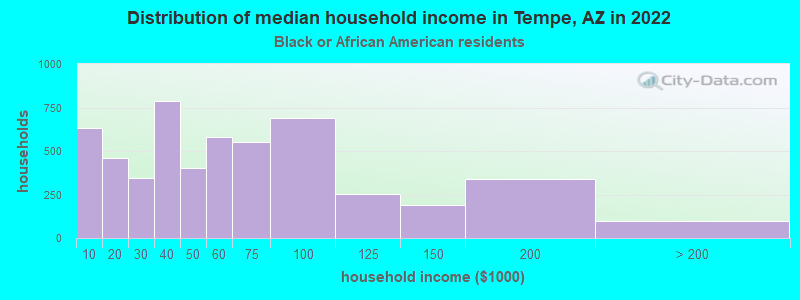
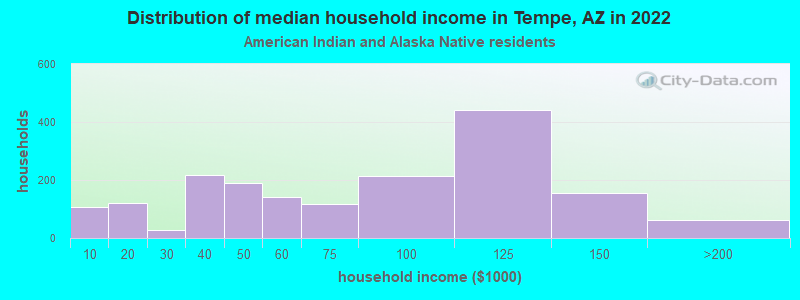
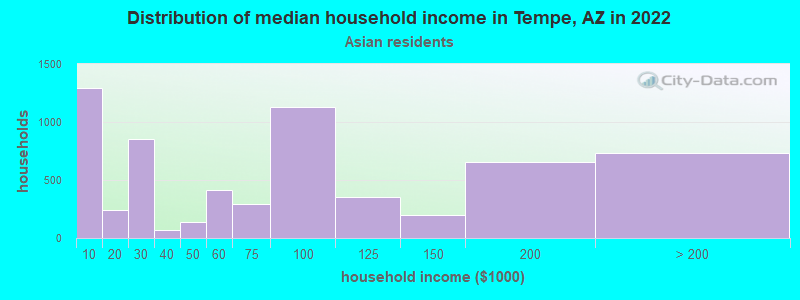
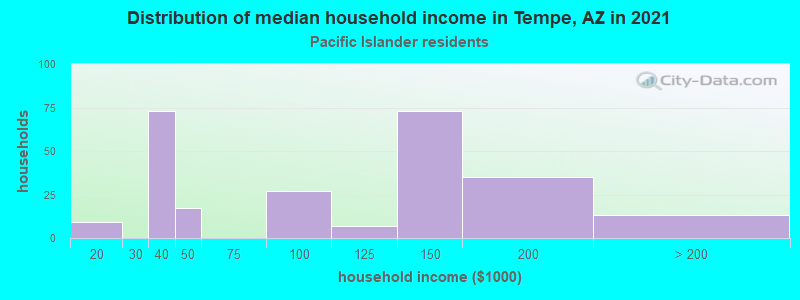
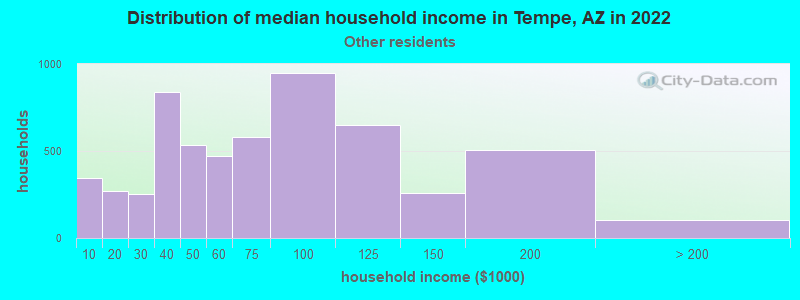
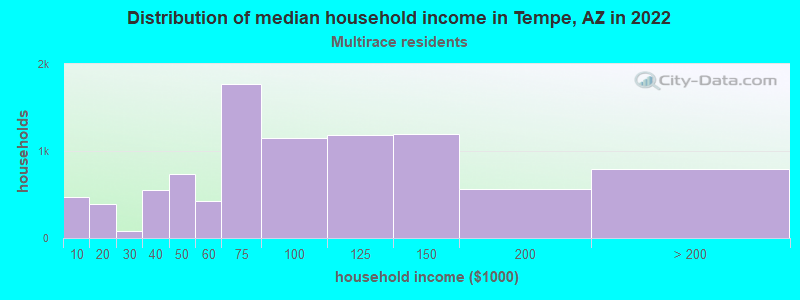
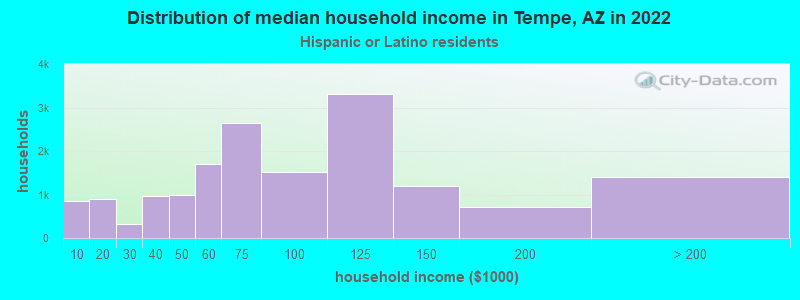
Income and house value in Tempe Median household income in 2022 $91,265 White non-Hispanic householders$68,774 Black householders$85,413 American Indian and Alaska Native householders$53,303 Asian householders$60,522 Native Hawaiian and other Pacific Islander householders$60,532 Some other race householders$49,526 Two or more races householders$79,362 Hispanic or Latino race householdersMedian 2022 house value $494,111 White Non-Hispanic householders$483,801 Black or African American householders$391,386 American Indian or Alaska Native householders $554,126 Asian householders$447,719 Native Hawaiian and other Pacific Islander householders$391,386 Some other race householders$424,523 Two or more races householders$416,791 Hispanic or Latino householders
Median age by race in Tempe
33.3 Median age for White residents33.7 32.9 29.6 Median age for Black or African American residents28.9 31.5 31.4 Median age for American Indian / Alaska Native residents44.6 22.8 26.3 Median age for Asian residents26.7 26.3 44.7 Median age for Native Hawaiian / Pacific Islander residents29.7 Median age for Other race residents30.0 30.3 26.8 Median age for Two or more races residents31.2 23.8 32.8 Median age for White alone residents33.5 32.0 30.3 Median age for Hispanic or Latino residents30.6 30.0
Owner/renter occupied households by race in Tempe
House owners and renters - White residents 27,346 49.5% Owner occupied27,924 50.5% Renter occupiedHouse owners and renters - Black or African American residents 599 10.2% Owner occupied5,257 89.8% Renter occupiedHouse owners and renters - American Indian / Alaska Native residents 389 30.8% Owner occupied873 69.2% Renter occupiedHouse owners and renters - Asian residents 1,192 17.6% Owner occupied5,592 82.4% Renter occupiedHouse owners and renters - Native Hawaiian / Pacific Islander residents 62 22.2% Owner occupied218 77.8% Renter occupiedHouse owners and renters - Other race residents 948 32.3% Owner occupied1,983 67.7% Renter occupiedHouse owners and renters - Two or more races residents 2,761 45.1% Owner occupied3,363 54.9% Renter occupiedHouse owners and renters - White alone residents 24,761 50.6% Owner occupied24,171 49.4% Renter occupiedHouse owners and renters - Hispanic or Latino residents 5,711 37.1% Owner occupied9,672 62.9% Renter occupied
Language usage in Tempe
English speakers - Total 75.0% of residents of Tempe speak English at home.
12.9% of residents speak Spanish at home 17,382 73.8% Speak English very well6,176 26.2% Speak English less than very well12.0% of residents speak other language at home 15,566 70.9% Speak English very well6,378 29.1% Speak English less than very well
English speakers - Born in the United States 91.2% of residents of Tempe speak English at home.
5.8% of residents speak Spanish at home 4,549 89.9% Speak English very well513 10.1% Speak English less than very well3.0% of residents speak other language at home 2,417 92.4% Speak English very well198 7.6% Speak English less than very well
English speakers - Native, born elsewhere 57.7% of residents of Tempe speak English at home.
23.7% of residents speak Spanish at home 763 85.9% Speak English very well125 14.1% Speak English less than very well17.6% of residents speak other language at home 604 91.5% Speak English very well56 8.5% Speak English less than very well
English speakers - Foreign-born 16.9% of residents of Tempe speak English at home.
27.5% of residents speak Spanish at home 3,885 48.0% Speak English very well4,204 52.0% Speak English less than very well56.2% of residents speak other language at home 10,755 64.9% Speak English very well5,806 35.1% Speak English less than very well
White (Caucasian) - Speak only English Native:
93.7% (111,167)Foreign-born:
37.3% (2,416)
White (Caucasian) - Speak another language Native:
7.4% (8,823)Foreign-born:
66.4% (4,294)
Black or African American - Speak only English Native:
97.0% (11,937)Foreign-born:
32.8% (574)
Black or African American - Speak another language Native:
3.2% (391)Foreign-born:
64.8% (1,134)
American Indian / Alaska Native - Speak only English Native:
62.8% (2,889)Foreign-born:
17.9% (11)
American Indian / Alaska Native - Speak another language Native:
37.8% (1,741)Foreign-born:
79.5% (47)
Asian - Speak only English Native:
62.6% (1,937)Foreign-born:
7.4% (1,081)
Asian - Speak another language Native:
37.2% (1,150)Foreign-born:
91.3% (13,278)
Native Hawaiian / Pacific Islander - Speak only English Native:
79.6% (366)Foreign-born:
12.1% (16)
Native Hawaiian / Pacific Islander - Speak another language Native:
20.5% (94)Foreign-born:
86.1% (111)
Other race - Speak another language Native:
50.7% (2,738)Foreign-born:
97.1% (2,728)
Two or more races - Speak only English Native:
69.0% (15,774)Foreign-born:
3.7% (315)
Two or more races - Speak another language Native:
21.7% (4,968)Foreign-born:
100.0% (8,604)
White alone - Speak only English Native:
96.6% (101,227)Foreign-born:
41.5% (2,355)
White alone - Speak another language Native:
3.4% (3,523)Foreign-born:
58.4% (3,313)
Hispanic or Latino - Speak only English Native:
61.4% (20,297)Foreign-born:
4.5% (291)
Hispanic or Latino - Speak another language Native:
39.6% (13,087)Foreign-born:
95.0% (6,089)
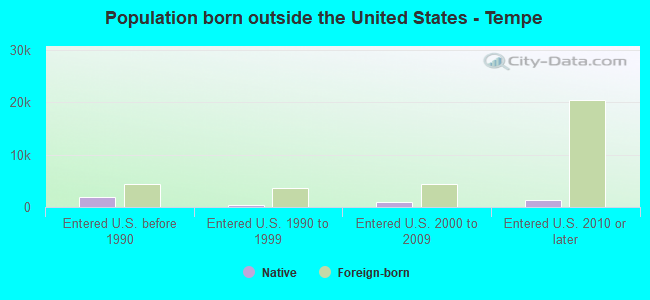
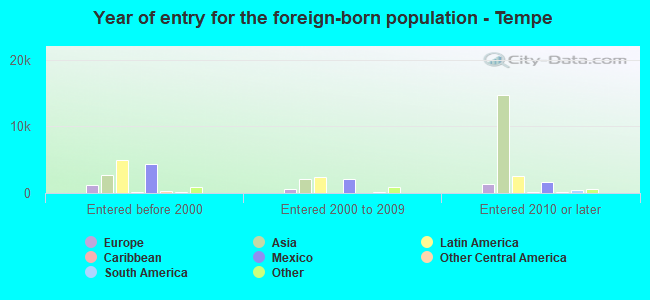
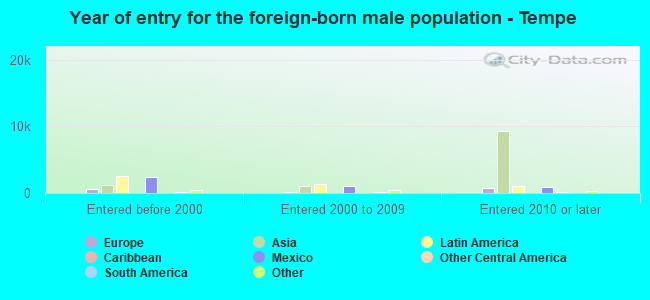
Foreign-born residents in Tempe 30,847 residents are foreign born (8.5% Asia , 4.9% Latin America ).
This city:
15.6%Arizona:
100.0%
Marital status for residents in Tempe Marital status - White (Caucasian) population 15 years and over
Males 54.5% Never married32.9% Now married2.3% Separated2.3% Widowed8.0% DivorcedFemales 49.9% Never married31.5% Now married2.3% Separated3.4% Widowed12.9% DivorcedWomen who gave birth in the past 12 months Now married:
86.7% (534)Unmarried:
13.3% (82)
Women who did not give birth in the past 12 months Now married:
24.4% (9,389)Unmarried:
75.6% (29,140)
Marital status - Black or African American population 15 years and over
Males 80.1% Never married12.2% Now married2.0% Separated1.9% Widowed3.8% DivorcedFemales 55.8% Never married18.6% Now married0.0% Separated9.9% Widowed15.8% DivorcedWomen who gave birth in the past 12 months Now married:
81.0% (53)Unmarried:
19.0% (12)
Women who did not give birth in the past 12 months Now married:
12.6% (605)Unmarried:
87.4% (4,186)
Marital status - American Indian / Alaska Native population 15 years and over
Males 68.3% Never married24.1% Now married1.4% Separated0.0% Widowed6.2% DivorcedFemales 57.5% Never married29.3% Now married1.7% Separated3.2% Widowed8.4% DivorcedWomen who gave birth in the past 12 months Now married:
30.8% (12)Unmarried:
69.2% (27)
Women who did not give birth in the past 12 months Now married:
25.5% (378)Unmarried:
74.5% (1,107)
Marital status - Asian population 15 years and over
Males 77.0% Never married22.5% Now married0.0% Separated0.0% Widowed0.5% DivorcedFemales 47.9% Never married38.7% Now married5.3% Separated3.3% Widowed4.9% DivorcedWomen who gave birth in the past 12 months Now married:
73.9% (214)Unmarried:
26.1% (76)
Women who did not give birth in the past 12 months Now married:
42.9% (2,203)Unmarried:
57.1% (2,929)
Marital status - Native Hawaiian / Pacific Islander population 15 years and over
Males 56.7% Never married43.3% Now married0.0% Separated0.0% Widowed0.0% DivorcedFemales 35.5% Never married51.5% Now married0.0% Separated2.0% Widowed10.9% DivorcedWomen who did not give birth in the past 12 months Now married:
50.0% (118)Unmarried:
50.0% (118)
Marital status - Other race population 15 years and over
Males 54.8% Never married33.9% Now married2.2% Separated1.1% Widowed8.1% DivorcedFemales 46.5% Never married33.1% Now married3.6% Separated4.8% Widowed12.0% DivorcedWomen who gave birth in the past 12 months Now married:
76.6% (441)Unmarried:
23.4% (134)
Women who did not give birth in the past 12 months Now married:
41.1% (820)Unmarried:
58.9% (1,178)
Marital status - Two or more races population 15 years and over
Males 75.1% Never married14.1% Now married1.4% Separated1.4% Widowed8.0% DivorcedFemales 70.8% Never married19.3% Now married1.8% Separated1.3% Widowed6.8% DivorcedWomen who gave birth in the past 12 months Now married:
13.3% (129)Unmarried:
86.7% (841)
Women who did not give birth in the past 12 months Now married:
18.7% (1,613)Unmarried:
81.3% (7,026)
Marital status - White alone, not Hispanic / Latino population 15 years and over
Males 54.3% Never married33.0% Now married1.7% Separated2.4% Widowed8.5% DivorcedFemales 49.2% Never married31.7% Now married2.6% Separated3.2% Widowed13.2% DivorcedWomen who gave birth in the past 12 months Now married:
100.0% (508)Unmarried:
0.0% (0)
Women who did not give birth in the past 12 months Now married:
25.2% (9,098)Unmarried:
74.8% (27,069)
Marital status - Hispanic or Latino population 15 years and over
Males 55.3% Never married33.8% Now married3.5% Separated1.3% Widowed6.1% DivorcedFemales 53.7% Never married33.2% Now married0.6% Separated3.1% Widowed9.5% DivorcedWomen who gave birth in the past 12 months Now married:
62.6% (503)Unmarried:
37.4% (300)
Women who did not give birth in the past 12 months Now married:
22.8% (2,612)Unmarried:
77.2% (8,831)
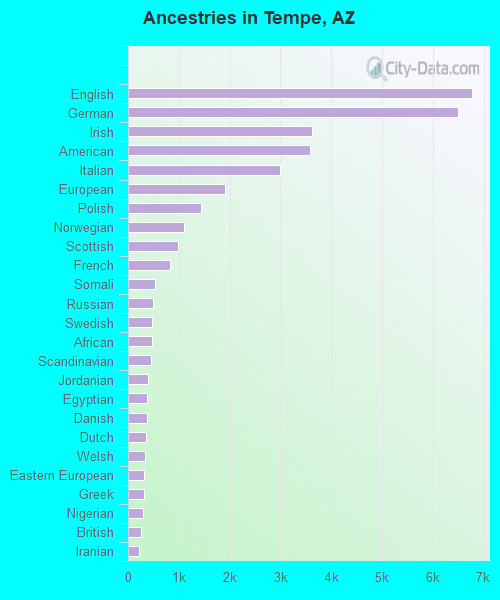
Ancestries in Tempe
9,418 9.1% English7,882 7.6% German3,458 3.3% Italian3,419 3.3% Irish3,372 3.3% European3,029 2.9% American1,484 1.4% Polish1,007 1.0% Norwegian863 0.8% French749 0.7% Scottish704 0.7% Russian538 0.5% Eastern European490 0.5% British482 0.5% African464 0.4% Nigerian444 0.4% Somali436 0.4% Swedish424 0.4% Dutch399 0.4% Scotch-Irish362 0.3% Jordanian355 0.3% Northern European319 0.3% Iranian315 0.3% Welsh285 0.3% Canadian248 0.2% Lebanese239 0.2% Hungarian220 0.2% Turkish214 0.2% Greek195 0.2% Scandinavian188 0.2% Finnish178 0.2% Yugoslavian166 0.2% French Canadian163 0.2% Sudanese160 0.2% Egyptian154 0.1% Danish153 0.1% Ukrainian151 0.1% Bahamian137 0.1% Czech118 0.1% Brazilian99 0.10% Croatian99 0.10% Slovak97 0.09% Portuguese97 0.09% Ethiopian96 0.09% Haitian90 0.09% Austrian75 0.07% Serbian67 0.06% Belgian65 0.06% Arab63 0.06% Czechoslovakian62 0.06% Swiss60 0.06% Romanian58 0.06% U.S. Virgin Islander56 0.05% Afghan49 0.05% Jamaican40 0.04% Israeli40 0.04% Basque39 0.04% West Indian36 0.03% South African33 0.03% Macedonian33 0.03% Icelander32 0.03% Bulgarian28 0.03% Palestinian28 0.03% Slavic28 0.03% Celtic26 0.03% Albanian26 0.03% Belizean25 0.02% Armenian25 0.02% Ghanaian24 0.02% Slovene18 0.02% Lithuanian14 0.01% Trinidadian and Tobagonian9 0.01% Syrian
Geographical mobility in Tempe Same house 1 year ago 90,559 71.5% White (Caucasian)10,316 67.9% Black or African American3,790 80.1% American Indian / Alaska Native9,599 51.8% Asian551 70.7% Native Hawaiian / Pacific Islander6,821 77.2% Other race21,895 72.4% Two or more races77,848 74.6% White alone, not Hispanic / Latino32,566 76.4% Hispanic or LatinoMoved within same county 21,301 16.8% White / Caucasian3,447 22.7% Black or African American459 9.7% American Indian / Alaska Native3,487 18.8% Asian159 20.4% Native Hawaiian / Pacific Islander1,033 11.7% Other race4,964 16.4% Two or more races16,425 15.7% White alone, not Hispanic / Latino6,652 15.6% Hispanic or LatinoMoved within same state 2,765 2.2% White / Caucasian195 1.3% Black or African American138 2.9% American Indian / Alaska Native152 0.8% Asian14 1.8% Native Hawaiian / Pacific Islander473 1.6% Two or more races1,311 1.3% White alone, not Hispanic / Latino699 1.6% Hispanic or LatinoMoved from different state 8,482 6.7% White / Caucasian728 4.8% Black or African American131 2.8% American Indian / Alaska Native1,050 5.7% Asian15 2.0% Native Hawaiian / Pacific Islander841 9.5% Other race1,006 3.3% Two or more races6,525 6.3% White alone, not Hispanic / Latino1,856 4.4% Hispanic or LatinoMoved from abroad 1,543 1.2% White93 0.6% Black or African American88 1.9% American Indian / Alaska Native3,155 17.0% Asian23 2.9% Native Hawaiian / Pacific Islander319 1.1% Two or more races743 0.7% White alone, not Hispanic / Latino178 0.4% Hispanic or Latino
Children Nativity (place of birth) in Tempe
Children under 6 years - Living with two parents Both parents native 4,760 100.0% NativeBoth parents foreign-born 607 62.8% Native360 37.2% Foreign-bornOne native, one foreign-born parent 1,062 100.0% NativeChildren under 6 years - Living with one parent Native parent 1,693 100.0% NativeForeign-born parent 464 100.0% NativeChildren 6 to 17 years - Living with two parents Both parents native 5,655 100.0% NativeBoth parents foreign-born 728 59.6% Native494 40.4% Foreign-bornOne native, one foreign-born parent 1,195 100.0% NativeChildren 6 to 17 years - Living with one parent Native parent 5,547 100.0% NativeForeign-born parent 216 54.9% Native178 45.1% Foreign-born
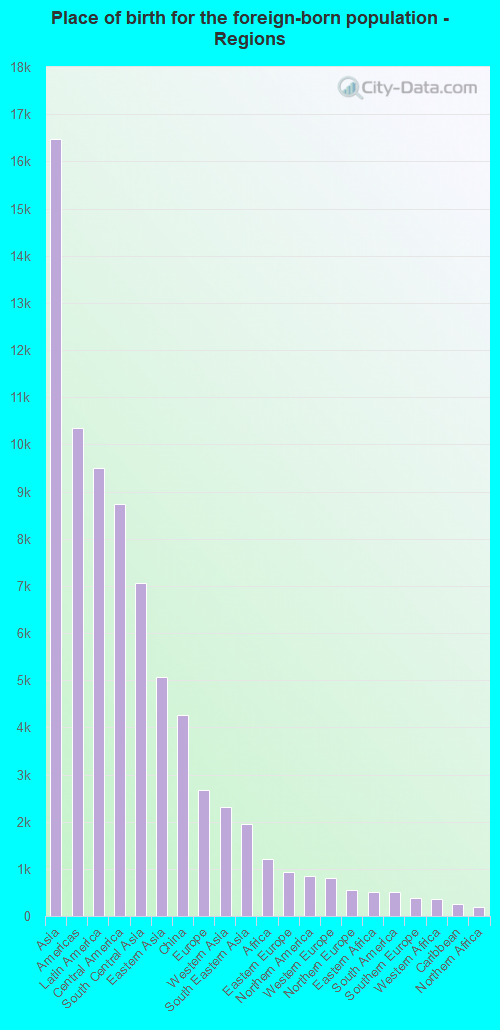
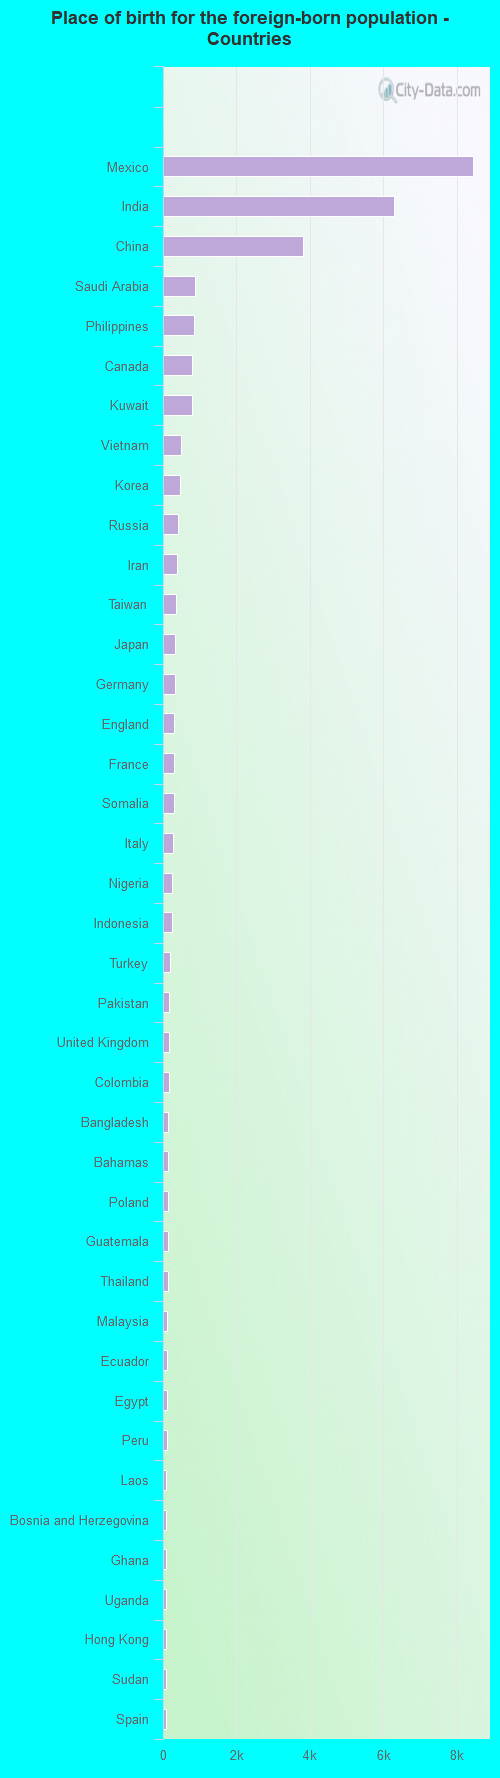
Place of birth for residents in Tempe 16,476 Asia10,344 Americas9,497 Latin America8,731 Central America7,065 South Central Asia5,072 Eastern Asia4,267 China2,667 Europe2,319 Western Asia1,959 South Eastern Asia1,216 Africa928 Eastern Europe847 Northern America810 Western Europe556 Northern Europe504 Eastern Africa502 South America372 Southern Europe366 Western Africa262 Caribbean191 Northern Africa141 Oceania82 Middle Africa42 Southern Africa33 Australia and New Zealand Subregion8,450 Mexico6,289 India3,820 China882 Saudi Arabia842 Philippines789 Canada788 Kuwait494 Vietnam468 Korea395 Russia379 Iran364 Taiwan336 Japan334 Germany298 England293 France287 Somalia274 Italy250 Nigeria239 Indonesia196 Turkey171 Pakistan167 United Kingdom151 Colombia148 Bangladesh142 Bahamas131 Poland131 Guatemala127 Thailand120 Malaysia114 Ecuador109 Egypt103 Peru87 Laos85 Bosnia and Herzegovina84 Ghana84 Uganda82 Hong Kong82 Sudan79 Spain76 Jordan75 Brazil74 Ukraine62 Yemen61 Honduras60 Lebanon57 Micronesia54 Switzerland52 Cameroon49 Netherlands49 Belgium47 Cambodia46 Sri Lanka44 Bulgaria43 Dominican Republic42 South Africa39 Serbia38 El Salvador35 Chile34 Syria33 Cuba31 Panama30 Afghanistan29 Austria29 Czechoslovakia29 Kenya28 Haiti25 Australia24 Scotland23 Romania20 Congo19 Norway18 Portugal18 Nicaragua15 Hungary15 Venezuela13 Trinidad and Tobago11 Sweden10 North Macedonia (Macedonia)9 Croatia8 Iraq8 New Zealand7 Bolivia4 Denmark
Grandparents responsible for own grandchildren in Tempe
Grandparents (30 to 59 years) White / Caucasian 373 56.0% Responsible for grandchildren293 44.0% Not responsible for grandchildrenBlack or African American 61 68.2% Responsible for grandchildren28 31.8% Not responsible for grandchildrenAmerican Indian / Alaska Native 56 100.0% Not responsible for grandchildrenAsian 11 9.4% Responsible for grandchildren106 90.6% Not responsible for grandchildrenOther race 29 19.4% Responsible for grandchildren120 80.6% Not responsible for grandchildrenTwo or more races 37 100.0% Responsible for grandchildrenWhite alone, not Hispanic / Latino 143 45.5% Responsible for grandchildren171 54.5% Not responsible for grandchildrenHispanic or Latino 107 25.3% Responsible for grandchildren317 74.7% Not responsible for grandchildrenGrandparents (60 years and over) White / Caucasian 140 27.9% Responsible for grandchildren362 72.1% Not responsible for grandchildrenBlack or African American 71 80.2% Responsible for grandchildren17 19.8% Not responsible for grandchildrenAmerican Indian / Alaska Native 63 100.0% Not responsible for grandchildrenAsian 101 100.0% Not responsible for grandchildrenOther race 34 46.2% Responsible for grandchildren40 53.8% Not responsible for grandchildrenTwo or more races 33 36.6% Responsible for grandchildren57 63.4% Not responsible for grandchildrenWhite alone, not Hispanic / Latino 179 31.1% Responsible for grandchildren398 68.9% Not responsible for grandchildrenHispanic or Latino 118 46.3% Responsible for grandchildren137 53.7% Not responsible for grandchildren