Races in Three Rivers, Massachusetts (MA) Detailed Stats
Ancestries, Foreign-born residents, place of birth

Recent posts about races in Three Rivers, Massachusetts on our local forum with over 2,400,000 registered users:
 | Thoughts on these 10 towns (92 replies) |
| Moving from Florida to Massachusetts (58 replies) |
2.7% of Three Rivers, MA residents are foreign-born (2.3% born in Europe, 0.4% born in North America), which is 561.3% less than the foreign-born rate of 18.0% across the entire state of Massachusetts.
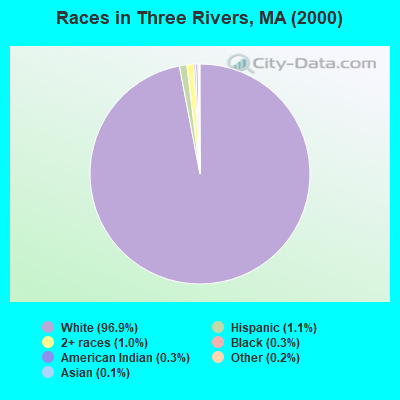
Race distribution in Three Rivers

- 2,84996.9%White alone
- 311.1%Hispanic
- 301.0%Two or more races
- 100.3%Black alone
- 90.3%American Indian alone
- 60.2%Other race alone
- 40.1%Asian alone
2000
2022
-
- 5,198,35981.9%White alone
- 428,7296.8%Hispanic
- 318,3295.0%Black alone
- 236,7863.7%Asian alone
- 110,3381.7%Two or more races
- 43,5860.7%Other race alone
- 11,2640.2%American Indian alone
- 1,7060.03%Native Hawaiian and Other
Pacific Islander alone

-
- 4,676,62767.0%White alone
- 911,03813.0%Hispanic
- 501,4637.2%Asian alone
- 459,7406.6%Black alone
- 341,8894.9%Two or more races
- 84,4031.2%Other race alone
- 5,8380.08%American Indian alone
- 9760.01%Native Hawaiian and Other
Pacific Islander alone

Income and house value in Three Rivers
- Median household income in 2022
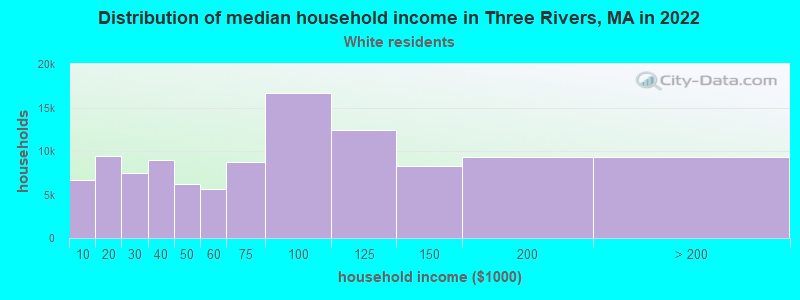
- $67,168White non-Hispanic householders
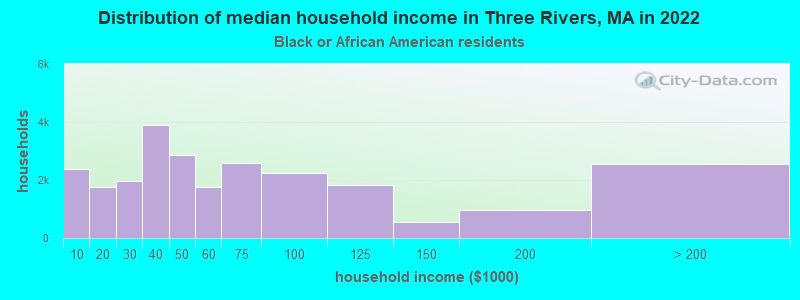
- $81,568Black householders
- $41,590Some other race householders
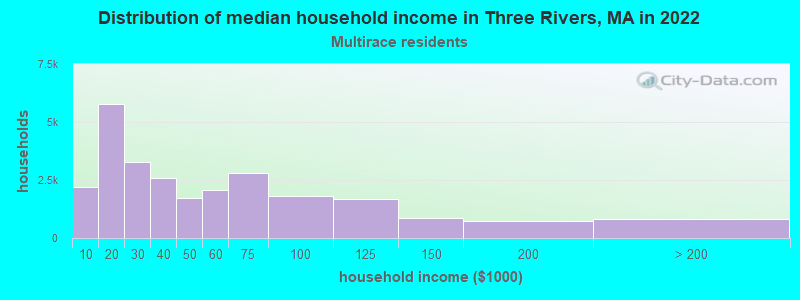
- $36,785Two or more races householders
- $30,305Hispanic or Latino race householders
- Median 2022 house value
- $280,859White Non-Hispanic householders
- $558,245Black or African American householders
- $341,149Two or more races householders
Household income for White non-Hispanic householders
Household income for Black householders
Household income for Two or more races householders
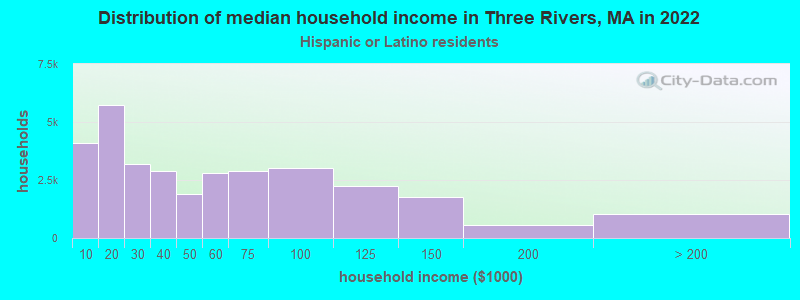
Household income for Hispanic or Latino race householders
Foreign-born residents in Three Rivers
80 residents are foreign born (2.3% Europe, 0.4% North America).
| This city: | 2.7% |
| Massachusetts: | 12.2% |
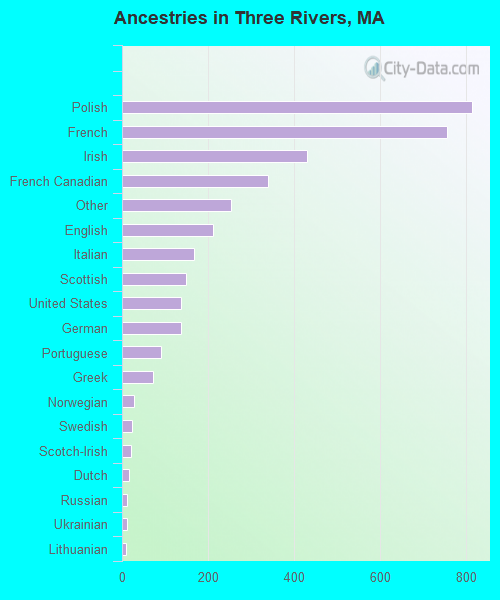
Ancestries in Three Rivers

- 81422.1%Polish
- 75720.5%French
- 43011.7%Irish
- 3409.2%French Canadian
- 2536.9%Other
- 2125.7%English
- 1674.5%Italian
- 1484.0%Scottish
- 1383.7%United States
- 1373.7%German
- 902.4%Portuguese
- 732.0%Greek
- 290.8%Norwegian
- 240.7%Swedish
- 200.5%Scotch-Irish
- 170.5%Dutch
- 120.3%Russian
- 120.3%Ukrainian
- 90.2%Lithuanian
- 60.2%Danish
- 10.03%Hungarian
Zip codes: 01080.