Races in Tinicum Township, Pennsylvania (PA) Detailed Stats
Ancestries, Foreign-born residents, place of birth

Recent posts about races in Tinicum Township, Pennsylvania on our local forum with over 2,400,000 registered users:
 | Philadelphia/Delco New to the area buying house. (5 replies) |
| Moving advice needed: can't decide between phl and s jersey (3 replies) |
| Moving from Lehigh Valley to Bucks County (18 replies) |
| People who hate Pa and think EVERYONE is rude... (145 replies) |
1.9% of Tinicum Township, PA residents are foreign-born , which is 271.6% less than the foreign-born rate of 7.0% across the entire state of Pennsylvania.
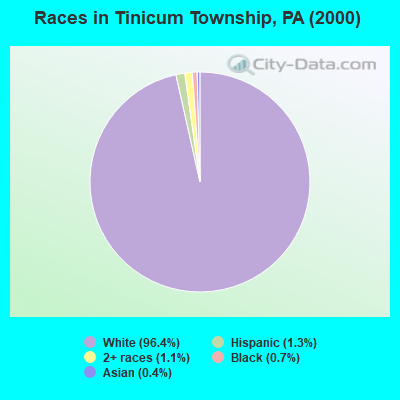
Race distribution in Tinicum Township

- 4,19796.4%White alone
- 551.3%Hispanic
- 471.1%Two or more races
- 320.7%Black alone
- 190.4%Asian alone
- 30.07%American Indian alone
2000
2022
-
- 10,322,45584.1%White alone
- 1,202,4379.8%Black alone
- 394,0883.2%Hispanic
- 218,2961.8%Asian alone
- 113,0970.9%Two or more races
- 13,0860.1%Other race alone
- 14,9040.1%American Indian alone
- 2,6910.02%Native Hawaiian and Other
Pacific Islander alone

-
- 9,487,22873.1%White alone
- 1,311,58110.1%Black alone
- 1,115,9978.6%Hispanic
- 493,9423.8%Two or more races
- 487,1243.8%Asian alone
- 63,5820.5%Other race alone
- 10,1300.08%American Indian alone
- 2,4240.02%Native Hawaiian and Other
Pacific Islander alone

Income and house value in Tinicum Township
- Median household income in 2022
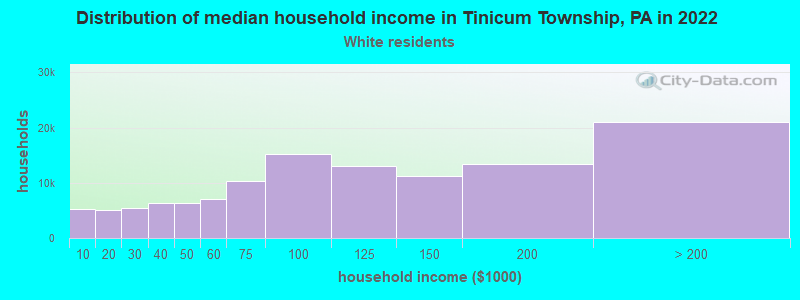
- $80,177White non-Hispanic householders
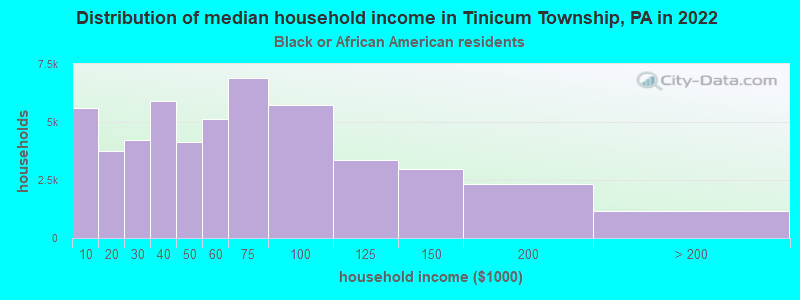
- $57,922Black householders
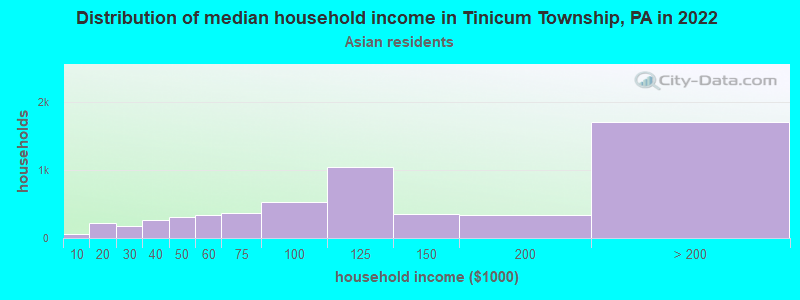
- $50,722Asian householders
- $65,522Two or more races householders
- Median 2022 house value
- $223,580White Non-Hispanic householders
- $136,937Black or African American householders
- $280,098Two or more races householders
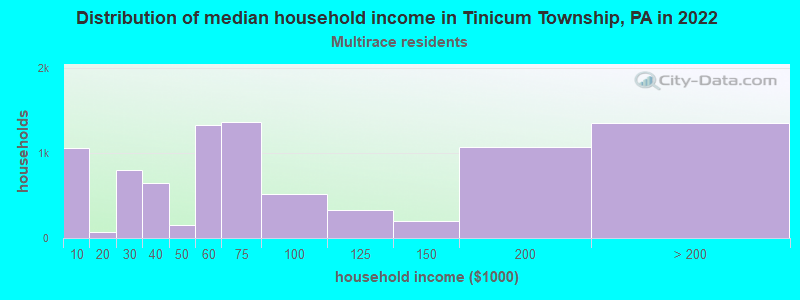
Household income for White non-Hispanic householders
Household income for Black householders
Household income for Asian householders
Household income for Two or more races householders
Foreign-born residents in Tinicum Township
82 residents are foreign born
| This city: | 1.9% |
| Pennsylvania: | 4.1% |
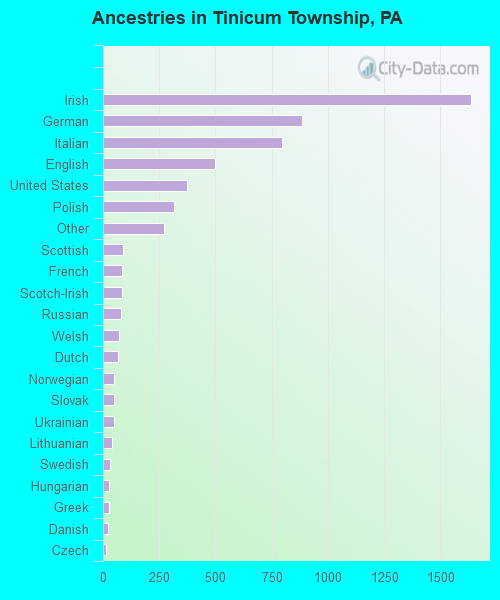
Ancestries in Tinicum Township

- 1,63529.4%Irish
- 88615.9%German
- 79514.3%Italian
- 4999.0%English
- 3756.7%United States
- 3145.6%Polish
- 2734.9%Other
- 891.6%Scottish
- 861.5%French
- 841.5%Scotch-Irish
- 821.5%Russian
- 691.2%Welsh
- 671.2%Dutch
- 510.9%Norwegian
- 480.9%Slovak
- 480.9%Ukrainian
- 410.7%Lithuanian
- 320.6%Swedish
- 260.5%Hungarian
- 250.4%Greek
- 220.4%Danish
- 150.3%Czech
- 50.09%Arab
Zip codes: 19029.