Races in Tisbury, Massachusetts (MA) Detailed Stats
Ancestries, Foreign-born residents, place of birth
6.8% of Tisbury, MA residents are foreign-born (2.9% born in Latin America, 2.0% born in Europe, 0.7% born in Africa), which is 166.1% less than the foreign-born rate of 18.0% across the entire state of Massachusetts.
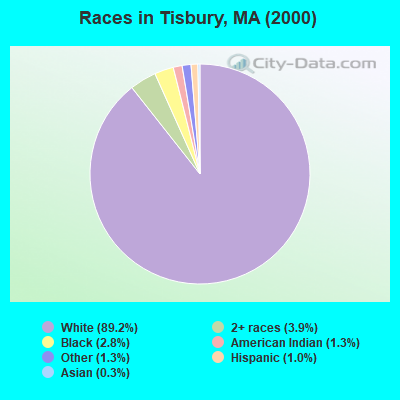
Race distribution in Tisbury

- 3,35089.2%White alone
- 1483.9%Two or more races
- 1072.8%Black alone
- 471.3%Other race alone
- 501.3%American Indian alone
- 391.0%Hispanic
- 120.3%Asian alone
- 20.05%Native Hawaiian and Other
Pacific Islander alone
2000
2022
-
- 5,198,35981.9%White alone
- 428,7296.8%Hispanic
- 318,3295.0%Black alone
- 236,7863.7%Asian alone
- 110,3381.7%Two or more races
- 43,5860.7%Other race alone
- 11,2640.2%American Indian alone
- 1,7060.03%Native Hawaiian and Other
Pacific Islander alone

-
- 4,676,62767.0%White alone
- 911,03813.0%Hispanic
- 501,4637.2%Asian alone
- 459,7406.6%Black alone
- 341,8894.9%Two or more races
- 84,4031.2%Other race alone
- 5,8380.08%American Indian alone
- 9760.01%Native Hawaiian and Other
Pacific Islander alone

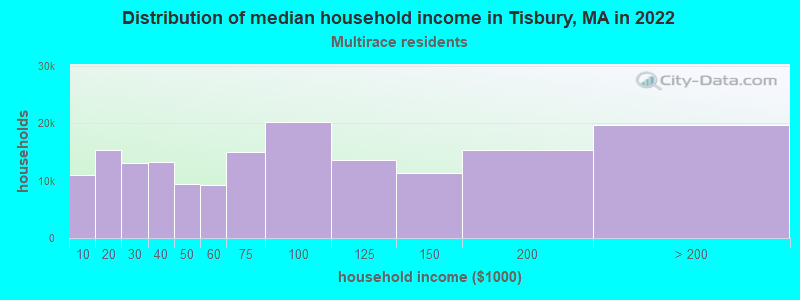
Income and house value in Tisbury
- Median household income in 2022
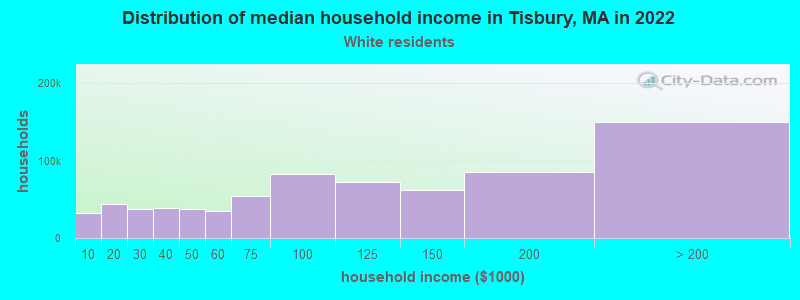
- $70,510White non-Hispanic householders
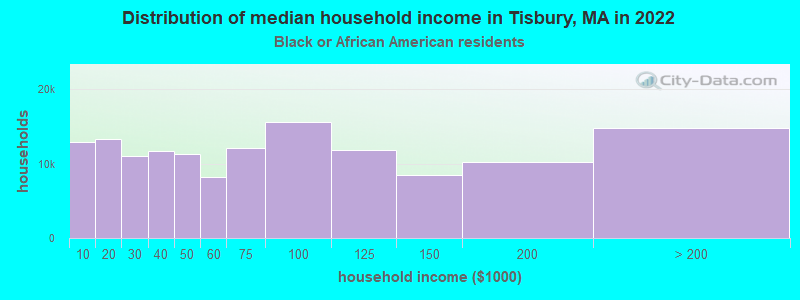
- $48,302Black householders
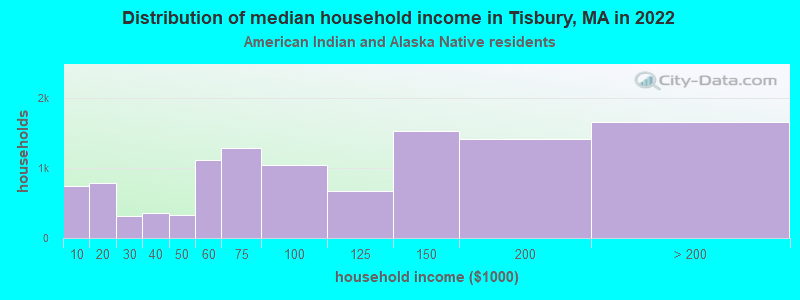
- $138,730American Indian and Alaska Native householders
- $191,643Some other race householders
- $105,963Two or more races householders
- Median 2022 house value
- $972,842White Non-Hispanic householders
- $888,596Black or African American householders
- $618,032American Indian or Alaska Native householders
- over $1,000,000Some other race householders
- over $1,000,000Two or more races householders
Household income for White non-Hispanic householders
Household income for Black householders
Household income for American Indian and Alaska Native householders
Household income for Two or more races householders
Foreign-born residents in Tisbury
254 residents are foreign born (2.9% Latin America, 2.0% Europe, 0.7% Africa).
| This city: | 6.8% |
| Massachusetts: | 12.2% |
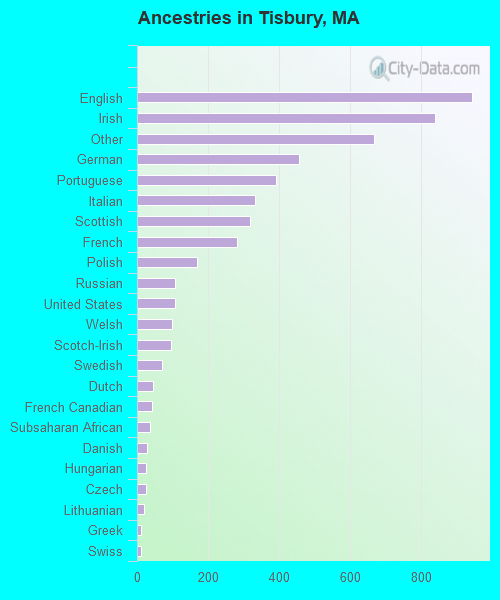
Ancestries in Tisbury

- 94318.4%English
- 83916.4%Irish
- 66613.0%Other
- 4568.9%German
- 3907.6%Portuguese
- 3316.5%Italian
- 3176.2%Scottish
- 2805.5%French
- 1703.3%Polish
- 1082.1%Russian
- 1072.1%United States
- 991.9%Welsh
- 951.9%Scotch-Irish
- 691.3%Swedish
- 440.9%Dutch
- 430.8%French Canadian
- 360.7%Subsaharan African
- 280.5%Danish
- 250.5%Hungarian
- 240.5%Czech
- 190.4%Lithuanian
- 120.2%Greek
- 120.2%Swiss
Zip codes: 02568.