Races in Union, Missouri (MO) Detailed Stats
Data:
Races - White alone (%)
Races - White alone (% change since 2000)
Races - Black alone (%)
Races - Black alone (% change since 2000)
Races - American Indian alone (%)
Races - American Indian alone (% change since 2000)
Races - Asian alone (%)
Races - Asian alone (% change since 2000)
Races - Hispanic (%)
Races - Hispanic (% change since 2000)
Races - Native Hawaiian and Other Pacific Islander alone (%)
Races - Native Hawaiian and Other Pacific Islander alone (% change since 2000)
Races - Two or more races(%)
Races - Two or more races(% change since 2000)
Races - Other race alone (%)
Races - Other race alone (% change since 2000)
Racial diversity
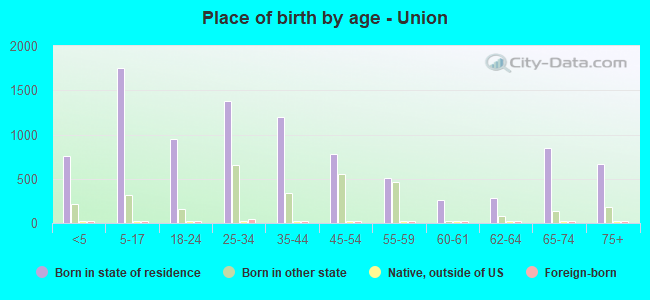
Place of birth - Born in state of residence (%)
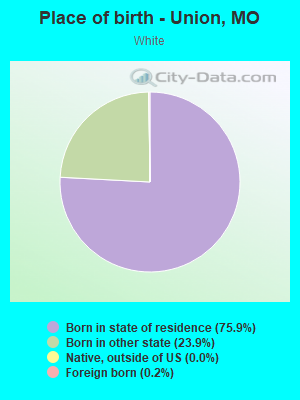
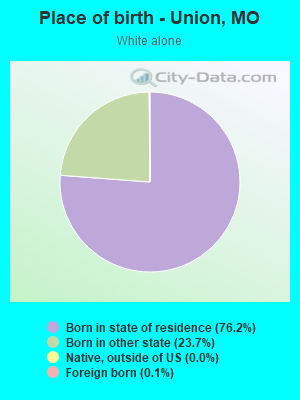
Place of birth - Born in state of residence (%) - White
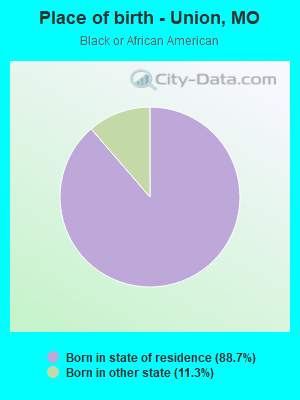
Place of birth - Born in state of residence (%) - Black or African American
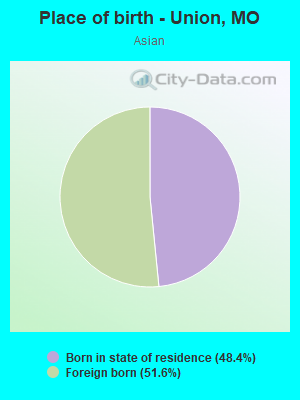
Place of birth - Born in state of residence (%) - Asian
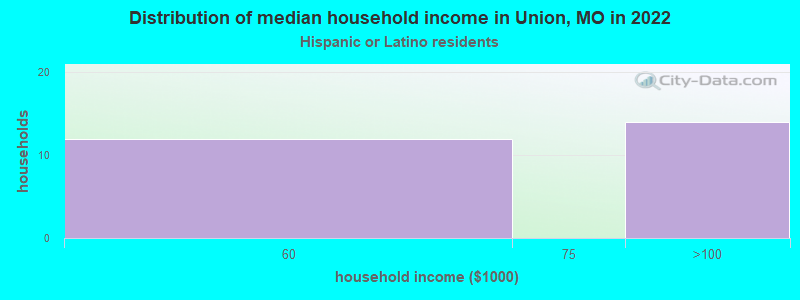
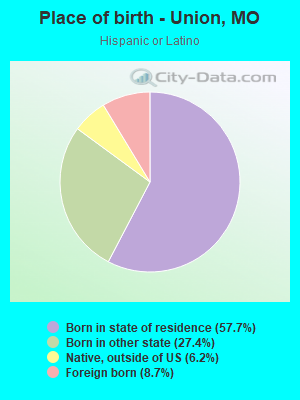
Place of birth - Born in state of residence (%) - Hispanic or Latino
Place of birth - Born in state of residence (%) - American Indian and Alaska Native
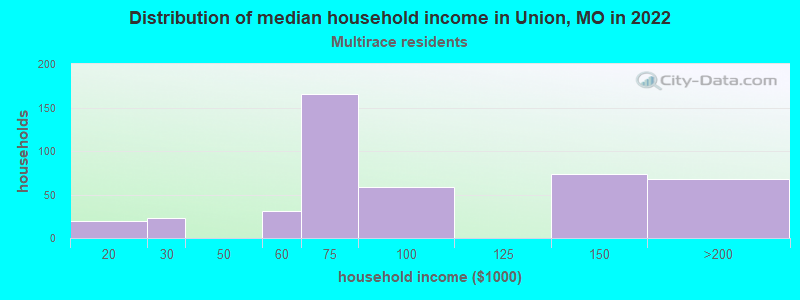
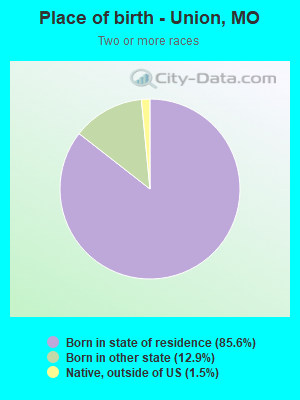
Place of birth - Born in state of residence (%) - Multirace
Place of birth - Born in state of residence (%) - Other Race
Place of birth - Born in other state (%)
Place of birth - Born in other state (%) - White
Place of birth - Born in other state (%) - Black or African American
Place of birth - Born in other state (%) - Asian
Place of birth - Born in other state (%) - Hispanic or Latino
Place of birth - Born in other state (%) - American Indian and Alaska Native
Place of birth - Born in other state (%) - Multirace
Place of birth - Born in other state (%) - Other Race
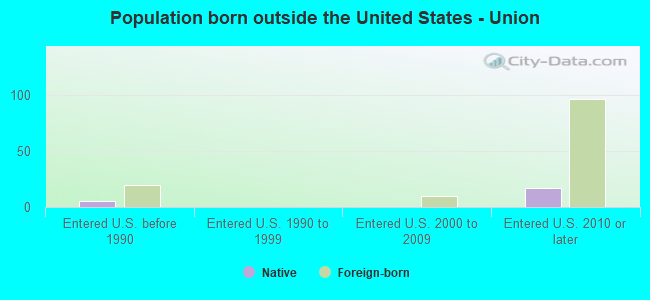
Place of birth - Native, outside of US (%)
Place of birth - Native, outside of US (%) - White
Place of birth - Native, outside of US (%) - Black or African American
Place of birth - Native, outside of US (%) - Asian
Place of birth - Native, outside of US (%) - Hispanic or Latino
Place of birth - Native, outside of US (%) - American Indian and Alaska Native
Place of birth - Native, outside of US (%) - Multirace
Place of birth - Native, outside of US (%) - Other Race
Place of birth - Foreign born (%)
Place of birth - Foreign born (%) - White
Place of birth - Foreign born (%) - Black or African American
Place of birth - Foreign born (%) - Asian
Place of birth - Foreign born (%) - Hispanic or Latino
Place of birth - Foreign born (%) - American Indian and Alaska Native
Place of birth - Foreign born (%) - Multirace
Place of birth - Foreign born (%) - Other Race
Residents speaking English at home (%)
Residents speaking English at home - Born in the United States (%)
Residents speaking English at home - Native, born elsewhere (%)
Residents speaking English at home - Foreign born (%)
Residents speaking Spanish at home (%)
Residents speaking Spanish at home - Born in the United States (%)
Residents speaking Spanish at home - Native, born elsewhere (%)
Residents speaking Spanish at home - Foreign born (%)
Residents speaking other language at home (%)
Residents speaking other language at home - Born in the United States (%)
Residents speaking other language at home - Native, born elsewhere (%)
Residents speaking other language at home - Foreign born (%)
Marital status - Never married (%)
Marital status - Now married (%)
Marital status - Separated (%)
Marital status - Widowed (%)
Marital status - Divorced (%)
Ancestries Reported - Arab (%)
Ancestries Reported - Czech (%)
Ancestries Reported - Danish (%)
Ancestries Reported - Dutch (%)
Ancestries Reported - English (%)
Ancestries Reported - French (%)
Ancestries Reported - French Canadian (%)
Ancestries Reported - German (%)
Ancestries Reported - Greek (%)
Ancestries Reported - Hungarian (%)
Ancestries Reported - Irish (%)
Ancestries Reported - Italian (%)
Ancestries Reported - Lithuanian (%)
Ancestries Reported - Norwegian (%)
Ancestries Reported - Polish (%)
Ancestries Reported - Portuguese (%)
Ancestries Reported - Russian (%)
Ancestries Reported - Scotch-Irish (%)
Ancestries Reported - Scottish (%)
Ancestries Reported - Slovak (%)
Ancestries Reported - Subsaharan African (%)
Ancestries Reported - Swedish (%)
Ancestries Reported - Swiss (%)
Ancestries Reported - Ukrainian (%)
Ancestries Reported - United States (%)
Ancestries Reported - Welsh (%)
Ancestries Reported - West Indian (%)
Ancestries Reported - Other (%)
Geographical mobility - Same house 1 year ago (%)
Geographical mobility - Same house 1 year ago (%) - White
Geographical mobility - Same house 1 year ago (%) - Black or African American
Geographical mobility - Same house 1 year ago (%) - Asian
Geographical mobility - Same house 1 year ago (%) - Hispanic or Latino
Geographical mobility - Same house 1 year ago (%) - American Indian and Alaska Native
Geographical mobility - Same house 1 year ago (%) - Multirace
Geographical mobility - Same house 1 year ago (%) - Other Race
Geographical mobility - Moved within same county (%)
Geographical mobility - Moved within same county (%) - White
Geographical mobility - Moved within same county (%) - Black or African American
Geographical mobility - Moved within same county (%) - Asian
Geographical mobility - Moved within same county (%) - Hispanic or Latino
Geographical mobility - Moved within same county (%) - American Indian and Alaska Native
Geographical mobility - Moved within same county (%) - Multirace
Geographical mobility - Moved within same county (%) - Other Race
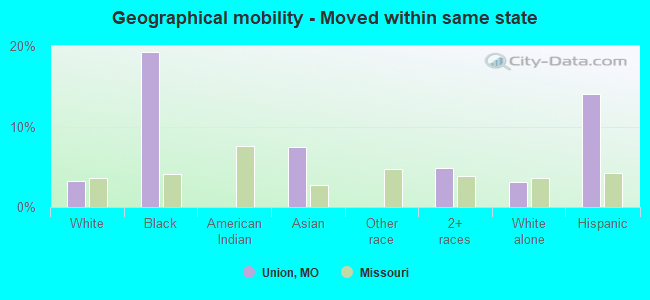
Geographical mobility - Moved from different county within same state (%)
Geographical mobility - Moved from different county within same state (%) - White
Geographical mobility - Moved from different county within same state (%) - Black or African American
Geographical mobility - Moved from different county within same state (%) - Asian
Geographical mobility - Moved from different county within same state (%) - Hispanic or Latino
Geographical mobility - Moved from different county within same state (%) - American Indian and Alaska Native
Geographical mobility - Moved from different county within same state (%) - Multirace
Geographical mobility - Moved from different county within same state (%) - Other Race
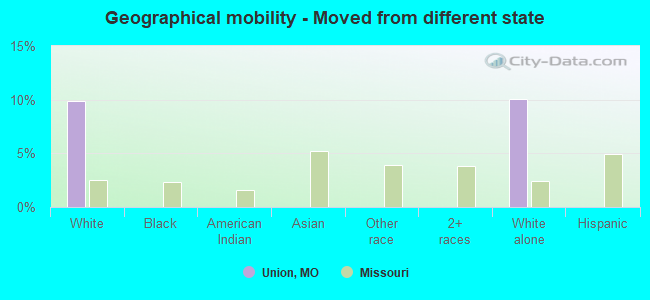
Geographical mobility - Moved from different state (%)
Geographical mobility - Moved from different state (%) - White
Geographical mobility - Moved from different state (%) - Black or African American
Geographical mobility - Moved from different state (%) - Asian
Geographical mobility - Moved from different state (%) - Hispanic or Latino
Geographical mobility - Moved from different state (%) - American Indian and Alaska Native
Geographical mobility - Moved from different state (%) - Multirace
Geographical mobility - Moved from different state (%) - Other Race
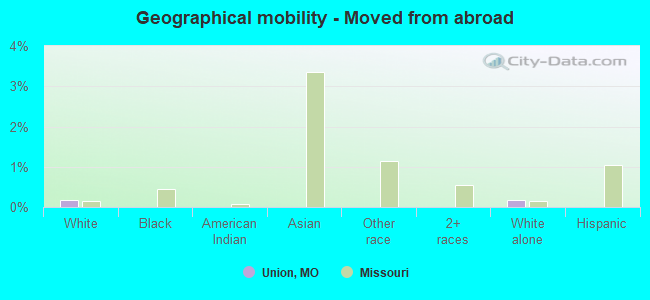
Geographical mobility - Moved from abroad (%)
Geographical mobility - Moved from abroad (%) - White
Geographical mobility - Moved from abroad (%) - Black or African American
Geographical mobility - Moved from abroad (%) - Asian
Geographical mobility - Moved from abroad (%) - Hispanic or Latino
Geographical mobility - Moved from abroad (%) - American Indian and Alaska Native
Geographical mobility - Moved from abroad (%) - Multirace
Geographical mobility - Moved from abroad (%) - Other Race
Place of birth for the foreign-born population - Ireland (%)
Place of birth for the foreign-born population - Denmark (%)
Place of birth for the foreign-born population - Norway (%)
Place of birth for the foreign-born population - Sweden (%)
Place of birth for the foreign-born population - United Kingdom (%)
Place of birth for the foreign-born population - England (%)
Place of birth for the foreign-born population - Scotland (%)
Place of birth for the foreign-born population - Other Northern Europe (%)
Place of birth for the foreign-born population - Austria (%)
Place of birth for the foreign-born population - Belgium (%)
Place of birth for the foreign-born population - France (%)
Place of birth for the foreign-born population - Germany (%)
Place of birth for the foreign-born population - Netherlands (%)
Place of birth for the foreign-born population - Switzerland (%)
Place of birth for the foreign-born population - Other Western Europe (%)
Place of birth for the foreign-born population - Greece (%)
Place of birth for the foreign-born population - Italy (%)
Place of birth for the foreign-born population - Portugal (%)
Place of birth for the foreign-born population - Spain (%)
Place of birth for the foreign-born population - Other Southern Europe (%)
Place of birth for the foreign-born population - Albania (%)
Place of birth for the foreign-born population - Belarus (%)
Place of birth for the foreign-born population - Bosnia and Herzegovina (%)
Place of birth for the foreign-born population - Bulgaria (%)
Place of birth for the foreign-born population - Croatia (%)
Place of birth for the foreign-born population - Czechoslovakia (%)
Place of birth for the foreign-born population - Hungary (%)
Place of birth for the foreign-born population - Latvia (%)
Place of birth for the foreign-born population - Lithuania (%)
Place of birth for the foreign-born population - North Macedonia (Macedonia) (%)
Place of birth for the foreign-born population - Moldova (%)
Place of birth for the foreign-born population - Poland (%)
Place of birth for the foreign-born population - Romania (%)
Place of birth for the foreign-born population - Russia (%)
Place of birth for the foreign-born population - Serbia (%)
Place of birth for the foreign-born population - Ukraine (%)
Place of birth for the foreign-born population - Other Eastern Europe (%)
Place of birth for the foreign-born population - China (%)
Place of birth for the foreign-born population - Hong Kong (%)
Place of birth for the foreign-born population - Taiwan (%)
Place of birth for the foreign-born population - Japan (%)
Place of birth for the foreign-born population - Korea (%)
Place of birth for the foreign-born population - Other Eastern Asia (%)
Place of birth for the foreign-born population - Afghanistan (%)
Place of birth for the foreign-born population - Bangladesh (%)
Place of birth for the foreign-born population - India (%)
Place of birth for the foreign-born population - Iran (%)
Place of birth for the foreign-born population - Kazakhstan (%)
Place of birth for the foreign-born population - Nepal (%)
Place of birth for the foreign-born population - Pakistan (%)
Place of birth for the foreign-born population - Sri Lanka (%)
Place of birth for the foreign-born population - Uzbekistan (%)
Place of birth for the foreign-born population - Other South Central Asia (%)
Place of birth for the foreign-born population - Burma (%)
Place of birth for the foreign-born population - Cambodia (%)
Place of birth for the foreign-born population - Indonesia (%)
Place of birth for the foreign-born population - Laos (%)
Place of birth for the foreign-born population - Malaysia (%)
Place of birth for the foreign-born population - Philippines (%)
Place of birth for the foreign-born population - Singapore (%)
Place of birth for the foreign-born population - Thailand (%)
Place of birth for the foreign-born population - Vietnam (%)
Place of birth for the foreign-born population - Other South Eastern Asia (%)
Place of birth for the foreign-born population - Armenia (%)
Place of birth for the foreign-born population - Iraq (%)
Place of birth for the foreign-born population - Israel (%)
Place of birth for the foreign-born population - Jordan (%)
Place of birth for the foreign-born population - Kuwait (%)
Place of birth for the foreign-born population - Lebanon (%)
Place of birth for the foreign-born population - Saudi Arabia (%)
Place of birth for the foreign-born population - Syria (%)
Place of birth for the foreign-born population - Turkey (%)
Place of birth for the foreign-born population - Yemen (%)
Place of birth for the foreign-born population - Other Western Asia (%)
Place of birth for the foreign-born population - Eritrea (%)
Place of birth for the foreign-born population - Ethiopia (%)
Place of birth for the foreign-born population - Kenya (%)
Place of birth for the foreign-born population - Somalia (%)
Place of birth for the foreign-born population - Uganda (%)
Place of birth for the foreign-born population - Zimbabwe (%)
Place of birth for the foreign-born population - Other Eastern Africa (%)
Place of birth for the foreign-born population - Cameroon (%)
Place of birth for the foreign-born population - Congo (%)
Place of birth for the foreign-born population - Democratic Republic of Congo (Zaire) (%)
Place of birth for the foreign-born population - Other Middle Africa (%)
Place of birth for the foreign-born population - Egypt (%)
Place of birth for the foreign-born population - Morocco (%)
Place of birth for the foreign-born population - Sudan (%)
Place of birth for the foreign-born population - Other Northern Africa (%)
Place of birth for the foreign-born population - South Africa (%)
Place of birth for the foreign-born population - Other Southern Africa (%)
Place of birth for the foreign-born population - Cabo Verde (%)
Place of birth for the foreign-born population - Ghana (%)
Place of birth for the foreign-born population - Liberia (%)
Place of birth for the foreign-born population - Nigeria (%)
Place of birth for the foreign-born population - Senegal (%)
Place of birth for the foreign-born population - Sierra Leone (%)
Place of birth for the foreign-born population - Other Western Africa (%)
Place of birth for the foreign-born population - Australia (%)
Place of birth for the foreign-born population - New Zealand (%)
Place of birth for the foreign-born population - Fiji (%)
Place of birth for the foreign-born population - Micronesia (%)
Place of birth for the foreign-born population - Bahamas (%)
Place of birth for the foreign-born population - Barbados (%)
Place of birth for the foreign-born population - Cuba (%)
Place of birth for the foreign-born population - Dominica (%)
Place of birth for the foreign-born population - Dominican Republic (%)
Place of birth for the foreign-born population - Grenada (%)
Place of birth for the foreign-born population - Haiti (%)
Place of birth for the foreign-born population - Jamaica (%)
Place of birth for the foreign-born population - St. Vincent and the Grenadines (%)
Place of birth for the foreign-born population - Trinidad and Tobago (%)
Place of birth for the foreign-born population - West Indies (%)
Place of birth for the foreign-born population - Other Caribbean (%)
Place of birth for the foreign-born population - Belize (%)
Place of birth for the foreign-born population - Costa Rica (%)
Place of birth for the foreign-born population - El Salvador (%)
Place of birth for the foreign-born population - Guatemala (%)
Place of birth for the foreign-born population - Honduras (%)
Place of birth for the foreign-born population - Mexico (%)
Place of birth for the foreign-born population - Nicaragua (%)
Place of birth for the foreign-born population - Panama (%)
Place of birth for the foreign-born population - Other Central America (%)
Place of birth for the foreign-born population - Argentina (%)
Place of birth for the foreign-born population - Bolivia (%)
Place of birth for the foreign-born population - Brazil (%)
Place of birth for the foreign-born population - Chile (%)
Place of birth for the foreign-born population - Colombia (%)
Place of birth for the foreign-born population - Ecuador (%)
Place of birth for the foreign-born population - Guyana (%)
Place of birth for the foreign-born population - Peru (%)
Place of birth for the foreign-born population - Uruguay (%)
Place of birth for the foreign-born population - Venezuela (%)
Place of birth for the foreign-born population - Other South America (%)
Place of birth for the foreign-born population - Canada (%)
Place of birth for the foreign-born population - Other Northern America (%)
Place of birth for the foreign-born population - Other (%)
Latest news about races in Union, MO collected exclusively by city-data.com from local newspapers, TV, and radio stations
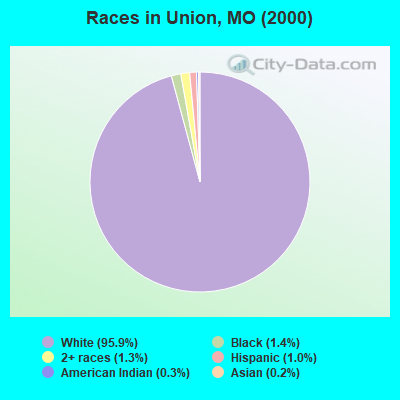
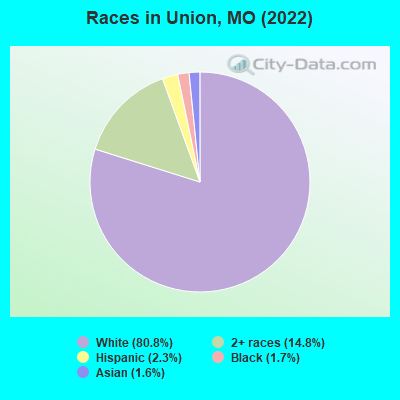
According to 2022 data, the most numerous races in Union, MO are White alone (10,063 residents), Black alone (209 residents), and Two or more races (1,845 residents). 97.9% of Union residents speak English at home. 0.9% of Union, MO residents are foreign-born , which is 329.7% less than the foreign-born rate of 4.0% across the entire state of Missouri.
Race distribution in Union
2000 2022
4,686,474 83.8% White alone 625,667 11.2% Black alone 118,592 2.1% Hispanic 71,905 1.3% Two or more races 61,041 1.1% Asian alone 23,302 0.4% American Indian alone 5,291 0.09% Other race alone 2,939 0.05% Native Hawaiian and Other
4,733,411 76.6% White alone 656,739 10.6% Black alone 316,300 5.1% Two or more races 291,763 4.7% Hispanic 132,436 2.1% Asian alone 27,467 0.4% Other race alone 12,313 0.2% American Indian alone 7,528 0.1% Native Hawaiian and Other
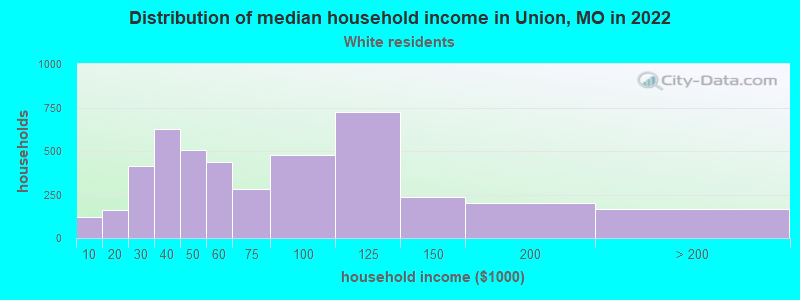
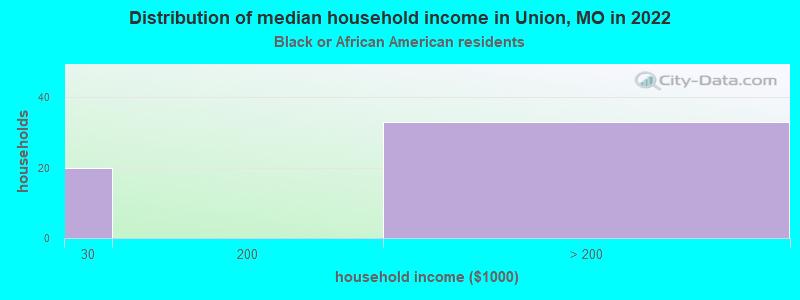
Income and house value in Union Median household income in 2022 $59,015 White non-Hispanic householders$70,278 Two or more races householdersMedian 2022 house value $214,815 White Non-Hispanic householders$135,958 Some other race householders$135,958 Hispanic or Latino householders
Median age by race in Union
37.5 Median age for White residents34.2 41.5 18.3 Median age for Black or African American residents25.9 -685,446,008.7 -640,096,617.7 Median age for American Indian / Alaska Native residents-652,291,104.5 -576,856,648.8 9.8 Median age for Asian residents29.9 3.0 -693,430,656.2 Median age for Native Hawaiian / Pacific Islander residents-666,666,666.0 -666,666,666.0 -693,236,714.3 Median age for Other race residents-694,252,872.9 -684,343,433.7 27.3 Median age for Two or more races residents34.7 25.4 37.4 Median age for White alone residents34.4 41.4 12.5 Median age for Hispanic or Latino residents-663,580,246.2 3.7
Owner/renter occupied households by race in Union
House owners and renters - White residents 2,629 59.2% Owner occupied1,813 40.8% Renter occupiedHouse owners and renters - Black or African American residents 31 58.5% Owner occupied22 41.5% Renter occupiedHouse owners and renters - Asian residents 73 100.0% Owner occupiedHouse owners and renters - Two or more races residents 310 45.7% Owner occupied369 54.3% Renter occupiedHouse owners and renters - White alone residents 2,600 58.6% Owner occupied1,833 41.4% Renter occupiedHouse owners and renters - Hispanic or Latino residents 16 53.2% Owner occupied14 46.8% Renter occupied
Language usage in Union
English speakers - Total 97.9% of residents of Union speak English at home.
0.4% of residents speak Spanish at home 39 76.5% Speak English very well12 23.5% Speak English less than very well1.6% of residents speak other language at home 151 81.6% Speak English very well34 18.4% Speak English less than very well
English speakers - Born in the United States 98.5% of residents of Union speak English at home.
0.7% of residents speak Spanish at home 16 100.0% Speak English less than very well0.7% of residents speak other language at home 4 25.0% Speak English very well12 75.0% Speak English less than very well
English speakers - Native, born elsewhere 23.8% of residents of Union speak English at home.
57.1% of residents speak Spanish at home 12 100.0% Speak English very well
English speakers - Foreign-born 3.4% of residents of Union speak English at home.
19.0% of residents speak Spanish at home 22 100.0% Speak English very well76.7% of residents speak other language at home 68 76.4% Speak English very well21 23.6% Speak English less than very well
White (Caucasian) - Speak only English Native:
99.2% (9,863)Foreign-born:
11.4% (4)
White (Caucasian) - Speak another language Native:
0.9% (90)Foreign-born:
88.0% (30)
White alone - Speak only English Native:
99.0% (9,817)Foreign-born:
19.9% (4)
White alone - Speak another language Native:
1.0% (94)Foreign-born:
82.7% (16)
Hispanic or Latino - Speak another language Native:
20.5% (28)Foreign-born:
99.4% (23)
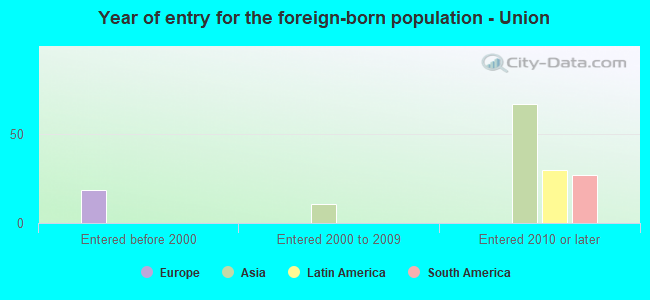
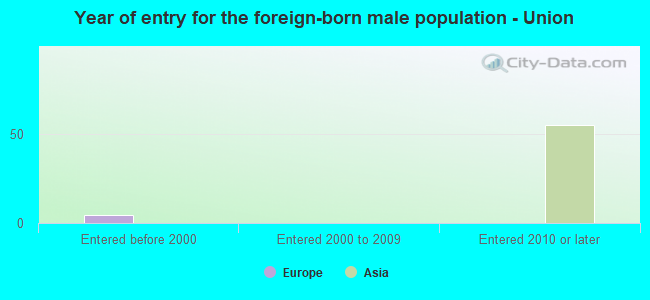
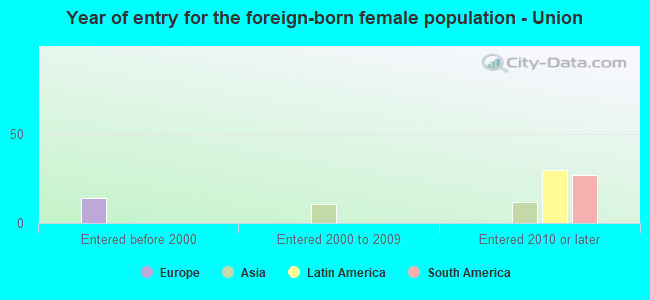
Foreign-born residents in Union 116 residents are foreign born
This city:
0.9%Missouri:
4.2%
Marital status for residents in Union Marital status - White (Caucasian) population 15 years and over
Males 38.8% Never married48.4% Now married0.9% Separated1.6% Widowed10.4% DivorcedFemales 21.7% Never married50.3% Now married2.0% Separated10.6% Widowed15.4% DivorcedWomen who gave birth in the past 12 months Now married:
64.8% (114)Unmarried:
35.2% (62)
Women who did not give birth in the past 12 months Now married:
51.0% (993)Unmarried:
49.0% (955)
Marital status - Black or African American population 15 years and over
Males 71.5% Never married26.3% Now married0.0% Separated0.0% Widowed2.2% DivorcedFemales 97.4% Never married0.0% Now married0.0% Separated0.0% Widowed2.6% DivorcedWomen who did not give birth in the past 12 months Now married:
0.0% (0)Unmarried:
100.0% (173)
Marital status - Asian population 15 years and over
Males 0.0% Never married100.0% Now married0.0% Separated0.0% Widowed0.0% DivorcedFemales 0.0% Never married100.0% Now married0.0% Separated0.0% Widowed0.0% DivorcedWomen who did not give birth in the past 12 months Now married:
100.0% (11)Unmarried:
0.0% (0)
Marital status - Two or more races population 15 years and over
Males 39.8% Never married47.2% Now married0.0% Separated0.0% Widowed13.0% DivorcedFemales 54.2% Never married31.5% Now married0.0% Separated4.8% Widowed9.5% DivorcedWomen who gave birth in the past 12 months Now married:
0.0% (0)Unmarried:
100.0% (166)
Women who did not give birth in the past 12 months Now married:
46.7% (253)Unmarried:
53.3% (288)
Marital status - White alone, not Hispanic / Latino population 15 years and over
Males 38.3% Never married48.7% Now married0.9% Separated1.6% Widowed10.5% DivorcedFemales 22.0% Never married49.6% Now married2.0% Separated10.8% Widowed15.6% DivorcedWomen who gave birth in the past 12 months Now married:
64.8% (113)Unmarried:
35.2% (62)
Women who did not give birth in the past 12 months Now married:
50.4% (970)Unmarried:
49.6% (953)
Marital status - Hispanic or Latino population 15 years and over
Males 77.8% Never married22.2% Now married0.0% Separated0.0% Widowed0.0% DivorcedFemales 16.4% Never married83.6% Now married0.0% Separated0.0% Widowed0.0% DivorcedWomen who did not give birth in the past 12 months Now married:
67.6% (25)Unmarried:
32.4% (12)
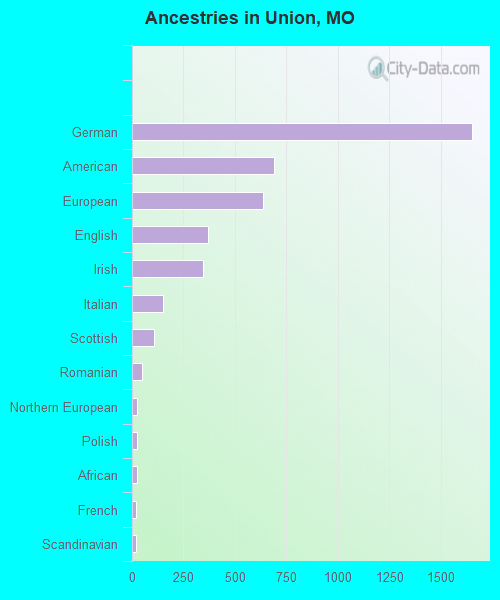
Ancestries in Union
1,651 33.2% German688 13.8% American637 12.8% European371 7.5% English347 7.0% Irish149 3.0% Italian107 2.2% Scottish48 1.0% Romanian26 0.5% Northern European26 0.5% Polish23 0.5% African21 0.4% French21 0.4% Scandinavian15 0.3% Austrian12 0.2% Czech11 0.2% Scotch-Irish4 0.08% Dutch
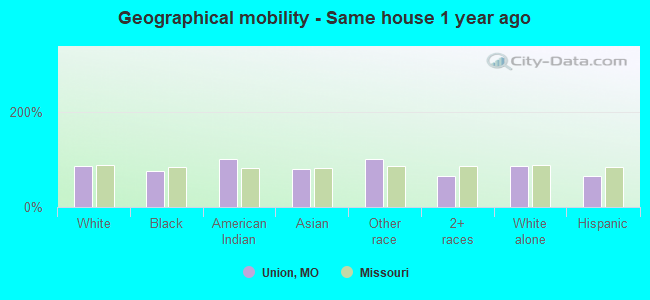
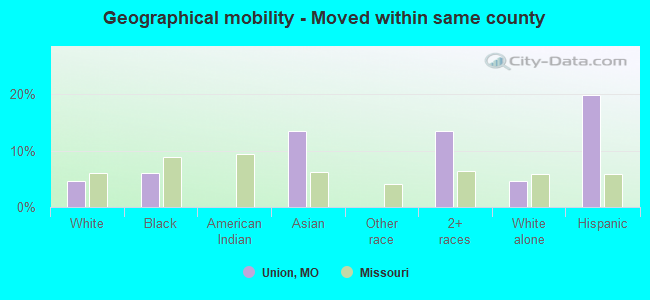
Geographical mobility in Union Same house 1 year ago 8,568 85.0% White (Caucasian)233 74.9% Black or African American5 100.0% American Indian / Alaska Native111 78.6% Asian5 100.0% Other race1,203 66.0% Two or more races8,479 85.2% White alone, not Hispanic / Latino118 65.1% Hispanic or LatinoMoved within same county 460 4.6% White / Caucasian19 6.1% Black or African American19 13.5% Asian246 13.5% Two or more races451 4.5% White alone, not Hispanic / Latino36 19.8% Hispanic or LatinoMoved within same state 321 3.2% White / Caucasian60 19.2% Black or African American11 7.4% Asian89 4.9% Two or more races310 3.1% White alone, not Hispanic / Latino25 14.0% Hispanic or LatinoMoved from different state 1,000 9.9% White / Caucasian1,000 10.0% White alone, not Hispanic / LatinoMoved from abroad 16 0.2% White16 0.2% White alone, not Hispanic / Latino
Children Nativity (place of birth) in Union
Children under 6 years - Living with two parents Both parents native 686 100.0% NativeBoth parents foreign-born 40 100.0% NativeChildren under 6 years - Living with one parent Native parent 218 100.0% Native
Children 6 to 17 years - Living with two parents Both parents native 1,208 99.2% Native10 0.8% Foreign-bornChildren 6 to 17 years - Living with one parent Native parent 654 100.0% Native
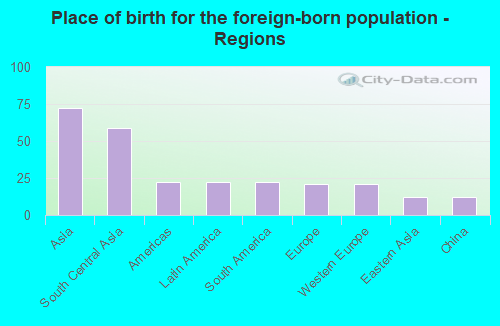
Place of birth for residents in Union 72 Asia59 South Central Asia22 Americas22 Latin America22 South America21 Europe21 Western Europe12 Eastern Asia12 China
Grandparents responsible for own grandchildren in Union
Grandparents (30 to 59 years) White / Caucasian 27 19.2% Responsible for grandchildren114 80.8% Not responsible for grandchildrenAsian 11 100.0% Not responsible for grandchildrenWhite alone, not Hispanic / Latino 27 19.3% Responsible for grandchildren114 80.7% Not responsible for grandchildrenGrandparents (60 years and over) White / Caucasian 8 9.6% Responsible for grandchildren79 90.4% Not responsible for grandchildrenAsian 11 100.0% Not responsible for grandchildrenWhite alone, not Hispanic / Latino 8 9.6% Responsible for grandchildren79 90.4% Not responsible for grandchildren