Races in University Heights, Ohio (OH) Detailed Stats
Data:
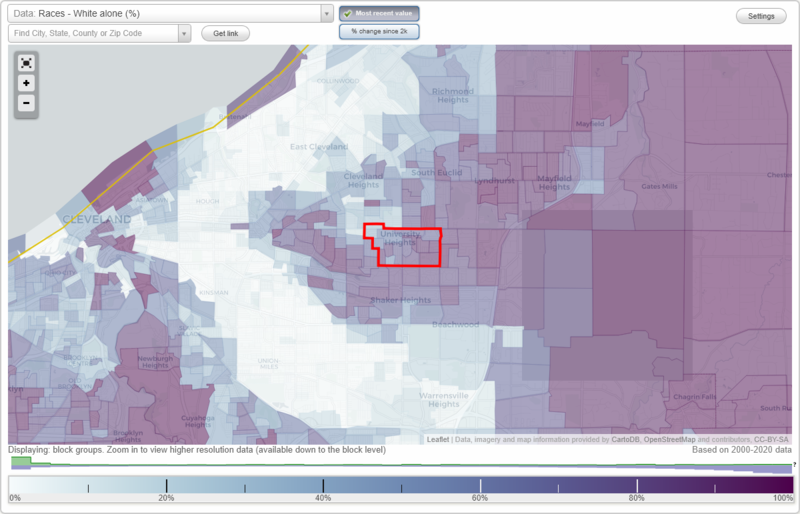
Races - White alone (%)
Races - White alone (% change since 2000)
Races - Black alone (%)
Races - Black alone (% change since 2000)
Races - American Indian alone (%)
Races - American Indian alone (% change since 2000)
Races - Asian alone (%)
Races - Asian alone (% change since 2000)
Races - Hispanic (%)
Races - Hispanic (% change since 2000)
Races - Native Hawaiian and Other Pacific Islander alone (%)
Races - Native Hawaiian and Other Pacific Islander alone (% change since 2000)
Races - Two or more races(%)
Races - Two or more races(% change since 2000)
Races - Other race alone (%)
Races - Other race alone (% change since 2000)
Racial diversity
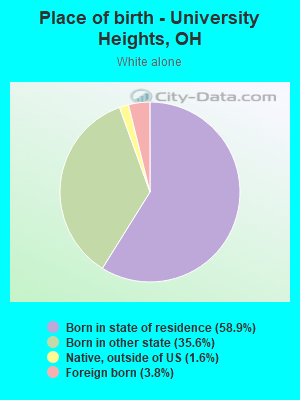
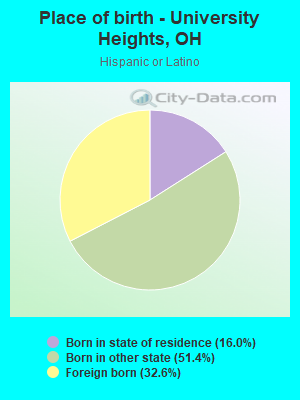
Place of birth - Born in state of residence (%)
Place of birth - Born in state of residence (%) - White
Place of birth - Born in state of residence (%) - Black or African American
Place of birth - Born in state of residence (%) - Asian
Place of birth - Born in state of residence (%) - Hispanic or Latino
Place of birth - Born in state of residence (%) - American Indian and Alaska Native
Place of birth - Born in state of residence (%) - Multirace
Place of birth - Born in state of residence (%) - Other Race
Place of birth - Born in other state (%)
Place of birth - Born in other state (%) - White
Place of birth - Born in other state (%) - Black or African American
Place of birth - Born in other state (%) - Asian
Place of birth - Born in other state (%) - Hispanic or Latino
Place of birth - Born in other state (%) - American Indian and Alaska Native
Place of birth - Born in other state (%) - Multirace
Place of birth - Born in other state (%) - Other Race
Place of birth - Native, outside of US (%)
Place of birth - Native, outside of US (%) - White
Place of birth - Native, outside of US (%) - Black or African American
Place of birth - Native, outside of US (%) - Asian
Place of birth - Native, outside of US (%) - Hispanic or Latino
Place of birth - Native, outside of US (%) - American Indian and Alaska Native
Place of birth - Native, outside of US (%) - Multirace
Place of birth - Native, outside of US (%) - Other Race
Place of birth - Foreign born (%)
Place of birth - Foreign born (%) - White
Place of birth - Foreign born (%) - Black or African American
Place of birth - Foreign born (%) - Asian
Place of birth - Foreign born (%) - Hispanic or Latino
Place of birth - Foreign born (%) - American Indian and Alaska Native
Place of birth - Foreign born (%) - Multirace
Place of birth - Foreign born (%) - Other Race
Residents speaking English at home (%)
Residents speaking English at home - Born in the United States (%)
Residents speaking English at home - Native, born elsewhere (%)
Residents speaking English at home - Foreign born (%)
Residents speaking Spanish at home (%)
Residents speaking Spanish at home - Born in the United States (%)
Residents speaking Spanish at home - Native, born elsewhere (%)
Residents speaking Spanish at home - Foreign born (%)
Residents speaking other language at home (%)
Residents speaking other language at home - Born in the United States (%)
Residents speaking other language at home - Native, born elsewhere (%)
Residents speaking other language at home - Foreign born (%)
Marital status - Never married (%)
Marital status - Now married (%)
Marital status - Separated (%)
Marital status - Widowed (%)
Marital status - Divorced (%)
Ancestries Reported - Arab (%)
Ancestries Reported - Czech (%)
Ancestries Reported - Danish (%)
Ancestries Reported - Dutch (%)
Ancestries Reported - English (%)
Ancestries Reported - French (%)
Ancestries Reported - French Canadian (%)
Ancestries Reported - German (%)
Ancestries Reported - Greek (%)
Ancestries Reported - Hungarian (%)
Ancestries Reported - Irish (%)
Ancestries Reported - Italian (%)
Ancestries Reported - Lithuanian (%)
Ancestries Reported - Norwegian (%)
Ancestries Reported - Polish (%)
Ancestries Reported - Portuguese (%)
Ancestries Reported - Russian (%)
Ancestries Reported - Scotch-Irish (%)
Ancestries Reported - Scottish (%)
Ancestries Reported - Slovak (%)
Ancestries Reported - Subsaharan African (%)
Ancestries Reported - Swedish (%)
Ancestries Reported - Swiss (%)
Ancestries Reported - Ukrainian (%)
Ancestries Reported - United States (%)
Ancestries Reported - Welsh (%)
Ancestries Reported - West Indian (%)
Ancestries Reported - Other (%)
Geographical mobility - Same house 1 year ago (%)
Geographical mobility - Same house 1 year ago (%) - White
Geographical mobility - Same house 1 year ago (%) - Black or African American
Geographical mobility - Same house 1 year ago (%) - Asian
Geographical mobility - Same house 1 year ago (%) - Hispanic or Latino
Geographical mobility - Same house 1 year ago (%) - American Indian and Alaska Native
Geographical mobility - Same house 1 year ago (%) - Multirace
Geographical mobility - Same house 1 year ago (%) - Other Race
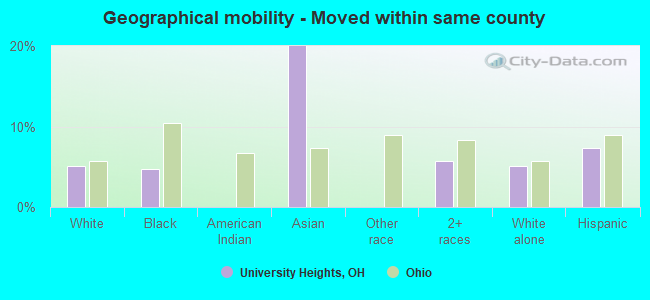
Geographical mobility - Moved within same county (%)
Geographical mobility - Moved within same county (%) - White
Geographical mobility - Moved within same county (%) - Black or African American
Geographical mobility - Moved within same county (%) - Asian
Geographical mobility - Moved within same county (%) - Hispanic or Latino
Geographical mobility - Moved within same county (%) - American Indian and Alaska Native
Geographical mobility - Moved within same county (%) - Multirace
Geographical mobility - Moved within same county (%) - Other Race
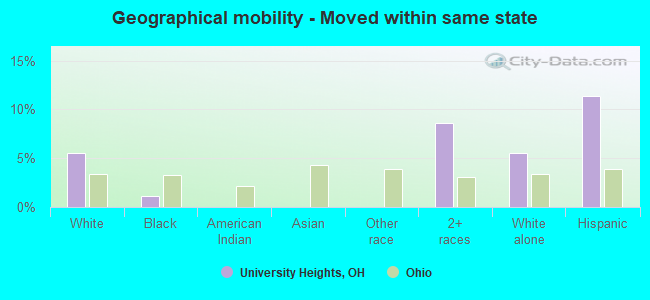
Geographical mobility - Moved from different county within same state (%)
Geographical mobility - Moved from different county within same state (%) - White
Geographical mobility - Moved from different county within same state (%) - Black or African American
Geographical mobility - Moved from different county within same state (%) - Asian
Geographical mobility - Moved from different county within same state (%) - Hispanic or Latino
Geographical mobility - Moved from different county within same state (%) - American Indian and Alaska Native
Geographical mobility - Moved from different county within same state (%) - Multirace
Geographical mobility - Moved from different county within same state (%) - Other Race
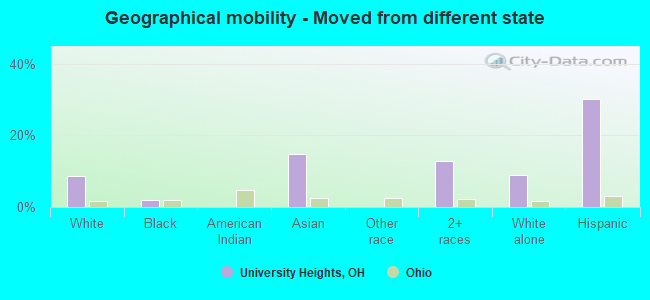
Geographical mobility - Moved from different state (%)
Geographical mobility - Moved from different state (%) - White
Geographical mobility - Moved from different state (%) - Black or African American
Geographical mobility - Moved from different state (%) - Asian
Geographical mobility - Moved from different state (%) - Hispanic or Latino
Geographical mobility - Moved from different state (%) - American Indian and Alaska Native
Geographical mobility - Moved from different state (%) - Multirace
Geographical mobility - Moved from different state (%) - Other Race
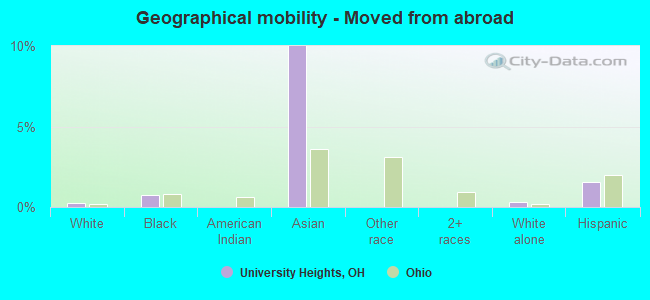
Geographical mobility - Moved from abroad (%)
Geographical mobility - Moved from abroad (%) - White
Geographical mobility - Moved from abroad (%) - Black or African American
Geographical mobility - Moved from abroad (%) - Asian
Geographical mobility - Moved from abroad (%) - Hispanic or Latino
Geographical mobility - Moved from abroad (%) - American Indian and Alaska Native
Geographical mobility - Moved from abroad (%) - Multirace
Geographical mobility - Moved from abroad (%) - Other Race
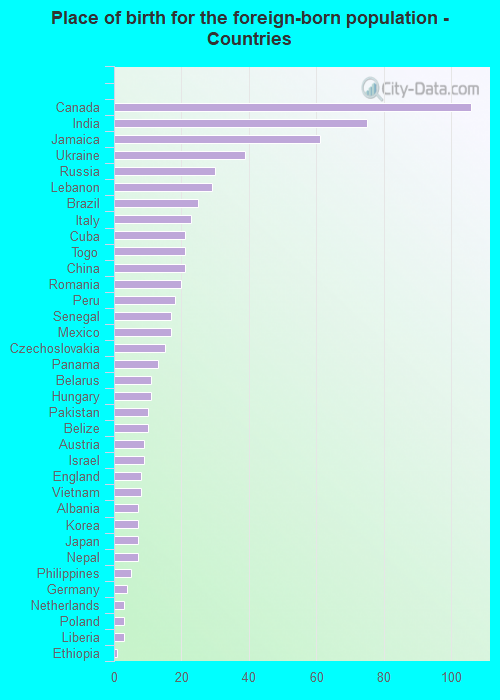
Place of birth for the foreign-born population - Ireland (%)
Place of birth for the foreign-born population - Denmark (%)
Place of birth for the foreign-born population - Norway (%)
Place of birth for the foreign-born population - Sweden (%)
Place of birth for the foreign-born population - United Kingdom (%)
Place of birth for the foreign-born population - England (%)
Place of birth for the foreign-born population - Scotland (%)
Place of birth for the foreign-born population - Other Northern Europe (%)
Place of birth for the foreign-born population - Austria (%)
Place of birth for the foreign-born population - Belgium (%)
Place of birth for the foreign-born population - France (%)
Place of birth for the foreign-born population - Germany (%)
Place of birth for the foreign-born population - Netherlands (%)
Place of birth for the foreign-born population - Switzerland (%)
Place of birth for the foreign-born population - Other Western Europe (%)
Place of birth for the foreign-born population - Greece (%)
Place of birth for the foreign-born population - Italy (%)
Place of birth for the foreign-born population - Portugal (%)
Place of birth for the foreign-born population - Spain (%)
Place of birth for the foreign-born population - Other Southern Europe (%)
Place of birth for the foreign-born population - Albania (%)
Place of birth for the foreign-born population - Belarus (%)
Place of birth for the foreign-born population - Bosnia and Herzegovina (%)
Place of birth for the foreign-born population - Bulgaria (%)
Place of birth for the foreign-born population - Croatia (%)
Place of birth for the foreign-born population - Czechoslovakia (%)
Place of birth for the foreign-born population - Hungary (%)
Place of birth for the foreign-born population - Latvia (%)
Place of birth for the foreign-born population - Lithuania (%)
Place of birth for the foreign-born population - North Macedonia (Macedonia) (%)
Place of birth for the foreign-born population - Moldova (%)
Place of birth for the foreign-born population - Poland (%)
Place of birth for the foreign-born population - Romania (%)
Place of birth for the foreign-born population - Russia (%)
Place of birth for the foreign-born population - Serbia (%)
Place of birth for the foreign-born population - Ukraine (%)
Place of birth for the foreign-born population - Other Eastern Europe (%)
Place of birth for the foreign-born population - China (%)
Place of birth for the foreign-born population - Hong Kong (%)
Place of birth for the foreign-born population - Taiwan (%)
Place of birth for the foreign-born population - Japan (%)
Place of birth for the foreign-born population - Korea (%)
Place of birth for the foreign-born population - Other Eastern Asia (%)
Place of birth for the foreign-born population - Afghanistan (%)
Place of birth for the foreign-born population - Bangladesh (%)
Place of birth for the foreign-born population - India (%)
Place of birth for the foreign-born population - Iran (%)
Place of birth for the foreign-born population - Kazakhstan (%)
Place of birth for the foreign-born population - Nepal (%)
Place of birth for the foreign-born population - Pakistan (%)
Place of birth for the foreign-born population - Sri Lanka (%)
Place of birth for the foreign-born population - Uzbekistan (%)
Place of birth for the foreign-born population - Other South Central Asia (%)
Place of birth for the foreign-born population - Burma (%)
Place of birth for the foreign-born population - Cambodia (%)
Place of birth for the foreign-born population - Indonesia (%)
Place of birth for the foreign-born population - Laos (%)
Place of birth for the foreign-born population - Malaysia (%)
Place of birth for the foreign-born population - Philippines (%)
Place of birth for the foreign-born population - Singapore (%)
Place of birth for the foreign-born population - Thailand (%)
Place of birth for the foreign-born population - Vietnam (%)
Place of birth for the foreign-born population - Other South Eastern Asia (%)
Place of birth for the foreign-born population - Armenia (%)
Place of birth for the foreign-born population - Iraq (%)
Place of birth for the foreign-born population - Israel (%)
Place of birth for the foreign-born population - Jordan (%)
Place of birth for the foreign-born population - Kuwait (%)
Place of birth for the foreign-born population - Lebanon (%)
Place of birth for the foreign-born population - Saudi Arabia (%)
Place of birth for the foreign-born population - Syria (%)
Place of birth for the foreign-born population - Turkey (%)
Place of birth for the foreign-born population - Yemen (%)
Place of birth for the foreign-born population - Other Western Asia (%)
Place of birth for the foreign-born population - Eritrea (%)
Place of birth for the foreign-born population - Ethiopia (%)
Place of birth for the foreign-born population - Kenya (%)
Place of birth for the foreign-born population - Somalia (%)
Place of birth for the foreign-born population - Uganda (%)
Place of birth for the foreign-born population - Zimbabwe (%)
Place of birth for the foreign-born population - Other Eastern Africa (%)
Place of birth for the foreign-born population - Cameroon (%)
Place of birth for the foreign-born population - Congo (%)
Place of birth for the foreign-born population - Democratic Republic of Congo (Zaire) (%)
Place of birth for the foreign-born population - Other Middle Africa (%)
Place of birth for the foreign-born population - Egypt (%)
Place of birth for the foreign-born population - Morocco (%)
Place of birth for the foreign-born population - Sudan (%)
Place of birth for the foreign-born population - Other Northern Africa (%)
Place of birth for the foreign-born population - South Africa (%)
Place of birth for the foreign-born population - Other Southern Africa (%)
Place of birth for the foreign-born population - Cabo Verde (%)
Place of birth for the foreign-born population - Ghana (%)
Place of birth for the foreign-born population - Liberia (%)
Place of birth for the foreign-born population - Nigeria (%)
Place of birth for the foreign-born population - Senegal (%)
Place of birth for the foreign-born population - Sierra Leone (%)
Place of birth for the foreign-born population - Other Western Africa (%)
Place of birth for the foreign-born population - Australia (%)
Place of birth for the foreign-born population - New Zealand (%)
Place of birth for the foreign-born population - Fiji (%)
Place of birth for the foreign-born population - Micronesia (%)
Place of birth for the foreign-born population - Bahamas (%)
Place of birth for the foreign-born population - Barbados (%)
Place of birth for the foreign-born population - Cuba (%)
Place of birth for the foreign-born population - Dominica (%)
Place of birth for the foreign-born population - Dominican Republic (%)
Place of birth for the foreign-born population - Grenada (%)
Place of birth for the foreign-born population - Haiti (%)
Place of birth for the foreign-born population - Jamaica (%)
Place of birth for the foreign-born population - St. Vincent and the Grenadines (%)
Place of birth for the foreign-born population - Trinidad and Tobago (%)
Place of birth for the foreign-born population - West Indies (%)
Place of birth for the foreign-born population - Other Caribbean (%)
Place of birth for the foreign-born population - Belize (%)
Place of birth for the foreign-born population - Costa Rica (%)
Place of birth for the foreign-born population - El Salvador (%)
Place of birth for the foreign-born population - Guatemala (%)
Place of birth for the foreign-born population - Honduras (%)
Place of birth for the foreign-born population - Mexico (%)
Place of birth for the foreign-born population - Nicaragua (%)
Place of birth for the foreign-born population - Panama (%)
Place of birth for the foreign-born population - Other Central America (%)
Place of birth for the foreign-born population - Argentina (%)
Place of birth for the foreign-born population - Bolivia (%)
Place of birth for the foreign-born population - Brazil (%)
Place of birth for the foreign-born population - Chile (%)
Place of birth for the foreign-born population - Colombia (%)
Place of birth for the foreign-born population - Ecuador (%)
Place of birth for the foreign-born population - Guyana (%)
Place of birth for the foreign-born population - Peru (%)
Place of birth for the foreign-born population - Uruguay (%)
Place of birth for the foreign-born population - Venezuela (%)
Place of birth for the foreign-born population - Other South America (%)
Place of birth for the foreign-born population - Canada (%)
Place of birth for the foreign-born population - Other Northern America (%)
Place of birth for the foreign-born population - Other (%)
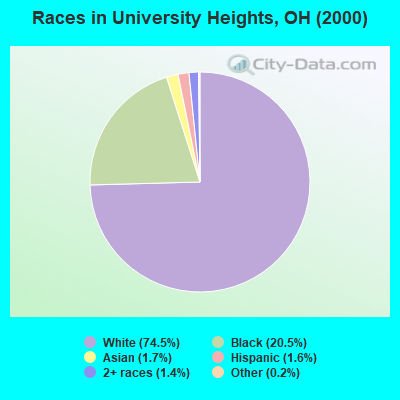
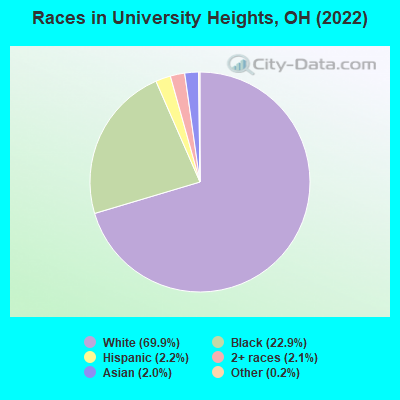
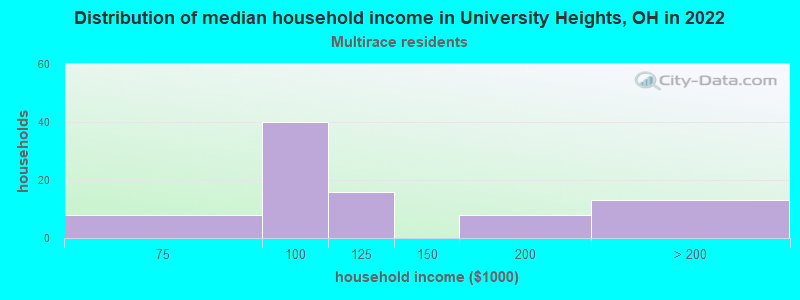
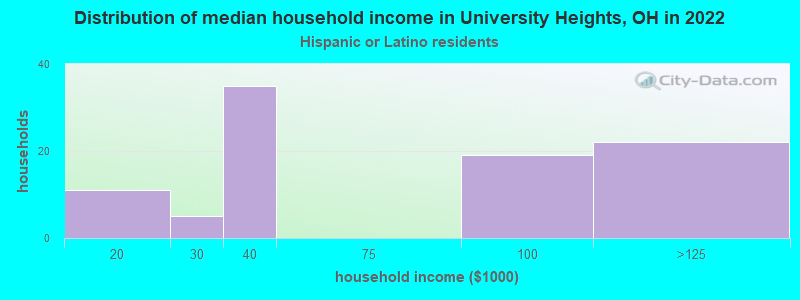
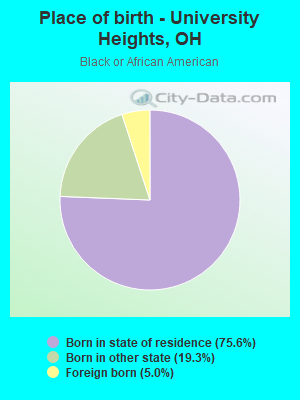
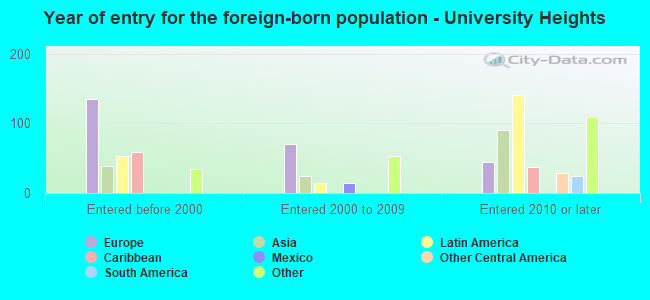
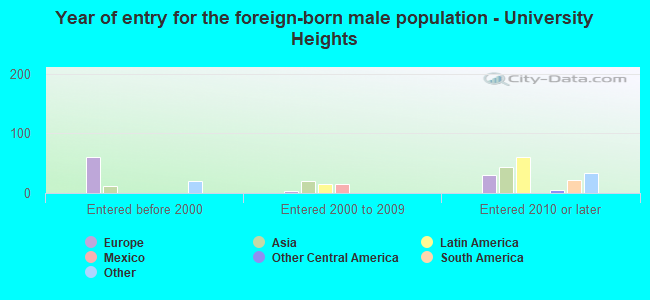
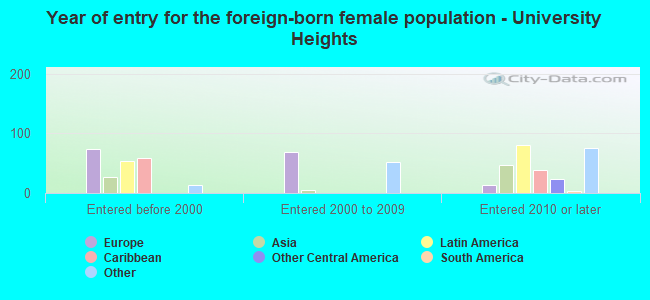
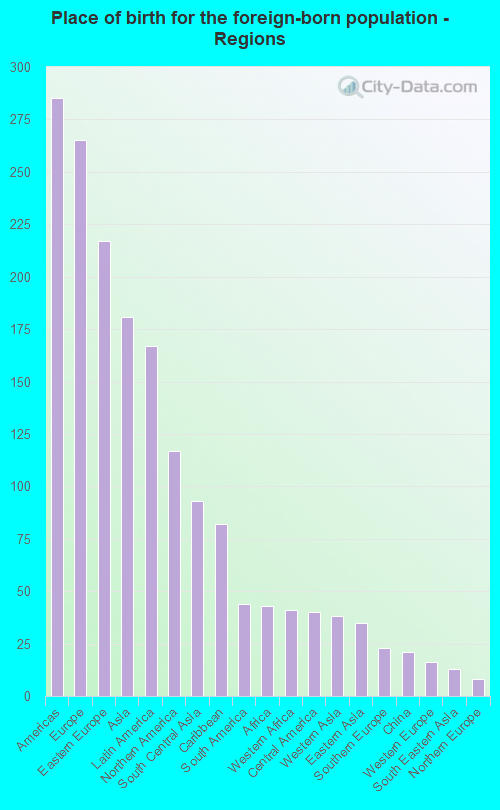
According to 2022 data, the most numerous races in University Heights, OH are White alone (9,384 residents), Black alone (3,081 residents), and Two or more races (285 residents). 91.9% of University Heights residents speak English at home. 5.8% of University Heights, OH residents are foreign-born (1.9% born in Europe, 1.3% born in Asia, 1.2% born in Latin America, 0.8% born in North America), which is 30.7% greater than the foreign-born rate of 4.0% across the entire state of Ohio.
Race distribution in University Heights
2000 2022
9,538,111 84.0% White alone 1,290,662 11.4% Black alone 217,123 1.9% Hispanic 137,770 1.2% Two or more races 131,670 1.2% Asian alone 21,985 0.2% American Indian alone 13,483 0.1% Other race alone 2,336 0.02% Native Hawaiian and Other
8,948,793 76.1% White alone 1,401,403 11.9% Black alone 529,291 4.5% Two or more races 517,232 4.4% Hispanic 293,387 2.5% Asian alone 52,805 0.4% Other race alone 9,785 0.08% American Indian alone 3,362 0.03% Native Hawaiian and Other
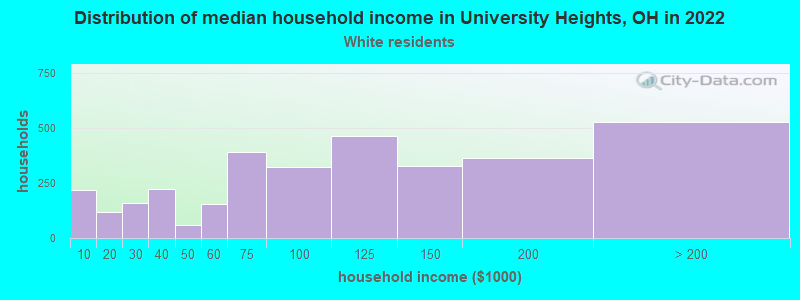
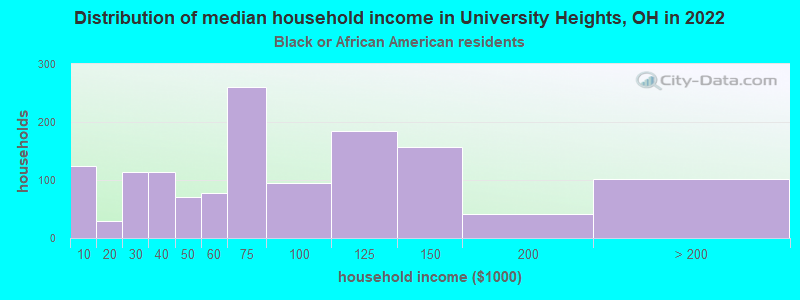
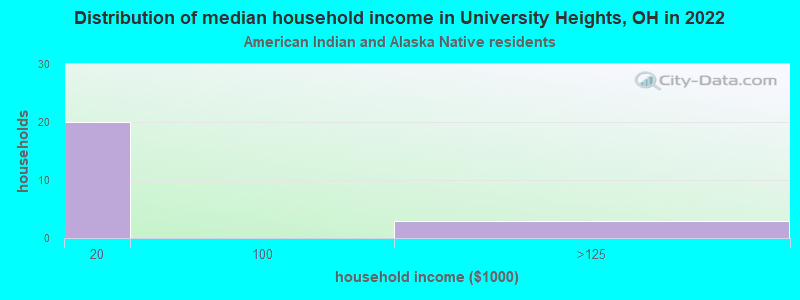
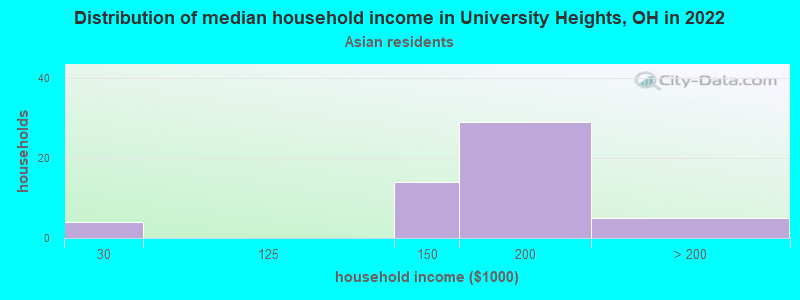
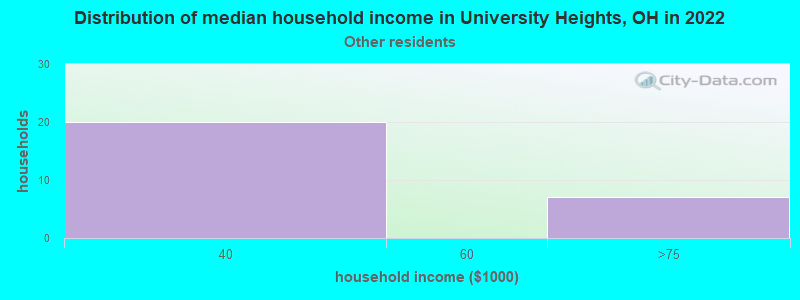
Income and house value in University Heights Median household income in 2022 $99,382 White non-Hispanic householders$68,882 Black householders$176,011 Asian householders$42,426 Some other race householdersMedian 2022 house value $237,363 White Non-Hispanic householders$205,401 Black or African American householders$126,167 American Indian or Alaska Native householders $189,251 Asian householders$239,214 Two or more races householders$218,858 Hispanic or Latino householders
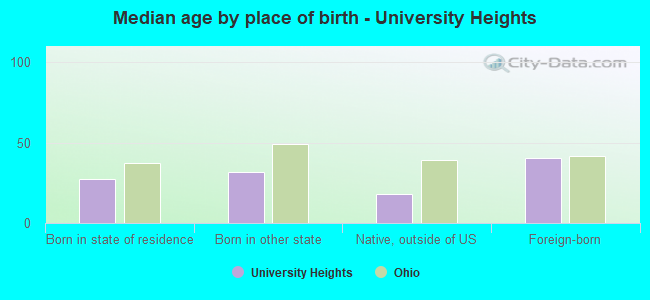
Median age by race in University Heights
29.8 Median age for White residents29.9 29.7 37.7 Median age for Black or African American residents36.7 44.2 -545,601,290.8 Median age for American Indian / Alaska Native residents-734,374,999.3 -499,999,999.5 22.0 Median age for Asian residents22.0 22.0 -706,093,189.3 Median age for Native Hawaiian / Pacific Islander residents-750,242,953.6 -805,394,989.6 27.8 Median age for Other race residents25.1 -710,103,870.9 20.4 Median age for Two or more races residents12.1 21.3 29.6 Median age for White alone residents29.8 29.6 29.2 Median age for Hispanic or Latino residents38.1 25.1
Owner/renter occupied households by race in University Heights
House owners and renters - White residents 2,361 71.1% Owner occupied960 28.9% Renter occupiedHouse owners and renters - Black or African American residents 744 55.2% Owner occupied603 44.8% Renter occupiedHouse owners and renters - American Indian / Alaska Native residents 2 12.1% Owner occupied17 87.9% Renter occupiedHouse owners and renters - Asian residents 42 77.7% Owner occupied12 22.3% Renter occupiedHouse owners and renters - Other race residents 16 67.7% Owner occupied8 32.3% Renter occupiedHouse owners and renters - Two or more races residents 59 68.7% Owner occupied27 31.3% Renter occupiedHouse owners and renters - White alone residents 2,368 71.2% Owner occupied957 28.8% Renter occupiedHouse owners and renters - Hispanic or Latino residents 18 18.7% Owner occupied78 81.3% Renter occupied
Language usage in University Heights
English speakers - Total 91.9% of residents of University Heights speak English at home.
2.0% of residents speak Spanish at home 91 37.1% Speak English very well154 62.9% Speak English less than very well6.2% of residents speak other language at home 524 68.3% Speak English very well243 31.7% Speak English less than very well
English speakers - Born in the United States 94.4% of residents of University Heights speak English at home.
0.6% of residents speak Spanish at home 24 100.0% Speak English very well5.7% of residents speak other language at home 228 94.6% Speak English very well13 5.4% Speak English less than very well
English speakers - Native, born elsewhere 82.0% of residents of University Heights speak English at home.
29.7% of residents speak other language at home 51 100.0% Speak English less than very well
English speakers - Foreign-born 32.6% of residents of University Heights speak English at home.
11.0% of residents speak Spanish at home 15 18.5% Speak English very well66 81.5% Speak English less than very well55.4% of residents speak other language at home 239 58.6% Speak English very well169 41.4% Speak English less than very well
White (Caucasian) - Speak only English Native:
96.7% (7,883)Foreign-born:
40.1% (160)
White (Caucasian) - Speak another language Native:
3.4% (277)Foreign-born:
60.4% (242)
Black or African American - Speak only English Native:
98.9% (2,876)Foreign-born:
31.3% (49)
Black or African American - Speak another language Native:
1.3% (39)Foreign-born:
58.7% (92)
Asian - Speak only English Native:
29.0% (38)Foreign-born:
12.6% (18)
Asian - Speak another language Native:
73.3% (97)Foreign-born:
87.4% (123)
Other race - Speak only English Native:
81.3% (31)Foreign-born:
100.0% (5)
Two or more races - Speak another language Native:
8.1% (23)Foreign-born:
100.0% (8)
White alone - Speak only English Native:
96.0% (7,845)Foreign-born:
45.9% (163)
White alone - Speak another language Native:
4.0% (325)Foreign-born:
54.0% (192)
Hispanic or Latino - Speak another language Native:
21.7% (42)Foreign-born:
100.0% (99)
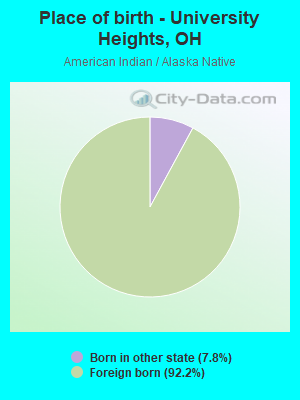
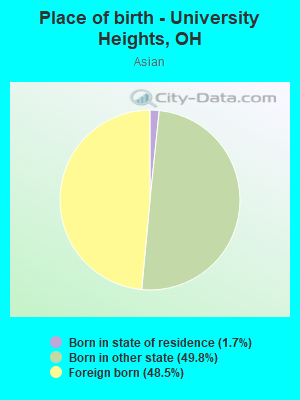
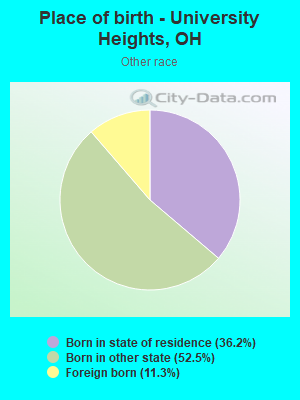
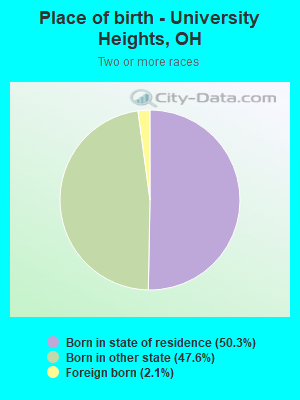
Foreign-born residents in University Heights 775 residents are foreign born (1.9% Europe , 1.3% Asia , 1.2% Latin America , 0.8% North America ).
Marital status for residents in University Heights Marital status - White (Caucasian) population 15 years and over
Males 39.4% Never married51.4% Now married0.3% Separated2.4% Widowed6.5% DivorcedFemales 42.6% Never married43.2% Now married0.5% Separated4.7% Widowed9.1% DivorcedWomen who gave birth in the past 12 months Now married:
90.1% (161)Unmarried:
9.9% (18)
Women who did not give birth in the past 12 months Now married:
34.1% (888)Unmarried:
65.9% (1,715)
Marital status - Black or African American population 15 years and over
Males 52.0% Never married27.0% Now married7.2% Separated3.3% Widowed10.5% DivorcedFemales 40.4% Never married33.6% Now married0.0% Separated9.7% Widowed16.3% DivorcedWomen who gave birth in the past 12 months Now married:
100.0% (8)Unmarried:
0.0% (0)
Women who did not give birth in the past 12 months Now married:
42.2% (273)Unmarried:
57.8% (374)
Marital status - Asian population 15 years and over
Males 62.0% Never married38.0% Now married0.0% Separated0.0% Widowed0.0% DivorcedFemales 70.7% Never married29.3% Now married0.0% Separated0.0% Widowed0.0% DivorcedWomen who did not give birth in the past 12 months Now married:
17.1% (25)Unmarried:
82.9% (119)
Marital status - Other race population 15 years and over
Males 41.7% Never married58.3% Now married0.0% Separated0.0% Widowed0.0% DivorcedFemales 57.1% Never married42.9% Now married0.0% Separated0.0% Widowed0.0% DivorcedWomen who did not give birth in the past 12 months Now married:
42.9% (9)Unmarried:
57.1% (11)
Marital status - Two or more races population 15 years and over
Males 56.4% Never married34.5% Now married0.0% Separated0.0% Widowed9.1% DivorcedFemales 50.6% Never married49.4% Now married0.0% Separated0.0% Widowed0.0% DivorcedWomen who gave birth in the past 12 months Now married:
100.0% (8)Unmarried:
0.0% (0)
Women who did not give birth in the past 12 months Now married:
22.8% (27)Unmarried:
77.2% (91)
Marital status - White alone, not Hispanic / Latino population 15 years and over
Males 39.1% Never married51.5% Now married0.3% Separated2.5% Widowed6.6% DivorcedFemales 42.8% Never married42.5% Now married0.5% Separated4.8% Widowed9.3% DivorcedWomen who gave birth in the past 12 months Now married:
90.1% (166)Unmarried:
9.9% (18)
Women who did not give birth in the past 12 months Now married:
32.9% (844)Unmarried:
67.1% (1,722)
Marital status - Hispanic or Latino population 15 years and over
Males 49.1% Never married37.3% Now married0.0% Separated0.0% Widowed13.6% DivorcedFemales 48.4% Never married51.6% Now married0.0% Separated0.0% Widowed0.0% DivorcedWomen who gave birth in the past 12 months Now married:
100.0% (7)Unmarried:
0.0% (0)
Women who did not give birth in the past 12 months Now married:
48.0% (75)Unmarried:
52.0% (81)
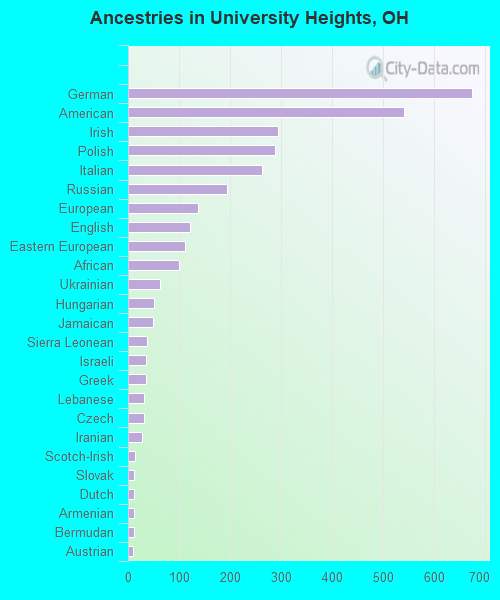
Ancestries in University Heights
674 9.8% German541 7.8% American294 4.3% Irish288 4.2% Polish262 3.8% Italian194 2.8% Russian137 2.0% European121 1.8% English111 1.6% Eastern European100 1.4% African63 0.9% Ukrainian51 0.7% Hungarian49 0.7% Jamaican38 0.6% Sierra Leonean35 0.5% Israeli35 0.5% Greek32 0.5% Lebanese32 0.5% Czech27 0.4% Iranian14 0.2% Scotch-Irish12 0.2% Slovak12 0.2% Dutch12 0.2% Armenian11 0.2% Bermudan10 0.1% Austrian10 0.1% Brazilian10 0.1% Swedish10 0.1% British9 0.1% French9 0.1% Scottish9 0.1% Belizean8 0.1% Scandinavian8 0.1% Croatian7 0.1% Romanian7 0.1% Ethiopian5 0.07% Lithuanian4 0.06% Palestinian4 0.06% Norwegian4 0.06% Serbian4 0.06% Czechoslovakian4 0.06% Canadian3 0.04% French Canadian3 0.04% Portuguese3 0.04% Slovene3 0.04% Slavic2 0.03% Arab2 0.03% Liberian2 0.03% Yugoslavian
Children Nativity (place of birth) in University Heights
Children under 6 years - Living with two parents Both parents native 1,012 100.0% NativeBoth parents foreign-born 15 64.5% Native8 35.5% Foreign-bornOne native, one foreign-born parent 30 100.0% NativeChildren under 6 years - Living with one parent Native parent 107 100.0% NativeChildren 6 to 17 years - Living with two parents Both parents native 1,100 100.0% NativeBoth parents foreign-born 37 100.0% NativeOne native, one foreign-born parent 137 79.6% Native35 20.4% Foreign-bornChildren 6 to 17 years - Living with one parent Native parent 468 100.0% Native