Races in Utica, New York (NY) Detailed Stats
Data:
Races - White alone (%)
Races - White alone (% change since 2000)
Races - Black alone (%)
Races - Black alone (% change since 2000)
Races - American Indian alone (%)
Races - American Indian alone (% change since 2000)
Races - Asian alone (%)
Races - Asian alone (% change since 2000)
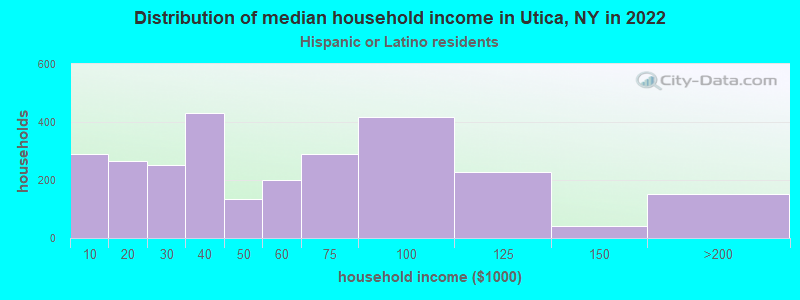
Races - Hispanic (%)
Races - Hispanic (% change since 2000)
Races - Native Hawaiian and Other Pacific Islander alone (%)
Races - Native Hawaiian and Other Pacific Islander alone (% change since 2000)
Races - Two or more races(%)
Races - Two or more races(% change since 2000)
Races - Other race alone (%)
Races - Other race alone (% change since 2000)
Racial diversity
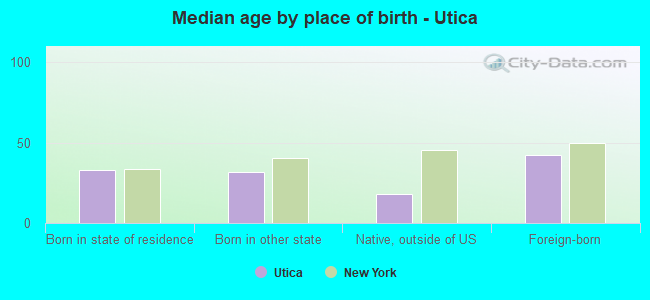
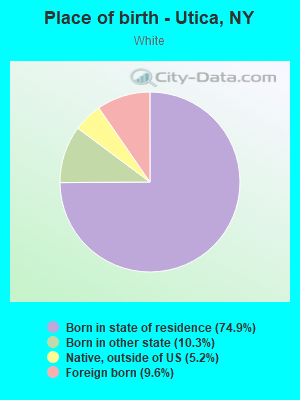
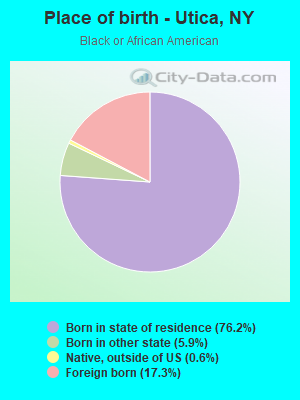
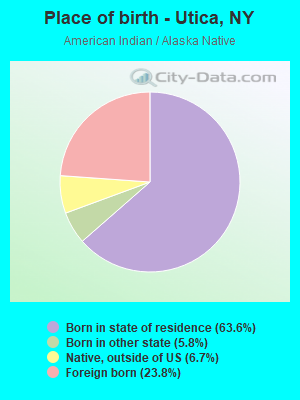
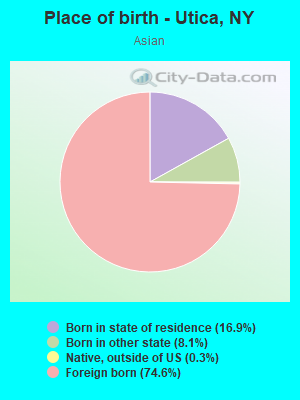
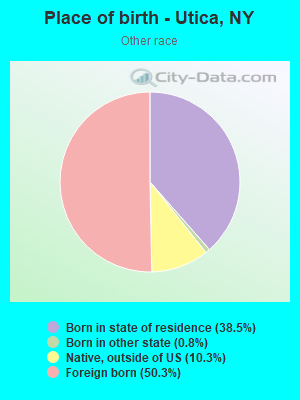
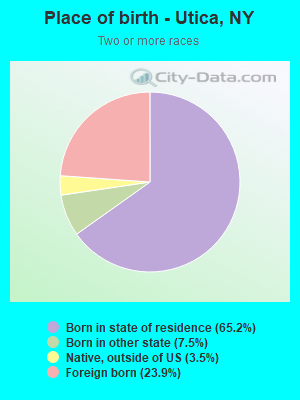
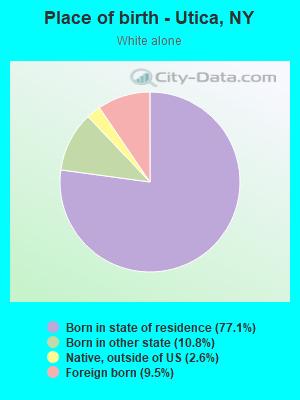
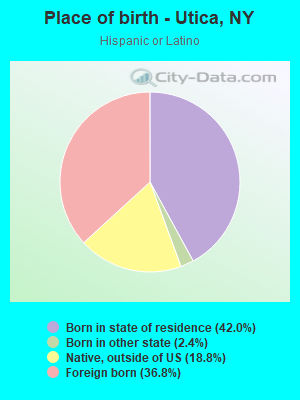
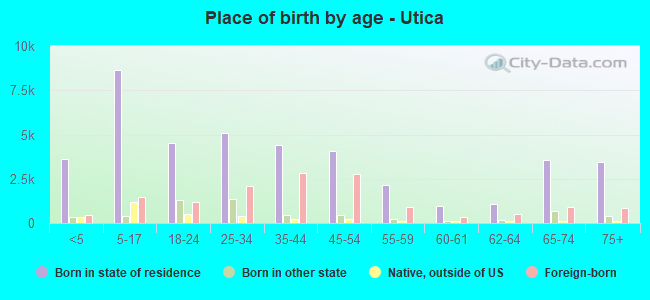
Place of birth - Born in state of residence (%)
Place of birth - Born in state of residence (%) - White
Place of birth - Born in state of residence (%) - Black or African American
Place of birth - Born in state of residence (%) - Asian
Place of birth - Born in state of residence (%) - Hispanic or Latino
Place of birth - Born in state of residence (%) - American Indian and Alaska Native
Place of birth - Born in state of residence (%) - Multirace
Place of birth - Born in state of residence (%) - Other Race
Place of birth - Born in other state (%)
Place of birth - Born in other state (%) - White
Place of birth - Born in other state (%) - Black or African American
Place of birth - Born in other state (%) - Asian
Place of birth - Born in other state (%) - Hispanic or Latino
Place of birth - Born in other state (%) - American Indian and Alaska Native
Place of birth - Born in other state (%) - Multirace
Place of birth - Born in other state (%) - Other Race
Place of birth - Native, outside of US (%)
Place of birth - Native, outside of US (%) - White
Place of birth - Native, outside of US (%) - Black or African American
Place of birth - Native, outside of US (%) - Asian
Place of birth - Native, outside of US (%) - Hispanic or Latino
Place of birth - Native, outside of US (%) - American Indian and Alaska Native
Place of birth - Native, outside of US (%) - Multirace
Place of birth - Native, outside of US (%) - Other Race
Place of birth - Foreign born (%)
Place of birth - Foreign born (%) - White
Place of birth - Foreign born (%) - Black or African American
Place of birth - Foreign born (%) - Asian
Place of birth - Foreign born (%) - Hispanic or Latino
Place of birth - Foreign born (%) - American Indian and Alaska Native
Place of birth - Foreign born (%) - Multirace
Place of birth - Foreign born (%) - Other Race
Residents speaking English at home (%)
Residents speaking English at home - Born in the United States (%)
Residents speaking English at home - Native, born elsewhere (%)
Residents speaking English at home - Foreign born (%)
Residents speaking Spanish at home (%)
Residents speaking Spanish at home - Born in the United States (%)
Residents speaking Spanish at home - Native, born elsewhere (%)
Residents speaking Spanish at home - Foreign born (%)
Residents speaking other language at home (%)
Residents speaking other language at home - Born in the United States (%)
Residents speaking other language at home - Native, born elsewhere (%)
Residents speaking other language at home - Foreign born (%)
Marital status - Never married (%)
Marital status - Now married (%)
Marital status - Separated (%)
Marital status - Widowed (%)
Marital status - Divorced (%)
Ancestries Reported - Arab (%)
Ancestries Reported - Czech (%)
Ancestries Reported - Danish (%)
Ancestries Reported - Dutch (%)
Ancestries Reported - English (%)
Ancestries Reported - French (%)
Ancestries Reported - French Canadian (%)
Ancestries Reported - German (%)
Ancestries Reported - Greek (%)
Ancestries Reported - Hungarian (%)
Ancestries Reported - Irish (%)
Ancestries Reported - Italian (%)
Ancestries Reported - Lithuanian (%)
Ancestries Reported - Norwegian (%)
Ancestries Reported - Polish (%)
Ancestries Reported - Portuguese (%)
Ancestries Reported - Russian (%)
Ancestries Reported - Scotch-Irish (%)
Ancestries Reported - Scottish (%)
Ancestries Reported - Slovak (%)
Ancestries Reported - Subsaharan African (%)
Ancestries Reported - Swedish (%)
Ancestries Reported - Swiss (%)
Ancestries Reported - Ukrainian (%)
Ancestries Reported - United States (%)
Ancestries Reported - Welsh (%)
Ancestries Reported - West Indian (%)
Ancestries Reported - Other (%)
Geographical mobility - Same house 1 year ago (%)
Geographical mobility - Same house 1 year ago (%) - White
Geographical mobility - Same house 1 year ago (%) - Black or African American
Geographical mobility - Same house 1 year ago (%) - Asian
Geographical mobility - Same house 1 year ago (%) - Hispanic or Latino
Geographical mobility - Same house 1 year ago (%) - American Indian and Alaska Native
Geographical mobility - Same house 1 year ago (%) - Multirace
Geographical mobility - Same house 1 year ago (%) - Other Race
Geographical mobility - Moved within same county (%)
Geographical mobility - Moved within same county (%) - White
Geographical mobility - Moved within same county (%) - Black or African American
Geographical mobility - Moved within same county (%) - Asian
Geographical mobility - Moved within same county (%) - Hispanic or Latino
Geographical mobility - Moved within same county (%) - American Indian and Alaska Native
Geographical mobility - Moved within same county (%) - Multirace
Geographical mobility - Moved within same county (%) - Other Race
Geographical mobility - Moved from different county within same state (%)
Geographical mobility - Moved from different county within same state (%) - White
Geographical mobility - Moved from different county within same state (%) - Black or African American
Geographical mobility - Moved from different county within same state (%) - Asian
Geographical mobility - Moved from different county within same state (%) - Hispanic or Latino
Geographical mobility - Moved from different county within same state (%) - American Indian and Alaska Native
Geographical mobility - Moved from different county within same state (%) - Multirace
Geographical mobility - Moved from different county within same state (%) - Other Race
Geographical mobility - Moved from different state (%)
Geographical mobility - Moved from different state (%) - White
Geographical mobility - Moved from different state (%) - Black or African American
Geographical mobility - Moved from different state (%) - Asian
Geographical mobility - Moved from different state (%) - Hispanic or Latino
Geographical mobility - Moved from different state (%) - American Indian and Alaska Native
Geographical mobility - Moved from different state (%) - Multirace
Geographical mobility - Moved from different state (%) - Other Race
Geographical mobility - Moved from abroad (%)
Geographical mobility - Moved from abroad (%) - White
Geographical mobility - Moved from abroad (%) - Black or African American
Geographical mobility - Moved from abroad (%) - Asian
Geographical mobility - Moved from abroad (%) - Hispanic or Latino
Geographical mobility - Moved from abroad (%) - American Indian and Alaska Native
Geographical mobility - Moved from abroad (%) - Multirace
Geographical mobility - Moved from abroad (%) - Other Race
Place of birth for the foreign-born population - Ireland (%)
Place of birth for the foreign-born population - Denmark (%)
Place of birth for the foreign-born population - Norway (%)
Place of birth for the foreign-born population - Sweden (%)
Place of birth for the foreign-born population - United Kingdom (%)
Place of birth for the foreign-born population - England (%)
Place of birth for the foreign-born population - Scotland (%)
Place of birth for the foreign-born population - Other Northern Europe (%)
Place of birth for the foreign-born population - Austria (%)
Place of birth for the foreign-born population - Belgium (%)
Place of birth for the foreign-born population - France (%)
Place of birth for the foreign-born population - Germany (%)
Place of birth for the foreign-born population - Netherlands (%)
Place of birth for the foreign-born population - Switzerland (%)
Place of birth for the foreign-born population - Other Western Europe (%)
Place of birth for the foreign-born population - Greece (%)
Place of birth for the foreign-born population - Italy (%)
Place of birth for the foreign-born population - Portugal (%)
Place of birth for the foreign-born population - Spain (%)
Place of birth for the foreign-born population - Other Southern Europe (%)
Place of birth for the foreign-born population - Albania (%)
Place of birth for the foreign-born population - Belarus (%)
Place of birth for the foreign-born population - Bosnia and Herzegovina (%)
Place of birth for the foreign-born population - Bulgaria (%)
Place of birth for the foreign-born population - Croatia (%)
Place of birth for the foreign-born population - Czechoslovakia (%)
Place of birth for the foreign-born population - Hungary (%)
Place of birth for the foreign-born population - Latvia (%)
Place of birth for the foreign-born population - Lithuania (%)
Place of birth for the foreign-born population - North Macedonia (Macedonia) (%)
Place of birth for the foreign-born population - Moldova (%)
Place of birth for the foreign-born population - Poland (%)
Place of birth for the foreign-born population - Romania (%)
Place of birth for the foreign-born population - Russia (%)
Place of birth for the foreign-born population - Serbia (%)
Place of birth for the foreign-born population - Ukraine (%)
Place of birth for the foreign-born population - Other Eastern Europe (%)
Place of birth for the foreign-born population - China (%)
Place of birth for the foreign-born population - Hong Kong (%)
Place of birth for the foreign-born population - Taiwan (%)
Place of birth for the foreign-born population - Japan (%)
Place of birth for the foreign-born population - Korea (%)
Place of birth for the foreign-born population - Other Eastern Asia (%)
Place of birth for the foreign-born population - Afghanistan (%)
Place of birth for the foreign-born population - Bangladesh (%)
Place of birth for the foreign-born population - India (%)
Place of birth for the foreign-born population - Iran (%)
Place of birth for the foreign-born population - Kazakhstan (%)
Place of birth for the foreign-born population - Nepal (%)
Place of birth for the foreign-born population - Pakistan (%)
Place of birth for the foreign-born population - Sri Lanka (%)
Place of birth for the foreign-born population - Uzbekistan (%)
Place of birth for the foreign-born population - Other South Central Asia (%)
Place of birth for the foreign-born population - Burma (%)
Place of birth for the foreign-born population - Cambodia (%)
Place of birth for the foreign-born population - Indonesia (%)
Place of birth for the foreign-born population - Laos (%)
Place of birth for the foreign-born population - Malaysia (%)
Place of birth for the foreign-born population - Philippines (%)
Place of birth for the foreign-born population - Singapore (%)
Place of birth for the foreign-born population - Thailand (%)
Place of birth for the foreign-born population - Vietnam (%)
Place of birth for the foreign-born population - Other South Eastern Asia (%)
Place of birth for the foreign-born population - Armenia (%)
Place of birth for the foreign-born population - Iraq (%)
Place of birth for the foreign-born population - Israel (%)
Place of birth for the foreign-born population - Jordan (%)
Place of birth for the foreign-born population - Kuwait (%)
Place of birth for the foreign-born population - Lebanon (%)
Place of birth for the foreign-born population - Saudi Arabia (%)
Place of birth for the foreign-born population - Syria (%)
Place of birth for the foreign-born population - Turkey (%)
Place of birth for the foreign-born population - Yemen (%)
Place of birth for the foreign-born population - Other Western Asia (%)
Place of birth for the foreign-born population - Eritrea (%)
Place of birth for the foreign-born population - Ethiopia (%)
Place of birth for the foreign-born population - Kenya (%)
Place of birth for the foreign-born population - Somalia (%)
Place of birth for the foreign-born population - Uganda (%)
Place of birth for the foreign-born population - Zimbabwe (%)
Place of birth for the foreign-born population - Other Eastern Africa (%)
Place of birth for the foreign-born population - Cameroon (%)
Place of birth for the foreign-born population - Congo (%)
Place of birth for the foreign-born population - Democratic Republic of Congo (Zaire) (%)
Place of birth for the foreign-born population - Other Middle Africa (%)
Place of birth for the foreign-born population - Egypt (%)
Place of birth for the foreign-born population - Morocco (%)
Place of birth for the foreign-born population - Sudan (%)
Place of birth for the foreign-born population - Other Northern Africa (%)
Place of birth for the foreign-born population - South Africa (%)
Place of birth for the foreign-born population - Other Southern Africa (%)
Place of birth for the foreign-born population - Cabo Verde (%)
Place of birth for the foreign-born population - Ghana (%)
Place of birth for the foreign-born population - Liberia (%)
Place of birth for the foreign-born population - Nigeria (%)
Place of birth for the foreign-born population - Senegal (%)
Place of birth for the foreign-born population - Sierra Leone (%)
Place of birth for the foreign-born population - Other Western Africa (%)
Place of birth for the foreign-born population - Australia (%)
Place of birth for the foreign-born population - New Zealand (%)
Place of birth for the foreign-born population - Fiji (%)
Place of birth for the foreign-born population - Micronesia (%)
Place of birth for the foreign-born population - Bahamas (%)
Place of birth for the foreign-born population - Barbados (%)
Place of birth for the foreign-born population - Cuba (%)
Place of birth for the foreign-born population - Dominica (%)
Place of birth for the foreign-born population - Dominican Republic (%)
Place of birth for the foreign-born population - Grenada (%)
Place of birth for the foreign-born population - Haiti (%)
Place of birth for the foreign-born population - Jamaica (%)
Place of birth for the foreign-born population - St. Vincent and the Grenadines (%)
Place of birth for the foreign-born population - Trinidad and Tobago (%)
Place of birth for the foreign-born population - West Indies (%)
Place of birth for the foreign-born population - Other Caribbean (%)
Place of birth for the foreign-born population - Belize (%)
Place of birth for the foreign-born population - Costa Rica (%)
Place of birth for the foreign-born population - El Salvador (%)
Place of birth for the foreign-born population - Guatemala (%)
Place of birth for the foreign-born population - Honduras (%)
Place of birth for the foreign-born population - Mexico (%)
Place of birth for the foreign-born population - Nicaragua (%)
Place of birth for the foreign-born population - Panama (%)
Place of birth for the foreign-born population - Other Central America (%)
Place of birth for the foreign-born population - Argentina (%)
Place of birth for the foreign-born population - Bolivia (%)
Place of birth for the foreign-born population - Brazil (%)
Place of birth for the foreign-born population - Chile (%)
Place of birth for the foreign-born population - Colombia (%)
Place of birth for the foreign-born population - Ecuador (%)
Place of birth for the foreign-born population - Guyana (%)
Place of birth for the foreign-born population - Peru (%)
Place of birth for the foreign-born population - Uruguay (%)
Place of birth for the foreign-born population - Venezuela (%)
Place of birth for the foreign-born population - Other South America (%)
Place of birth for the foreign-born population - Canada (%)
Place of birth for the foreign-born population - Other Northern America (%)
Place of birth for the foreign-born population - Other (%)
Latest news about races in Utica, NY collected exclusively by city-data.com from local newspapers, TV, and radio stations
According to 2022 data, the most numerous races in Utica, NY are White alone (34,180 residents), Hispanic (9,322 residents), and Black alone (9,796 residents). 66.0% of Utica residents speak English at home. 22.2% of Utica, NY residents are foreign-born (9.8% born in Asia, 7.1% born in Europe, 4.1% born in Latin America), which is about the same as the foreign-born rate of 22.0% across the entire state of New York.
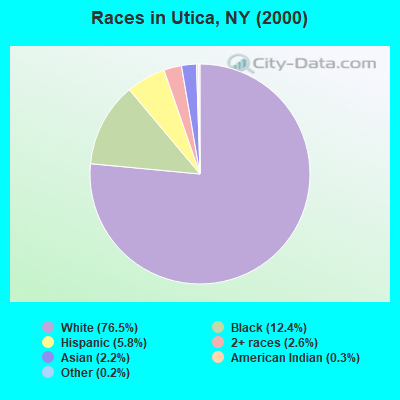
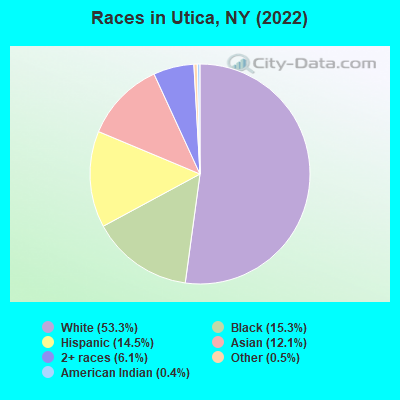
Race distribution in Utica
2000 2022
46,389 76.5% White alone 7,548 12.4% Black alone 3,510 5.8% Hispanic 1,562 2.6% Two or more races 1,331 2.2% Asian alone 154 0.3% American Indian alone 130 0.2% Other race alone 27 0.04% Native Hawaiian and Other
34,180 53.3% White alone 9,796 15.3% Black alone 9,322 14.5% Hispanic 7,788 12.1% Asian alone 3,914 6.1% Two or more races 317 0.5% Other race alone 252 0.4% American Indian alone 9 0.01% Native Hawaiian and Other
2000 2022
11,760,981 62.0% White alone 2,867,583 15.1% Hispanic 2,812,623 14.8% Black alone 1,035,926 5.5% Asian alone 366,116 1.9% Two or more races 75,499 0.4% Other race alone 52,499 0.3% American Indian alone 5,230 0.03% Native Hawaiian and Other
10,408,933 52.9% White alone 3,867,299 19.7% Hispanic 2,633,840 13.4% Black alone 1,776,286 9.0% Asian alone 732,670 3.7% Two or more races 216,110 1.1% Other race alone 35,082 0.2% American Indian alone 6,931 0.04% Native Hawaiian and Other
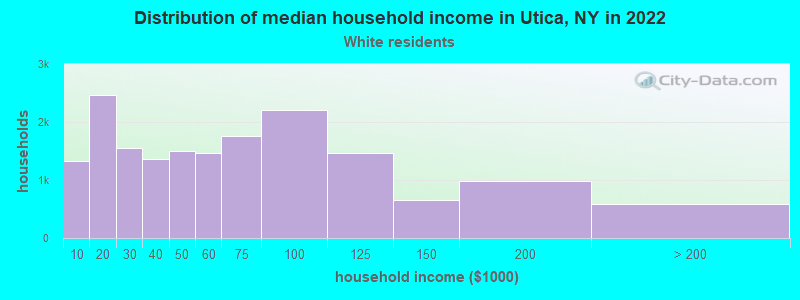
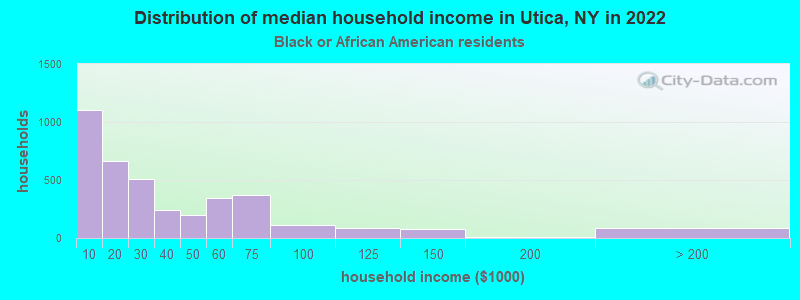
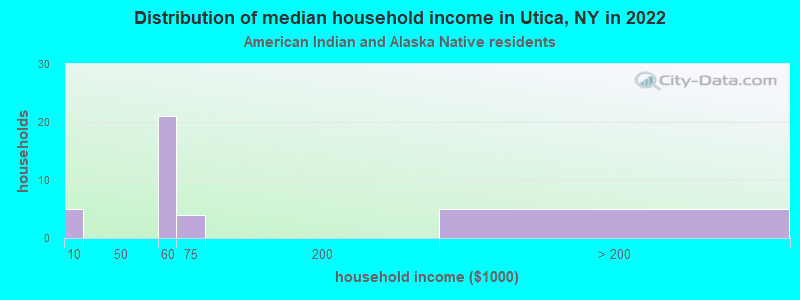
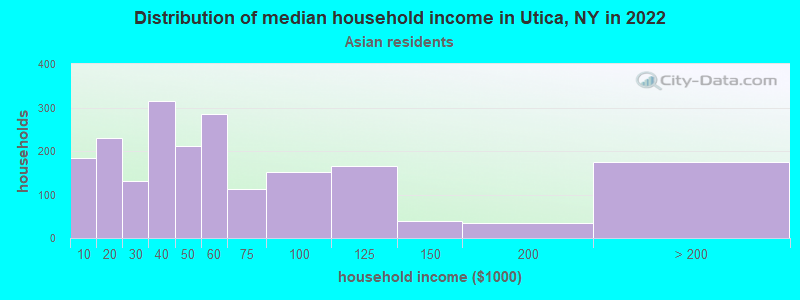
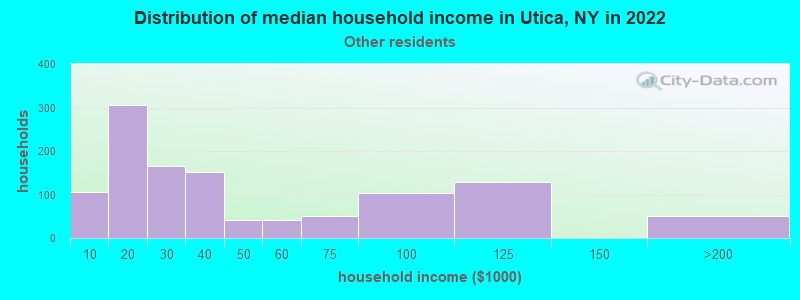
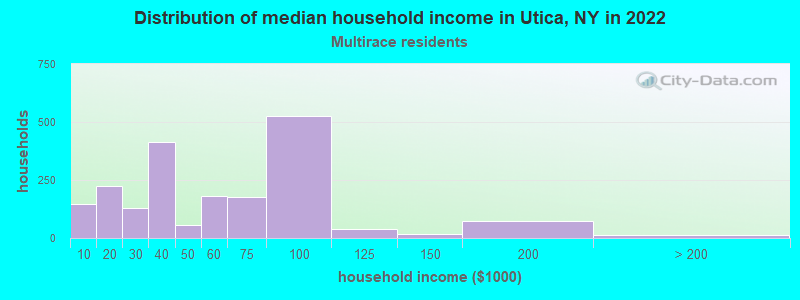
Income and house value in Utica Median household income in 2022 $52,651 White non-Hispanic householders$26,962 Black householders$60,057 American Indian and Alaska Native householders$47,535 Asian householders$28,268 Some other race householders$70,902 Two or more races householders$50,995 Hispanic or Latino race householdersMedian 2022 house value $142,843 White Non-Hispanic householders$101,542 Black or African American householders $118,428 Asian householders$112,723 Some other race householders$100,857 Two or more races householders$122,079 Hispanic or Latino householders
Median age by race in Utica
44.5 Median age for White residents41.1 48.2 23.1 Median age for Black or African American residents21.7 25.6 37.1 Median age for American Indian / Alaska Native residents29.3 25.3 24.3 Median age for Asian residents24.4 24.5 -487,992,314.6 Median age for Native Hawaiian / Pacific Islander residents-477,502,295.2 -497,387,669.3 23.8 Median age for Other race residents18.7 25.5 26.5 Median age for Two or more races residents19.3 29.2 46.1 Median age for White alone residents42.5 49.9 24.3 Median age for Hispanic or Latino residents21.2 34.6
Owner/renter occupied households by race in Utica
House owners and renters - White residents 9,620 55.7% Owner occupied7,644 44.3% Renter occupiedHouse owners and renters - Black or African American residents 911 28.1% Owner occupied2,325 71.9% Renter occupiedHouse owners and renters - American Indian / Alaska Native residents 14 38.1% Owner occupied23 61.9% Renter occupiedHouse owners and renters - Asian residents 1,068 45.5% Owner occupied1,278 54.5% Renter occupiedHouse owners and renters - Other race residents 310 18.6% Owner occupied1,359 81.4% Renter occupiedHouse owners and renters - Two or more races residents 933 39.7% Owner occupied1,418 60.3% Renter occupiedHouse owners and renters - White alone residents 9,294 56.6% Owner occupied7,131 43.4% Renter occupiedHouse owners and renters - Hispanic or Latino residents 1,405 38.2% Owner occupied2,276 61.8% Renter occupied
Language usage in Utica
English speakers - Total 66.0% of residents of Utica speak English at home.
11.7% of residents speak Spanish at home 3,849 55.1% Speak English very well3,141 44.9% Speak English less than very well24.5% of residents speak other language at home 7,790 53.2% Speak English very well6,857 46.8% Speak English less than very well
English speakers - Born in the United States 86.4% of residents of Utica speak English at home.
2.7% of residents speak Spanish at home 146 100.0% Speak English very well9.8% of residents speak other language at home 430 80.4% Speak English very well105 19.6% Speak English less than very well
English speakers - Native, born elsewhere 30.9% of residents of Utica speak English at home.
39.5% of residents speak Spanish at home 311 29.1% Speak English very well756 70.9% Speak English less than very well14.8% of residents speak other language at home 322 80.3% Speak English very well79 19.7% Speak English less than very well
English speakers - Foreign-born 10.3% of residents of Utica speak English at home.
24.5% of residents speak Spanish at home 1,459 42.8% Speak English very well1,947 57.2% Speak English less than very well66.6% of residents speak other language at home 3,364 36.4% Speak English very well5,883 63.6% Speak English less than very well
White (Caucasian) - Speak only English Native:
89.0% (26,662)Foreign-born:
9.4% (321)
White (Caucasian) - Speak another language Native:
10.7% (3,194)Foreign-born:
91.1% (3,109)
Black or African American - Speak only English Native:
66.5% (5,094)Foreign-born:
26.1% (474)
Black or African American - Speak another language Native:
7.1% (544)Foreign-born:
76.8% (1,394)
American Indian / Alaska Native - Speak only English Native:
67.8% (126)Foreign-born:
45.0% (26)
American Indian / Alaska Native - Speak another language Native:
28.5% (53)Foreign-born:
31.8% (18)
Asian - Speak only English Native:
44.4% (699)Foreign-born:
4.7% (255)
Asian - Speak another language Native:
55.0% (867)Foreign-born:
92.3% (4,966)
Other race - Speak only English Native:
26.0% (485)Foreign-born:
2.3% (48)
Other race - Speak another language Native:
79.7% (1,488)Foreign-born:
89.4% (1,846)
Two or more races - Speak only English Native:
73.5% (3,458)Foreign-born:
6.6% (117)
Two or more races - Speak another language Native:
27.6% (1,299)Foreign-born:
94.6% (1,681)
White alone - Speak only English Native:
90.7% (25,781)Foreign-born:
9.2% (286)
White alone - Speak another language Native:
10.2% (2,898)Foreign-born:
90.9% (2,843)
Hispanic or Latino - Speak only English Native:
44.3% (2,188)Foreign-born:
6.9% (253)
Hispanic or Latino - Speak another language Native:
57.3% (2,828)Foreign-born:
92.9% (3,425)
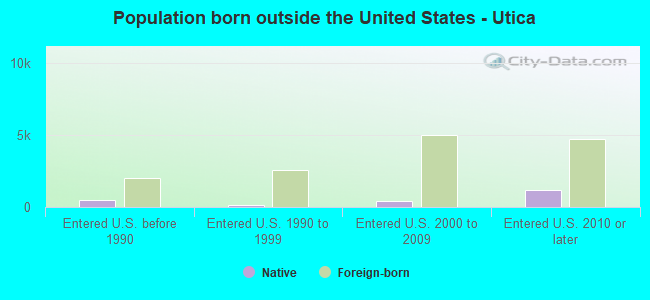
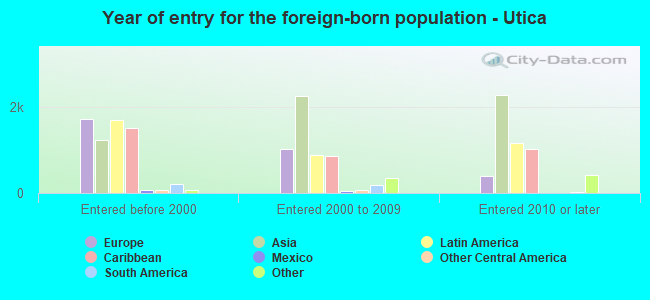
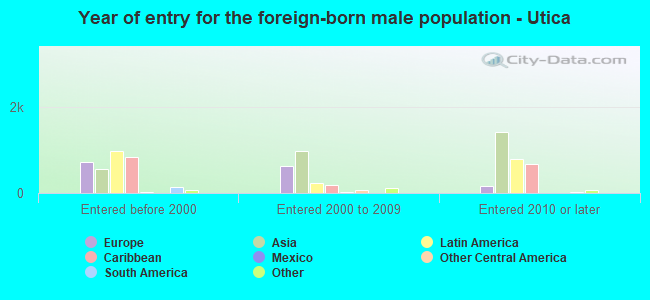
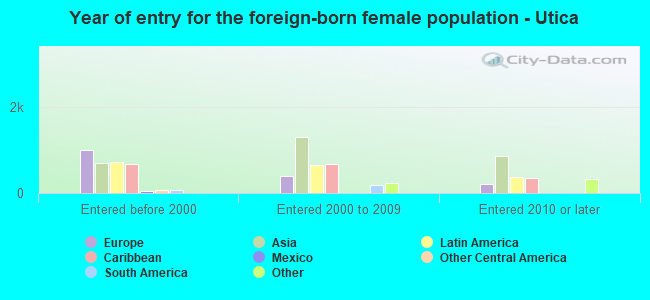
Foreign-born residents in Utica 14,225 residents are foreign born (9.8% Asia , 7.1% Europe , 4.1% Latin America ).
This city:
22.2%New York:
22.6%
Marital status for residents in Utica Marital status - White (Caucasian) population 15 years and over
Males 44.4% Never married41.3% Now married1.5% Separated3.8% Widowed9.0% DivorcedFemales 34.4% Never married40.6% Now married1.7% Separated11.0% Widowed12.3% DivorcedWomen who gave birth in the past 12 months Now married:
68.6% (333)Unmarried:
31.4% (152)
Women who did not give birth in the past 12 months Now married:
38.6% (2,673)Unmarried:
61.4% (4,251)
Marital status - Black or African American population 15 years and over
Males 68.3% Never married16.0% Now married5.8% Separated0.2% Widowed9.6% DivorcedFemales 62.4% Never married14.7% Now married5.3% Separated8.4% Widowed9.1% DivorcedWomen who gave birth in the past 12 months Now married:
17.6% (60)Unmarried:
82.4% (283)
Women who did not give birth in the past 12 months Now married:
17.8% (421)Unmarried:
82.2% (1,941)
Marital status - American Indian / Alaska Native population 15 years and over
Males 68.3% Never married31.7% Now married0.0% Separated0.0% Widowed0.0% DivorcedFemales 64.6% Never married14.6% Now married6.2% Separated14.6% Widowed0.0% DivorcedWomen who did not give birth in the past 12 months Now married:
35.7% (14)Unmarried:
64.3% (26)
Marital status - Asian population 15 years and over
Males 42.4% Never married54.2% Now married1.9% Separated1.3% Widowed0.2% DivorcedFemales 38.2% Never married50.4% Now married1.9% Separated2.9% Widowed6.6% DivorcedWomen who gave birth in the past 12 months Now married:
53.6% (86)Unmarried:
46.4% (74)
Women who did not give birth in the past 12 months Now married:
47.0% (818)Unmarried:
53.0% (922)
Marital status - Other race population 15 years and over
Males 58.8% Never married30.7% Now married5.2% Separated0.5% Widowed4.9% DivorcedFemales 36.8% Never married42.1% Now married0.0% Separated5.2% Widowed16.0% DivorcedWomen who gave birth in the past 12 months Now married:
0.0% (0)Unmarried:
100.0% (33)
Women who did not give birth in the past 12 months Now married:
40.8% (333)Unmarried:
59.2% (484)
Marital status - Two or more races population 15 years and over
Males 61.1% Never married30.4% Now married1.0% Separated0.0% Widowed7.6% DivorcedFemales 50.3% Never married35.2% Now married0.2% Separated2.0% Widowed12.2% DivorcedWomen who gave birth in the past 12 months Now married:
44.9% (46)Unmarried:
55.1% (57)
Women who did not give birth in the past 12 months Now married:
29.0% (507)Unmarried:
71.0% (1,239)
Marital status - White alone, not Hispanic / Latino population 15 years and over
Males 44.0% Never married41.3% Now married1.6% Separated3.9% Widowed9.2% DivorcedFemales 33.2% Never married40.9% Now married1.7% Separated11.4% Widowed12.7% DivorcedWomen who gave birth in the past 12 months Now married:
68.6% (338)Unmarried:
31.4% (154)
Women who did not give birth in the past 12 months Now married:
38.7% (2,534)Unmarried:
61.3% (4,006)
Marital status - Hispanic or Latino population 15 years and over
Males 53.3% Never married36.7% Now married2.3% Separated0.6% Widowed7.1% DivorcedFemales 50.0% Never married38.0% Now married0.4% Separated3.9% Widowed7.7% DivorcedWomen who gave birth in the past 12 months Now married:
40.4% (23)Unmarried:
59.6% (33)
Women who did not give birth in the past 12 months Now married:
37.0% (785)Unmarried:
63.0% (1,336)
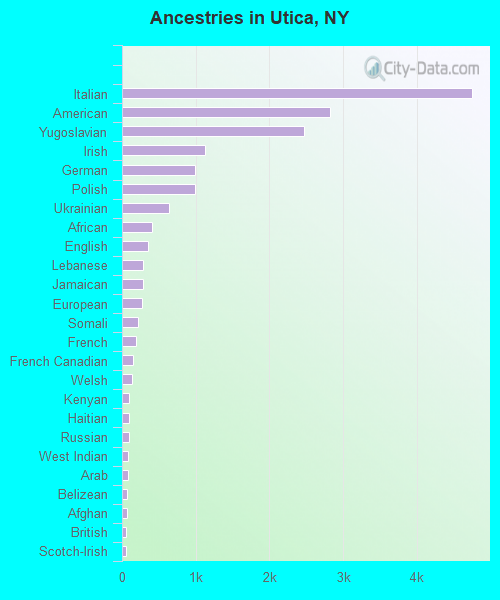
Ancestries in Utica
4,743 13.0% Italian2,827 7.8% American2,467 6.8% Yugoslavian1,126 3.1% Irish994 2.7% German987 2.7% Polish641 1.8% Ukrainian413 1.1% African357 1.0% English286 0.8% Lebanese279 0.8% Jamaican267 0.7% European211 0.6% Somali186 0.5% French149 0.4% French Canadian139 0.4% Welsh99 0.3% Kenyan99 0.3% Haitian96 0.3% Russian85 0.2% West Indian83 0.2% Arab66 0.2% Belizean63 0.2% Afghan58 0.2% British58 0.2% Scotch-Irish42 0.1% Dutch39 0.1% Scottish36 0.10% Croatian35 0.10% Barbadian33 0.09% Portuguese32 0.09% Norwegian29 0.08% Lithuanian29 0.08% Guyanese29 0.08% Swedish28 0.08% Syrian27 0.07% Slavic26 0.07% Trinidadian and Tobagonian25 0.07% Eastern European25 0.07% Pennsylvania German22 0.06% Sudanese21 0.06% Northern European21 0.06% Cajun15 0.04% Hungarian14 0.04% Ethiopian14 0.04% Romanian13 0.04% Iranian10 0.03% Turkish8 0.02% Serbian4 0.01% Scandinavian2 0.01% Ghanaian
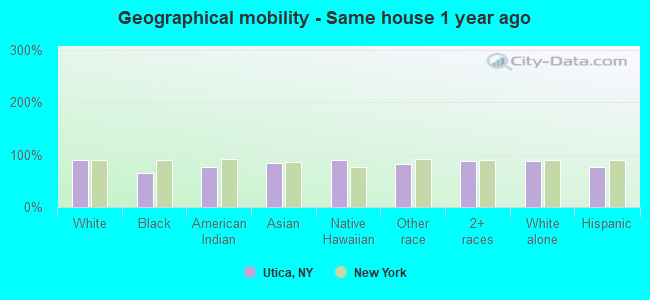
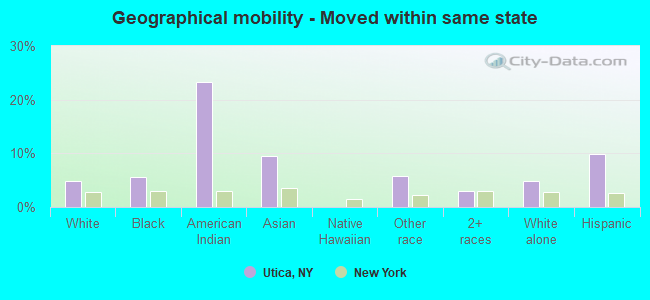
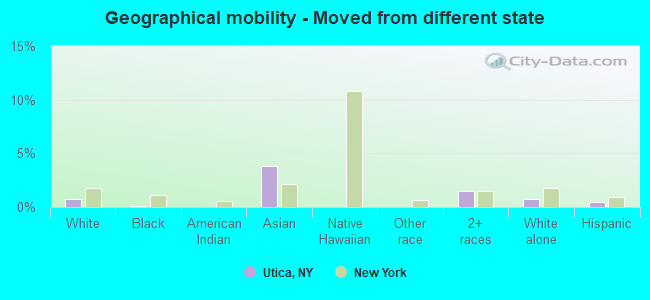
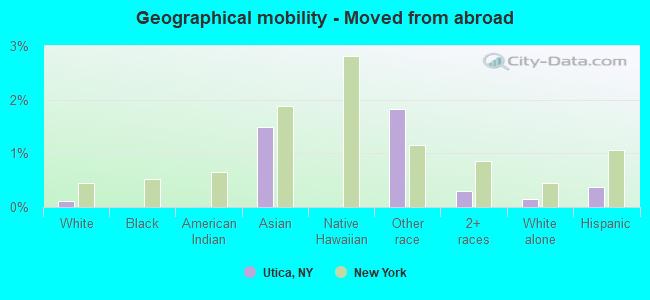
Geographical mobility in Utica Same house 1 year ago 32,215 88.9% White (Caucasian)6,797 64.3% Black or African American189 75.5% American Indian / Alaska Native6,428 83.4% Asian8 89.7% Native Hawaiian / Pacific Islander2,475 81.9% Other race6,221 87.1% Two or more races30,163 88.7% White alone, not Hispanic / Latino7,140 77.2% Hispanic or LatinoMoved within same county 1,777 4.9% White / Caucasian3,398 32.2% Black or African American4 1.4% American Indian / Alaska Native1,228 15.9% Asian306 10.1% Other race662 9.3% Two or more races1,791 5.3% White alone, not Hispanic / Latino1,012 10.9% Hispanic or LatinoMoved within same state 1,734 4.8% White / Caucasian589 5.6% Black or African American58 23.3% American Indian / Alaska Native733 9.5% Asian176 5.8% Other race208 2.9% Two or more races1,642 4.8% White alone, not Hispanic / Latino915 9.9% Hispanic or LatinoMoved from different state 262 0.7% White / Caucasian8 0.1% Black or African American295 3.8% Asian1 0.0% Other race106 1.5% Two or more races239 0.7% White alone, not Hispanic / Latino45 0.5% Hispanic or LatinoMoved from abroad 43 0.1% White115 1.5% Asian55 1.8% Other race22 0.3% Two or more races49 0.1% White alone, not Hispanic / Latino35 0.4% Hispanic or Latino
Children Nativity (place of birth) in Utica
Children under 6 years - Living with two parents Both parents native 1,380 99.7% Native4 0.3% Foreign-bornBoth parents foreign-born 405 68.8% Native184 31.2% Foreign-bornOne native, one foreign-born parent 210 100.0% NativeChildren under 6 years - Living with one parent Native parent 1,391 100.0% NativeForeign-born parent 1,169 94.6% Native67 5.4% Foreign-bornChildren 6 to 17 years - Living with two parents Both parents native 2,459 78.6% Native670 21.4% Foreign-bornBoth parents foreign-born 1,894 76.4% Native584 23.6% Foreign-bornOne native, one foreign-born parent 222 100.0% NativeChildren 6 to 17 years - Living with one parent Native parent 830 100.0% NativeForeign-born parent 3,434 77.8% Native980 22.2% Foreign-born
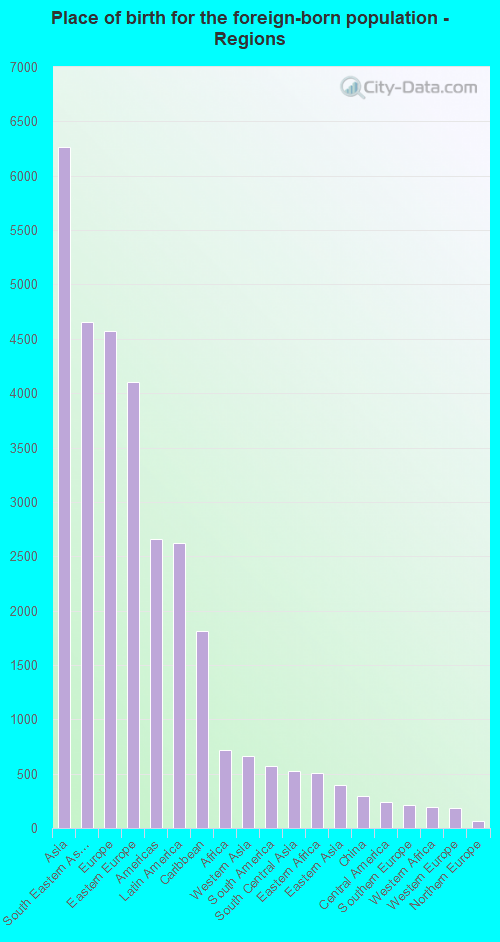
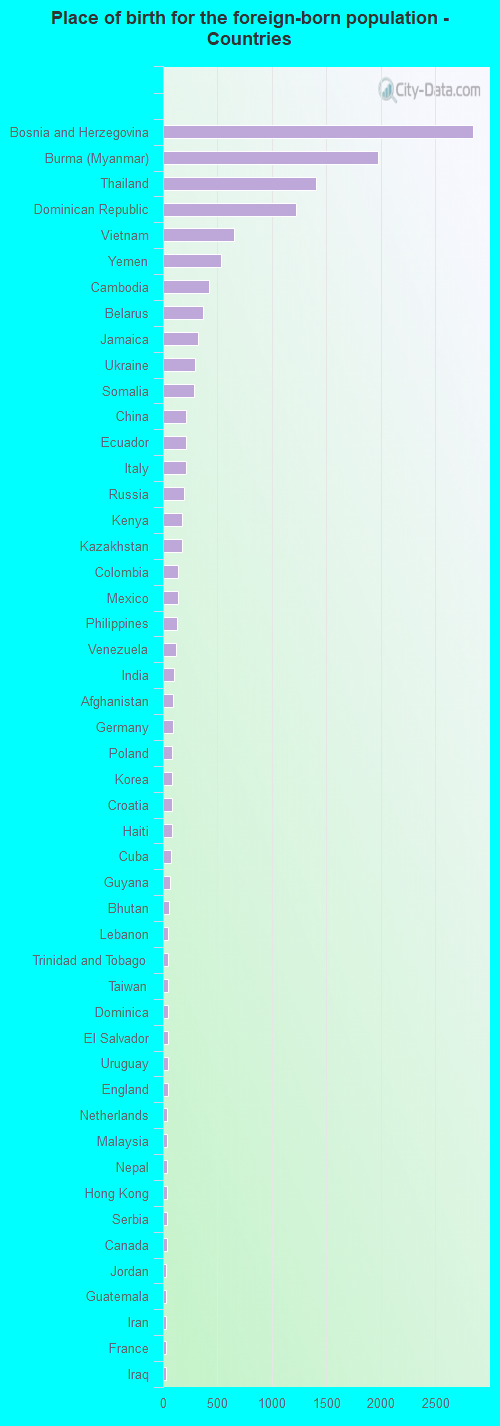
Place of birth for residents in Utica 6,264 Asia4,655 South Eastern Asia4,568 Europe4,106 Eastern Europe2,656 Americas2,623 Latin America1,815 Caribbean720 Africa665 Western Asia569 South America520 South Central Asia504 Eastern Africa395 Eastern Asia298 China237 Central America207 Southern Europe195 Western Africa186 Western Europe67 Northern Europe33 Northern America17 Northern Africa15 Oceania6 Australia and New Zealand Subregion2,849 Bosnia and Herzegovina1,976 Burma (Myanmar)1,402 Thailand1,216 Dominican Republic656 Vietnam531 Yemen422 Cambodia368 Belarus322 Jamaica295 Ukraine288 Somalia214 China210 Ecuador207 Italy196 Russia177 Kenya170 Kazakhstan136 Colombia136 Mexico133 Philippines117 Venezuela102 India93 Afghanistan90 Germany85 Poland82 Korea79 Croatia79 Haiti72 Cuba60 Guyana57 Bhutan50 Lebanon48 Trinidad and Tobago47 Taiwan47 Dominica44 El Salvador44 Uruguay42 England38 Netherlands37 Malaysia36 Nepal36 Hong Kong35 Serbia33 Canada32 Jordan31 Guatemala31 Iran30 France30 Iraq23 Pakistan19 Austria16 Ireland16 Laos15 Panama14 Japan12 Grenada11 Ethiopia10 Syria9 Turkey9 Indonesia8 Nicaragua7 Belgium7 United Kingdom7 St. Vincent and the Grenadines6 Australia3 Uzbekistan3 Moldova2 Ghana
Grandparents responsible for own grandchildren in Utica
Grandparents (30 to 59 years) White / Caucasian 92 24.8% Responsible for grandchildren279 75.2% Not responsible for grandchildrenBlack or African American 13 24.4% Responsible for grandchildren39 75.6% Not responsible for grandchildrenAsian 32 22.4% Responsible for grandchildren112 77.6% Not responsible for grandchildrenOther race 40 100.0% Not responsible for grandchildrenTwo or more races 32 100.0% Not responsible for grandchildrenWhite alone, not Hispanic / Latino 107 27.7% Responsible for grandchildren279 72.3% Not responsible for grandchildrenHispanic or Latino 13 14.0% Responsible for grandchildren78 86.0% Not responsible for grandchildrenGrandparents (60 years and over) White / Caucasian 31 7.3% Responsible for grandchildren398 92.7% Not responsible for grandchildrenBlack or African American 8 18.0% Responsible for grandchildren35 82.0% Not responsible for grandchildrenAsian 25 13.4% Responsible for grandchildren163 86.6% Not responsible for grandchildrenOther race 9 9.1% Responsible for grandchildren86 90.9% Not responsible for grandchildrenTwo or more races 101 100.0% Not responsible for grandchildrenWhite alone, not Hispanic / Latino 31 7.7% Responsible for grandchildren376 92.3% Not responsible for grandchildrenHispanic or Latino 11 6.7% Responsible for grandchildren154 93.3% Not responsible for grandchildren