Races in Uvalde, Texas (TX) Detailed Stats
Data:
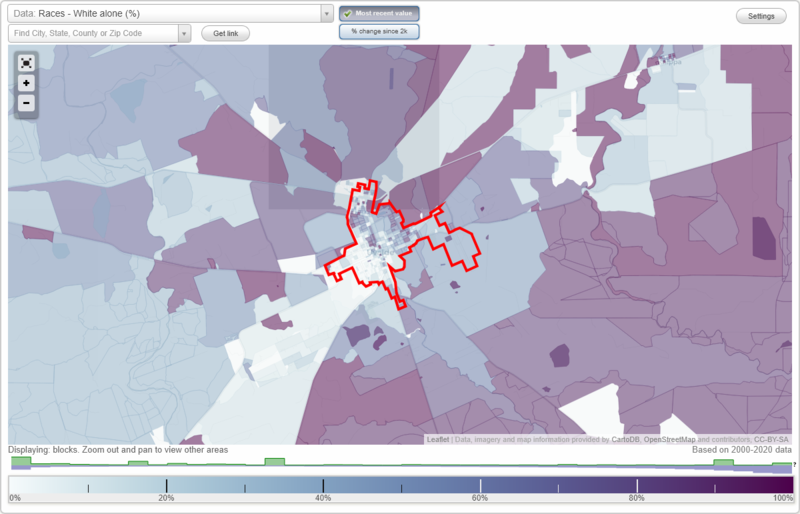
Races - White alone (%)
Races - White alone (% change since 2000)
Races - Black alone (%)
Races - Black alone (% change since 2000)
Races - American Indian alone (%)
Races - American Indian alone (% change since 2000)
Races - Asian alone (%)
Races - Asian alone (% change since 2000)
Races - Hispanic (%)
Races - Hispanic (% change since 2000)
Races - Native Hawaiian and Other Pacific Islander alone (%)
Races - Native Hawaiian and Other Pacific Islander alone (% change since 2000)
Races - Two or more races(%)
Races - Two or more races(% change since 2000)
Races - Other race alone (%)
Races - Other race alone (% change since 2000)
Racial diversity
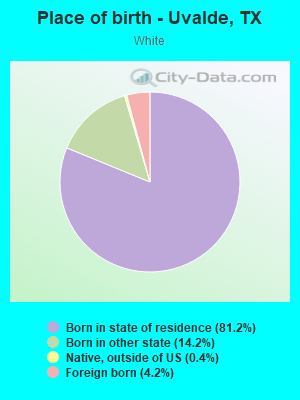
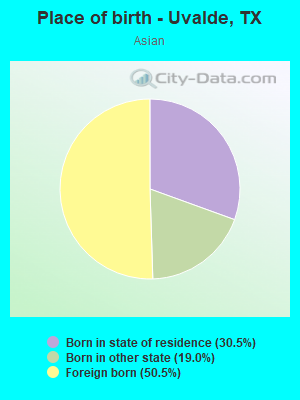
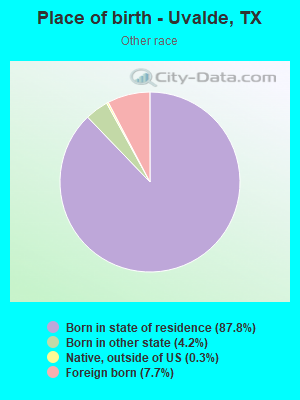
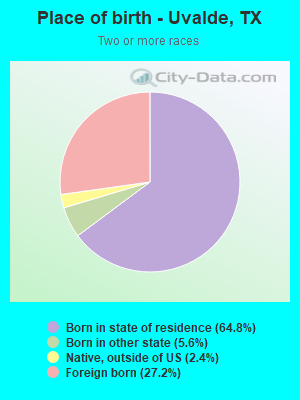
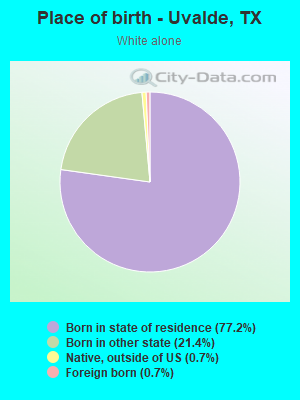
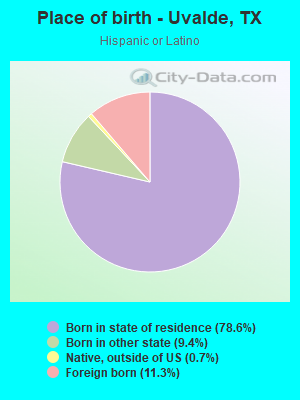
Place of birth - Born in state of residence (%)
Place of birth - Born in state of residence (%) - White
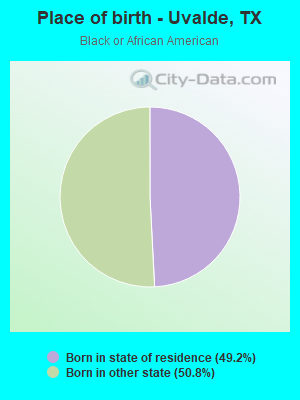
Place of birth - Born in state of residence (%) - Black or African American
Place of birth - Born in state of residence (%) - Asian
Place of birth - Born in state of residence (%) - Hispanic or Latino
Place of birth - Born in state of residence (%) - American Indian and Alaska Native
Place of birth - Born in state of residence (%) - Multirace
Place of birth - Born in state of residence (%) - Other Race
Place of birth - Born in other state (%)
Place of birth - Born in other state (%) - White
Place of birth - Born in other state (%) - Black or African American
Place of birth - Born in other state (%) - Asian
Place of birth - Born in other state (%) - Hispanic or Latino
Place of birth - Born in other state (%) - American Indian and Alaska Native
Place of birth - Born in other state (%) - Multirace
Place of birth - Born in other state (%) - Other Race
Place of birth - Native, outside of US (%)
Place of birth - Native, outside of US (%) - White
Place of birth - Native, outside of US (%) - Black or African American
Place of birth - Native, outside of US (%) - Asian
Place of birth - Native, outside of US (%) - Hispanic or Latino
Place of birth - Native, outside of US (%) - American Indian and Alaska Native
Place of birth - Native, outside of US (%) - Multirace
Place of birth - Native, outside of US (%) - Other Race
Place of birth - Foreign born (%)
Place of birth - Foreign born (%) - White
Place of birth - Foreign born (%) - Black or African American
Place of birth - Foreign born (%) - Asian
Place of birth - Foreign born (%) - Hispanic or Latino
Place of birth - Foreign born (%) - American Indian and Alaska Native
Place of birth - Foreign born (%) - Multirace
Place of birth - Foreign born (%) - Other Race
Residents speaking English at home (%)
Residents speaking English at home - Born in the United States (%)
Residents speaking English at home - Native, born elsewhere (%)
Residents speaking English at home - Foreign born (%)
Residents speaking Spanish at home (%)
Residents speaking Spanish at home - Born in the United States (%)
Residents speaking Spanish at home - Native, born elsewhere (%)
Residents speaking Spanish at home - Foreign born (%)
Residents speaking other language at home (%)
Residents speaking other language at home - Born in the United States (%)
Residents speaking other language at home - Native, born elsewhere (%)
Residents speaking other language at home - Foreign born (%)
Marital status - Never married (%)
Marital status - Now married (%)
Marital status - Separated (%)
Marital status - Widowed (%)
Marital status - Divorced (%)
Ancestries Reported - Arab (%)
Ancestries Reported - Czech (%)
Ancestries Reported - Danish (%)
Ancestries Reported - Dutch (%)
Ancestries Reported - English (%)
Ancestries Reported - French (%)
Ancestries Reported - French Canadian (%)
Ancestries Reported - German (%)
Ancestries Reported - Greek (%)
Ancestries Reported - Hungarian (%)
Ancestries Reported - Irish (%)
Ancestries Reported - Italian (%)
Ancestries Reported - Lithuanian (%)
Ancestries Reported - Norwegian (%)
Ancestries Reported - Polish (%)
Ancestries Reported - Portuguese (%)
Ancestries Reported - Russian (%)
Ancestries Reported - Scotch-Irish (%)
Ancestries Reported - Scottish (%)
Ancestries Reported - Slovak (%)
Ancestries Reported - Subsaharan African (%)
Ancestries Reported - Swedish (%)
Ancestries Reported - Swiss (%)
Ancestries Reported - Ukrainian (%)
Ancestries Reported - United States (%)
Ancestries Reported - Welsh (%)
Ancestries Reported - West Indian (%)
Ancestries Reported - Other (%)
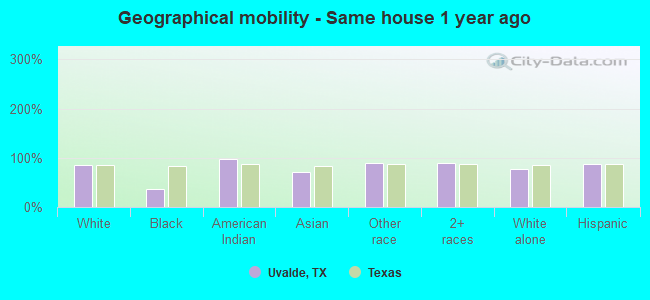
Geographical mobility - Same house 1 year ago (%)
Geographical mobility - Same house 1 year ago (%) - White
Geographical mobility - Same house 1 year ago (%) - Black or African American
Geographical mobility - Same house 1 year ago (%) - Asian
Geographical mobility - Same house 1 year ago (%) - Hispanic or Latino
Geographical mobility - Same house 1 year ago (%) - American Indian and Alaska Native
Geographical mobility - Same house 1 year ago (%) - Multirace
Geographical mobility - Same house 1 year ago (%) - Other Race
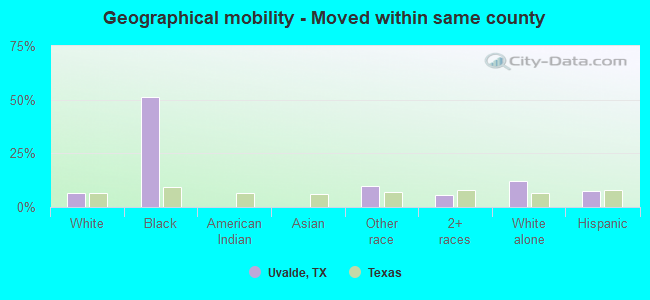
Geographical mobility - Moved within same county (%)
Geographical mobility - Moved within same county (%) - White
Geographical mobility - Moved within same county (%) - Black or African American
Geographical mobility - Moved within same county (%) - Asian
Geographical mobility - Moved within same county (%) - Hispanic or Latino
Geographical mobility - Moved within same county (%) - American Indian and Alaska Native
Geographical mobility - Moved within same county (%) - Multirace
Geographical mobility - Moved within same county (%) - Other Race
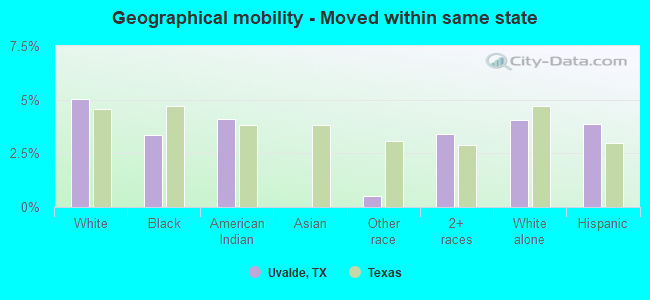
Geographical mobility - Moved from different county within same state (%)
Geographical mobility - Moved from different county within same state (%) - White
Geographical mobility - Moved from different county within same state (%) - Black or African American
Geographical mobility - Moved from different county within same state (%) - Asian
Geographical mobility - Moved from different county within same state (%) - Hispanic or Latino
Geographical mobility - Moved from different county within same state (%) - American Indian and Alaska Native
Geographical mobility - Moved from different county within same state (%) - Multirace
Geographical mobility - Moved from different county within same state (%) - Other Race
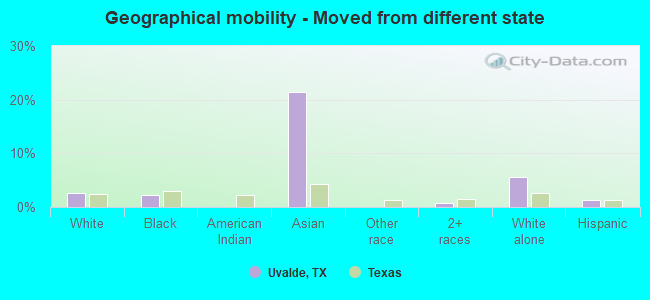
Geographical mobility - Moved from different state (%)
Geographical mobility - Moved from different state (%) - White
Geographical mobility - Moved from different state (%) - Black or African American
Geographical mobility - Moved from different state (%) - Asian
Geographical mobility - Moved from different state (%) - Hispanic or Latino
Geographical mobility - Moved from different state (%) - American Indian and Alaska Native
Geographical mobility - Moved from different state (%) - Multirace
Geographical mobility - Moved from different state (%) - Other Race
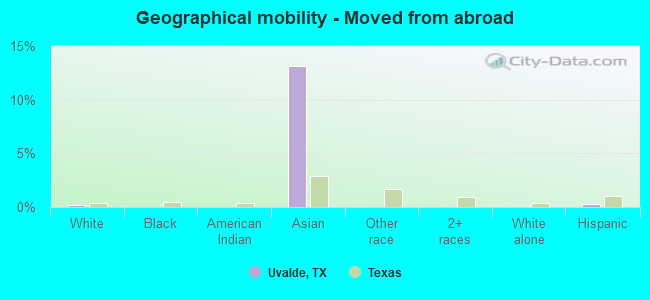
Geographical mobility - Moved from abroad (%)
Geographical mobility - Moved from abroad (%) - White
Geographical mobility - Moved from abroad (%) - Black or African American
Geographical mobility - Moved from abroad (%) - Asian
Geographical mobility - Moved from abroad (%) - Hispanic or Latino
Geographical mobility - Moved from abroad (%) - American Indian and Alaska Native
Geographical mobility - Moved from abroad (%) - Multirace
Geographical mobility - Moved from abroad (%) - Other Race
Place of birth for the foreign-born population - Ireland (%)
Place of birth for the foreign-born population - Denmark (%)
Place of birth for the foreign-born population - Norway (%)
Place of birth for the foreign-born population - Sweden (%)
Place of birth for the foreign-born population - United Kingdom (%)
Place of birth for the foreign-born population - England (%)
Place of birth for the foreign-born population - Scotland (%)
Place of birth for the foreign-born population - Other Northern Europe (%)
Place of birth for the foreign-born population - Austria (%)
Place of birth for the foreign-born population - Belgium (%)
Place of birth for the foreign-born population - France (%)
Place of birth for the foreign-born population - Germany (%)
Place of birth for the foreign-born population - Netherlands (%)
Place of birth for the foreign-born population - Switzerland (%)
Place of birth for the foreign-born population - Other Western Europe (%)
Place of birth for the foreign-born population - Greece (%)
Place of birth for the foreign-born population - Italy (%)
Place of birth for the foreign-born population - Portugal (%)
Place of birth for the foreign-born population - Spain (%)
Place of birth for the foreign-born population - Other Southern Europe (%)
Place of birth for the foreign-born population - Albania (%)
Place of birth for the foreign-born population - Belarus (%)
Place of birth for the foreign-born population - Bosnia and Herzegovina (%)
Place of birth for the foreign-born population - Bulgaria (%)
Place of birth for the foreign-born population - Croatia (%)
Place of birth for the foreign-born population - Czechoslovakia (%)
Place of birth for the foreign-born population - Hungary (%)
Place of birth for the foreign-born population - Latvia (%)
Place of birth for the foreign-born population - Lithuania (%)
Place of birth for the foreign-born population - North Macedonia (Macedonia) (%)
Place of birth for the foreign-born population - Moldova (%)
Place of birth for the foreign-born population - Poland (%)
Place of birth for the foreign-born population - Romania (%)
Place of birth for the foreign-born population - Russia (%)
Place of birth for the foreign-born population - Serbia (%)
Place of birth for the foreign-born population - Ukraine (%)
Place of birth for the foreign-born population - Other Eastern Europe (%)
Place of birth for the foreign-born population - China (%)
Place of birth for the foreign-born population - Hong Kong (%)
Place of birth for the foreign-born population - Taiwan (%)
Place of birth for the foreign-born population - Japan (%)
Place of birth for the foreign-born population - Korea (%)
Place of birth for the foreign-born population - Other Eastern Asia (%)
Place of birth for the foreign-born population - Afghanistan (%)
Place of birth for the foreign-born population - Bangladesh (%)
Place of birth for the foreign-born population - India (%)
Place of birth for the foreign-born population - Iran (%)
Place of birth for the foreign-born population - Kazakhstan (%)
Place of birth for the foreign-born population - Nepal (%)
Place of birth for the foreign-born population - Pakistan (%)
Place of birth for the foreign-born population - Sri Lanka (%)
Place of birth for the foreign-born population - Uzbekistan (%)
Place of birth for the foreign-born population - Other South Central Asia (%)
Place of birth for the foreign-born population - Burma (%)
Place of birth for the foreign-born population - Cambodia (%)
Place of birth for the foreign-born population - Indonesia (%)
Place of birth for the foreign-born population - Laos (%)
Place of birth for the foreign-born population - Malaysia (%)
Place of birth for the foreign-born population - Philippines (%)
Place of birth for the foreign-born population - Singapore (%)
Place of birth for the foreign-born population - Thailand (%)
Place of birth for the foreign-born population - Vietnam (%)
Place of birth for the foreign-born population - Other South Eastern Asia (%)
Place of birth for the foreign-born population - Armenia (%)
Place of birth for the foreign-born population - Iraq (%)
Place of birth for the foreign-born population - Israel (%)
Place of birth for the foreign-born population - Jordan (%)
Place of birth for the foreign-born population - Kuwait (%)
Place of birth for the foreign-born population - Lebanon (%)
Place of birth for the foreign-born population - Saudi Arabia (%)
Place of birth for the foreign-born population - Syria (%)
Place of birth for the foreign-born population - Turkey (%)
Place of birth for the foreign-born population - Yemen (%)
Place of birth for the foreign-born population - Other Western Asia (%)
Place of birth for the foreign-born population - Eritrea (%)
Place of birth for the foreign-born population - Ethiopia (%)
Place of birth for the foreign-born population - Kenya (%)
Place of birth for the foreign-born population - Somalia (%)
Place of birth for the foreign-born population - Uganda (%)
Place of birth for the foreign-born population - Zimbabwe (%)
Place of birth for the foreign-born population - Other Eastern Africa (%)
Place of birth for the foreign-born population - Cameroon (%)
Place of birth for the foreign-born population - Congo (%)
Place of birth for the foreign-born population - Democratic Republic of Congo (Zaire) (%)
Place of birth for the foreign-born population - Other Middle Africa (%)
Place of birth for the foreign-born population - Egypt (%)
Place of birth for the foreign-born population - Morocco (%)
Place of birth for the foreign-born population - Sudan (%)
Place of birth for the foreign-born population - Other Northern Africa (%)
Place of birth for the foreign-born population - South Africa (%)
Place of birth for the foreign-born population - Other Southern Africa (%)
Place of birth for the foreign-born population - Cabo Verde (%)
Place of birth for the foreign-born population - Ghana (%)
Place of birth for the foreign-born population - Liberia (%)
Place of birth for the foreign-born population - Nigeria (%)
Place of birth for the foreign-born population - Senegal (%)
Place of birth for the foreign-born population - Sierra Leone (%)
Place of birth for the foreign-born population - Other Western Africa (%)
Place of birth for the foreign-born population - Australia (%)
Place of birth for the foreign-born population - New Zealand (%)
Place of birth for the foreign-born population - Fiji (%)
Place of birth for the foreign-born population - Micronesia (%)
Place of birth for the foreign-born population - Bahamas (%)
Place of birth for the foreign-born population - Barbados (%)
Place of birth for the foreign-born population - Cuba (%)
Place of birth for the foreign-born population - Dominica (%)
Place of birth for the foreign-born population - Dominican Republic (%)
Place of birth for the foreign-born population - Grenada (%)
Place of birth for the foreign-born population - Haiti (%)
Place of birth for the foreign-born population - Jamaica (%)
Place of birth for the foreign-born population - St. Vincent and the Grenadines (%)
Place of birth for the foreign-born population - Trinidad and Tobago (%)
Place of birth for the foreign-born population - West Indies (%)
Place of birth for the foreign-born population - Other Caribbean (%)
Place of birth for the foreign-born population - Belize (%)
Place of birth for the foreign-born population - Costa Rica (%)
Place of birth for the foreign-born population - El Salvador (%)
Place of birth for the foreign-born population - Guatemala (%)
Place of birth for the foreign-born population - Honduras (%)
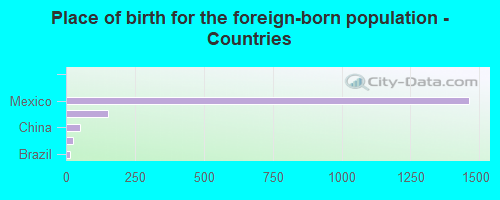
Place of birth for the foreign-born population - Mexico (%)
Place of birth for the foreign-born population - Nicaragua (%)
Place of birth for the foreign-born population - Panama (%)
Place of birth for the foreign-born population - Other Central America (%)
Place of birth for the foreign-born population - Argentina (%)
Place of birth for the foreign-born population - Bolivia (%)
Place of birth for the foreign-born population - Brazil (%)
Place of birth for the foreign-born population - Chile (%)
Place of birth for the foreign-born population - Colombia (%)
Place of birth for the foreign-born population - Ecuador (%)
Place of birth for the foreign-born population - Guyana (%)
Place of birth for the foreign-born population - Peru (%)
Place of birth for the foreign-born population - Uruguay (%)
Place of birth for the foreign-born population - Venezuela (%)
Place of birth for the foreign-born population - Other South America (%)
Place of birth for the foreign-born population - Canada (%)
Place of birth for the foreign-born population - Other Northern America (%)
Place of birth for the foreign-born population - Other (%)
Latest news about races in Uvalde, TX collected exclusively by city-data.com from local newspapers, TV, and radio stations
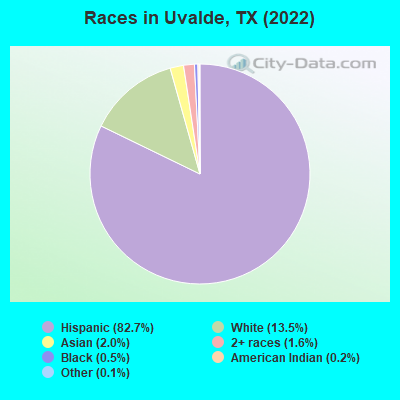
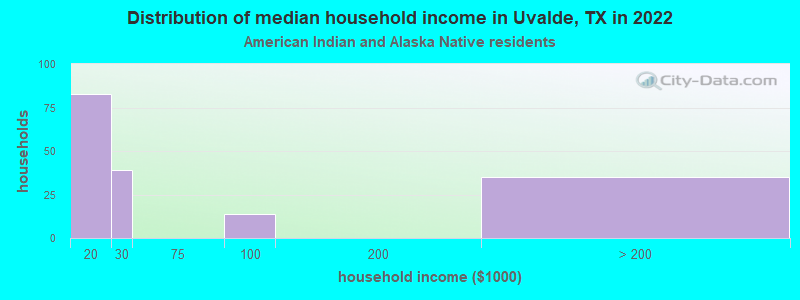
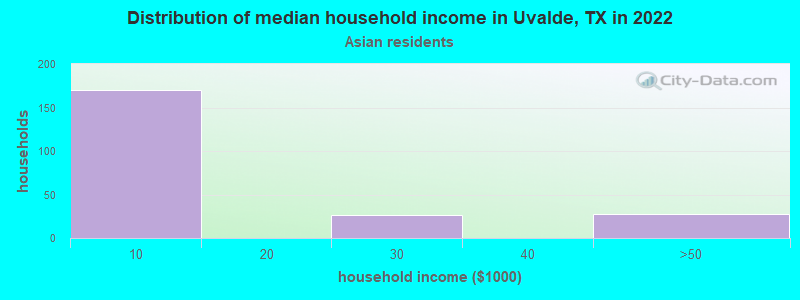
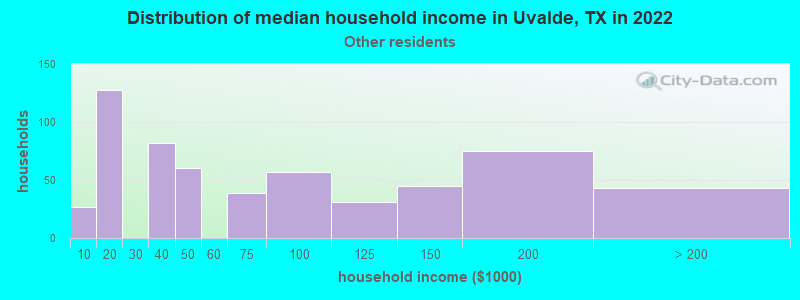
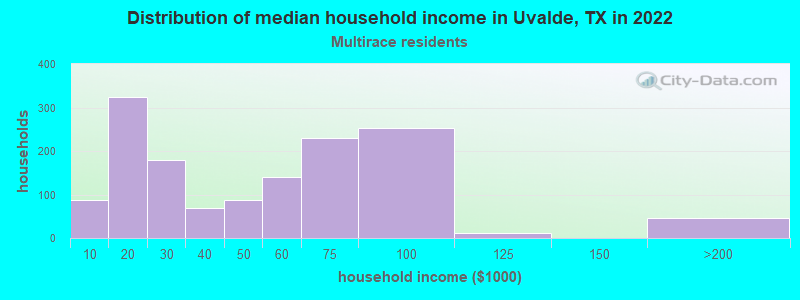
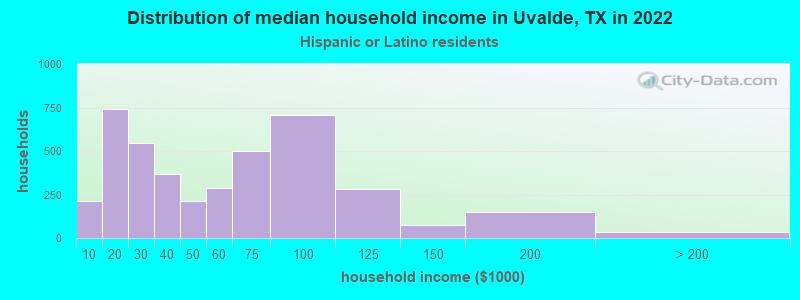
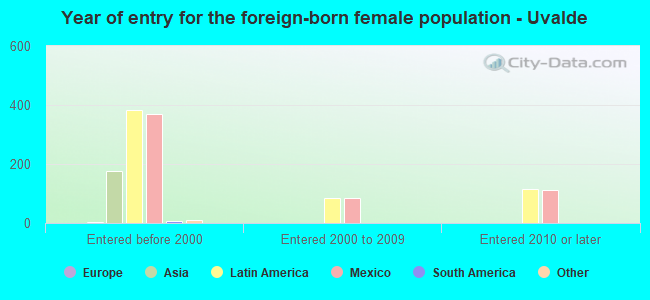
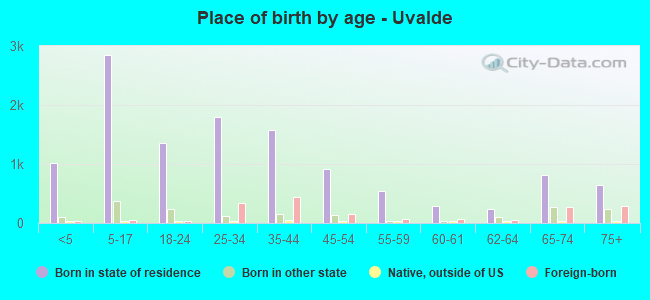
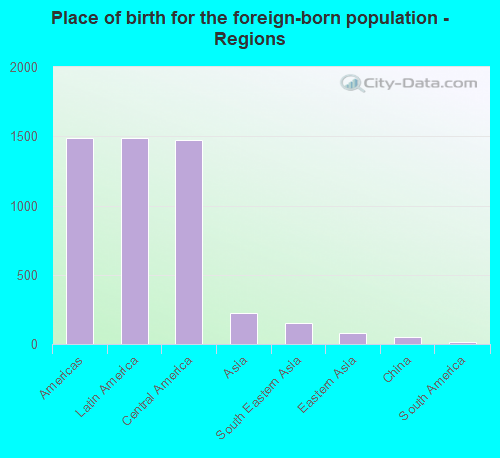
According to 2022 data, the most numerous races in Uvalde, TX are Hispanic (13,023 residents), White alone (2,121 residents), and Black alone (82 residents). 47.6% of Uvalde residents speak English at home. 11.0% of Uvalde, TX residents are foreign-born (9.4% born in Latin America, 1.4% born in Asia), which is 54.7% less than the foreign-born rate of 17.0% across the entire state of Texas.
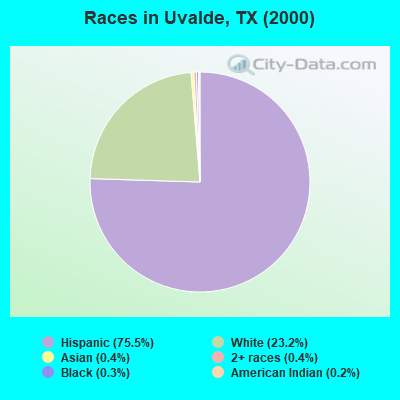
Race distribution in Uvalde
2000 2022
10,933,313 52.4% White alone 6,669,666 32.0% Hispanic 2,364,255 11.3% Black alone 554,445 2.7% Asian alone 230,567 1.1% Two or more races 68,859 0.3% American Indian alone 19,958 0.10% Other race alone 10,757 0.05% Native Hawaiian and Other
12,070,642 40.2% Hispanic 11,683,430 38.9% White alone 3,508,706 11.7% Black alone 1,608,173 5.4% Asian alone 956,560 3.2% Two or more races 125,763 0.4% Other race alone 47,023 0.2% American Indian alone 29,275 0.10% Native Hawaiian and Other
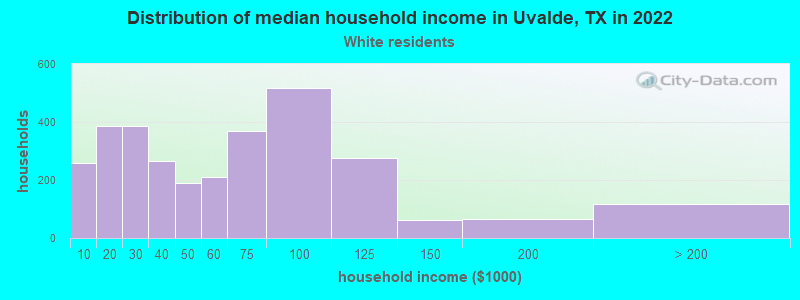
Income and house value in Uvalde Median household income in 2022 $52,002 White non-Hispanic householders$2,506 Asian householders$43,183 Two or more races householders$43,818 Hispanic or Latino race householdersMedian 2022 house value $257,454 White Non-Hispanic householders$334,399 Black or African American householders$118,516 American Indian or Alaska Native householders $118,516 Asian householders$111,223 Some other race householders$143,678 Two or more races householders$126,539 Hispanic or Latino householders
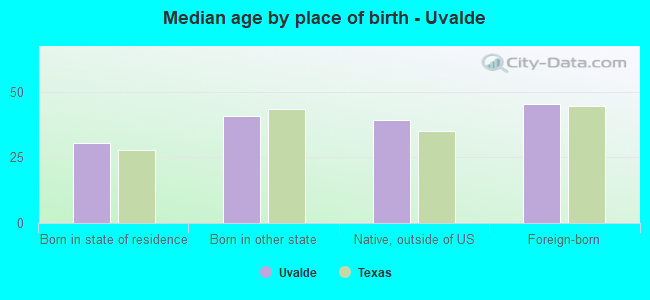
Median age by race in Uvalde
31.5 Median age for White residents29.6 33.2 15.8 Median age for Black or African American residents15.8 -676,245,210.1 58.8 Median age for American Indian / Alaska Native residents58.5 -684,418,145.3 28.3 Median age for Asian residents-683,426,442.5 28.3 -581,560,283.1 Median age for Native Hawaiian / Pacific Islander residents-612,729,233.5 -577,777,777.2 35.1 Median age for Other race residents18.1 36.9 44.8 Median age for Two or more races residents44.5 54.8 48.4 Median age for White alone residents43.6 59.6 30.8 Median age for Hispanic or Latino residents29.1 32.1
Owner/renter occupied households by race in Uvalde
House owners and renters - White residents 1,777 56.8% Owner occupied1,351 43.2% Renter occupiedHouse owners and renters - Black or African American residents 60 100.0% Renter occupiedHouse owners and renters - American Indian / Alaska Native residents 173 100.0% Owner occupiedHouse owners and renters - Asian residents 198 88.3% Owner occupied26 11.7% Renter occupiedHouse owners and renters - Other race residents 495 83.3% Owner occupied99 16.7% Renter occupiedHouse owners and renters - Two or more races residents 1,072 74.8% Owner occupied361 25.2% Renter occupiedHouse owners and renters - White alone residents 633 69.3% Owner occupied280 30.7% Renter occupiedHouse owners and renters - Hispanic or Latino residents 2,517 60.5% Owner occupied1,645 39.5% Renter occupied
Language usage in Uvalde
English speakers - Total 47.6% of residents of Uvalde speak English at home.
50.4% of residents speak Spanish at home 5,044 68.4% Speak English very well2,334 31.6% Speak English less than very well1.6% of residents speak other language at home 183 75.9% Speak English very well58 24.1% Speak English less than very well
English speakers - Born in the United States 60.1% of residents of Uvalde speak English at home.
38.9% of residents speak Spanish at home 410 62.6% Speak English very well245 37.4% Speak English less than very well0.7% of residents speak other language at home 11 100.0% Speak English very well
English speakers - Native, born elsewhere 20.0% of residents of Uvalde speak English at home.
75.5% of residents speak Spanish at home 83 100.0% Speak English less than very well
English speakers - Foreign-born 8.0% of residents of Uvalde speak English at home.
78.3% of residents speak Spanish at home 393 29.0% Speak English very well962 71.0% Speak English less than very well13.2% of residents speak other language at home 172 75.1% Speak English very well57 24.9% Speak English less than very well
White (Caucasian) - Speak only English Native:
59.4% (4,735)Foreign-born:
2.4% (9)
White (Caucasian) - Speak another language Native:
26.7% (2,126)Foreign-born:
87.1% (320)
Asian - Speak only English Native:
64.7% (154)Foreign-born:
11.7% (28)
Asian - Speak another language Native:
35.7% (85)Foreign-born:
88.2% (208)
Other race - Speak only English Native:
56.2% (1,027)Foreign-born:
11.5% (18)
Other race - Speak another language Native:
45.2% (826)Foreign-born:
89.0% (142)
Two or more races - Speak only English Native:
34.4% (799)Foreign-born:
15.1% (137)
Two or more races - Speak another language Native:
67.6% (1,567)Foreign-born:
84.3% (761)
White alone - Speak only English Native:
92.1% (1,819)Foreign-born:
73.5% (11)
White alone - Speak another language Native:
7.6% (150)Foreign-born:
26.6% (4)
Hispanic or Latino - Speak only English Native:
45.1% (4,776)Foreign-born:
7.4% (108)
Hispanic or Latino - Speak another language Native:
55.0% (5,824)Foreign-born:
92.8% (1,360)
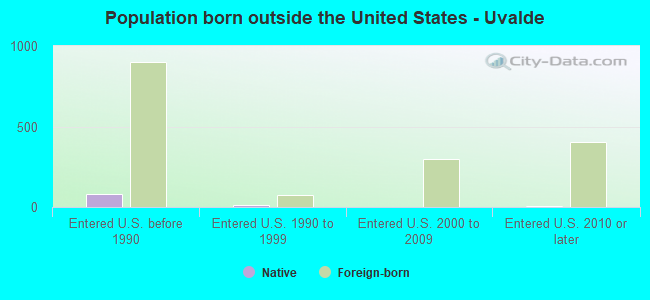
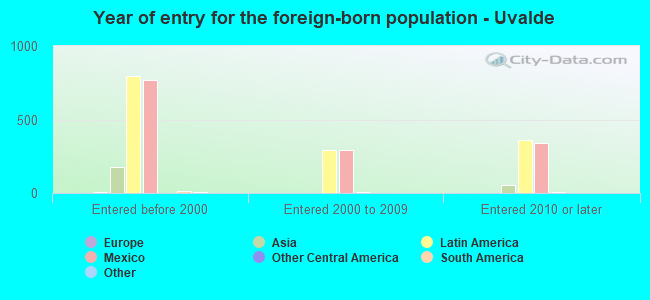
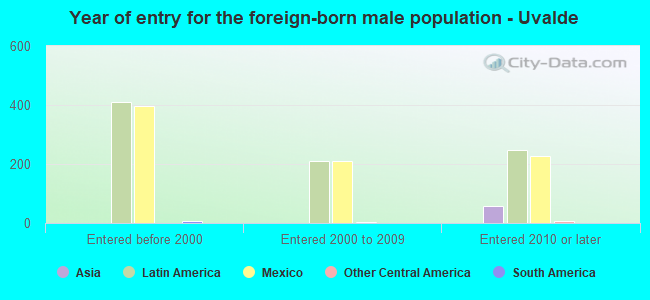
Foreign-born residents in Uvalde 1,731 residents are foreign born (9.4% Latin America , 1.4% Asia ).
This city:
11.0%Texas:
17.1%
Marital status for residents in Uvalde Marital status - White (Caucasian) population 15 years and over
Males 44.2% Never married41.9% Now married2.0% Separated1.1% Widowed10.7% DivorcedFemales 30.1% Never married37.3% Now married6.6% Separated8.5% Widowed17.5% DivorcedWomen who gave birth in the past 12 months Now married:
60.2% (174)Unmarried:
39.8% (115)
Women who did not give birth in the past 12 months Now married:
38.9% (760)Unmarried:
61.1% (1,194)
Marital status - American Indian / Alaska Native population 15 years and over
Males 20.5% Never married32.6% Now married5.3% Separated0.0% Widowed41.7% DivorcedFemales 0.0% Never married100.0% Now married0.0% Separated0.0% Widowed0.0% DivorcedMarital status - Asian population 15 years and over
Males 51.0% Never married49.0% Now married0.0% Separated0.0% Widowed0.0% DivorcedFemales 30.5% Never married10.2% Now married59.3% Separated0.0% Widowed0.0% DivorcedWomen who did not give birth in the past 12 months Now married:
66.1% (157)Unmarried:
33.9% (81)
Marital status - Other race population 15 years and over
Males 19.2% Never married62.9% Now married1.8% Separated0.0% Widowed16.0% DivorcedFemales 30.1% Never married50.9% Now married2.4% Separated8.6% Widowed7.9% DivorcedWomen who did not give birth in the past 12 months Now married:
45.7% (173)Unmarried:
54.3% (206)
Marital status - Two or more races population 15 years and over
Males 42.7% Never married38.9% Now married11.9% Separated3.6% Widowed3.0% DivorcedFemales 12.7% Never married54.7% Now married0.0% Separated11.4% Widowed21.3% DivorcedWomen who did not give birth in the past 12 months Now married:
45.8% (231)Unmarried:
54.2% (274)
Marital status - White alone, not Hispanic / Latino population 15 years and over
Males 36.0% Never married47.9% Now married6.4% Separated1.1% Widowed8.5% DivorcedFemales 20.3% Never married42.0% Now married9.6% Separated17.3% Widowed10.8% DivorcedWomen who gave birth in the past 12 months Now married:
16.0% (4)Unmarried:
84.0% (21)
Women who did not give birth in the past 12 months Now married:
46.9% (151)Unmarried:
53.1% (171)
Marital status - Hispanic or Latino population 15 years and over
Males 44.7% Never married39.8% Now married3.4% Separated1.5% Widowed10.6% DivorcedFemales 30.2% Never married40.4% Now married4.6% Separated6.8% Widowed18.1% DivorcedWomen who gave birth in the past 12 months Now married:
63.6% (219)Unmarried:
36.4% (126)
Women who did not give birth in the past 12 months Now married:
38.6% (1,050)Unmarried:
61.4% (1,667)
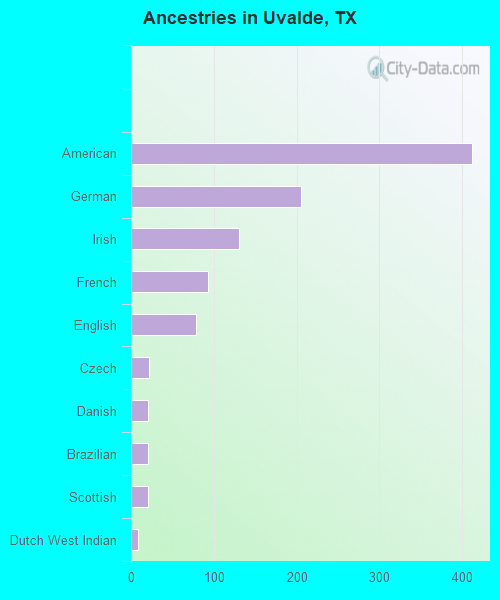
Ancestries in Uvalde
412 3.8% American206 1.9% German131 1.2% Irish93 0.9% French78 0.7% English22 0.2% Czech21 0.2% Danish20 0.2% Brazilian20 0.2% Scottish8 0.07% Dutch West Indian3 0.03% African
Children Nativity (place of birth) in Uvalde
Children under 6 years - Living with two parents Both parents native 269 100.0% NativeOne native, one foreign-born parent 132 100.0% NativeChildren under 6 years - Living with one parent Native parent 736 100.0% NativeForeign-born parent 113 100.0% NativeChildren 6 to 17 years - Living with two parents Both parents native 1,100 100.0% Native0 0.0% Foreign-bornBoth parents foreign-born 170 91.9% Native15 8.1% Foreign-bornOne native, one foreign-born parent 70 100.0% NativeChildren 6 to 17 years - Living with one parent Native parent 907 100.0% NativeForeign-born parent 245 53.2% Native215 46.8% Foreign-born
Grandparents responsible for own grandchildren in Uvalde
Grandparents (30 to 59 years) White / Caucasian 37 28.1% Responsible for grandchildren96 71.9% Not responsible for grandchildrenOther race 202 96.7% Responsible for grandchildren7 3.3% Not responsible for grandchildrenTwo or more races 114 100.0% Responsible for grandchildrenWhite alone, not Hispanic / Latino 6 100.0% Not responsible for grandchildrenHispanic or Latino 286 66.3% Responsible for grandchildren145 33.7% Not responsible for grandchildrenGrandparents (60 years and over) White / Caucasian 25 20.6% Responsible for grandchildren95 79.4% Not responsible for grandchildrenOther race 68 100.0% Not responsible for grandchildrenTwo or more races 15 100.0% Not responsible for grandchildrenWhite alone, not Hispanic / Latino 4 42.2% Responsible for grandchildren5 57.8% Not responsible for grandchildrenHispanic or Latino 29 12.8% Responsible for grandchildren196 87.2% Not responsible for grandchildren