Races in Val Verde, California (CA) Detailed Stats
Data:
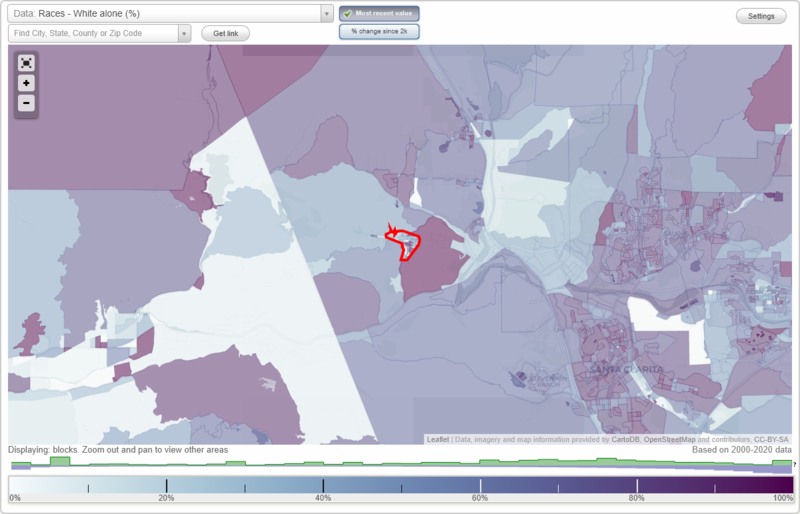
Races - White alone (%)
Races - White alone (% change since 2000)
Races - Black alone (%)
Races - Black alone (% change since 2000)
Races - American Indian alone (%)
Races - American Indian alone (% change since 2000)
Races - Asian alone (%)
Races - Asian alone (% change since 2000)
Races - Hispanic (%)
Races - Hispanic (% change since 2000)
Races - Native Hawaiian and Other Pacific Islander alone (%)
Races - Native Hawaiian and Other Pacific Islander alone (% change since 2000)
Races - Two or more races(%)
Races - Two or more races(% change since 2000)
Races - Other race alone (%)
Races - Other race alone (% change since 2000)
Racial diversity
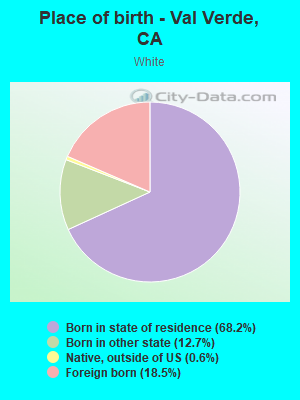
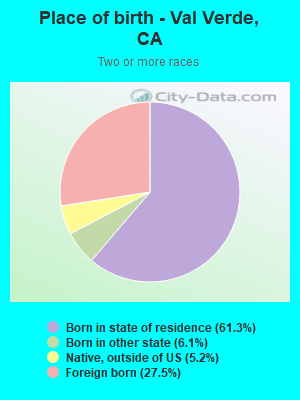
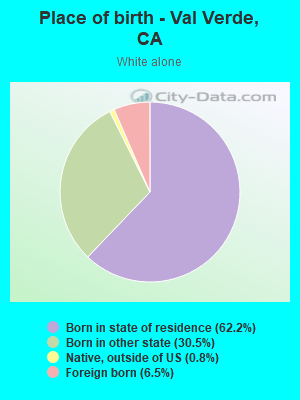
Place of birth - Born in state of residence (%)
Place of birth - Born in state of residence (%) - White
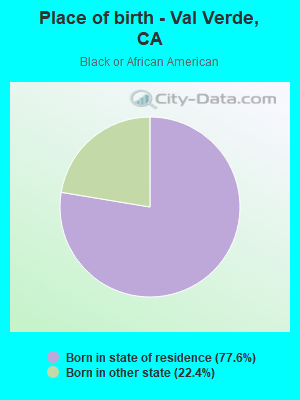
Place of birth - Born in state of residence (%) - Black or African American
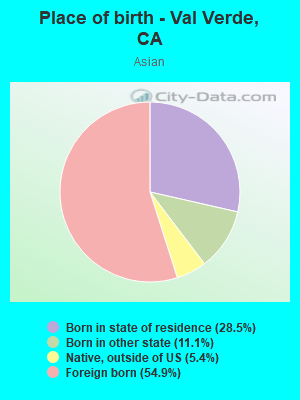
Place of birth - Born in state of residence (%) - Asian
Place of birth - Born in state of residence (%) - Hispanic or Latino
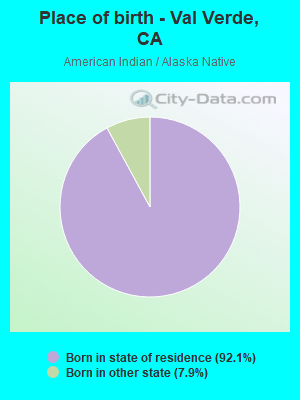
Place of birth - Born in state of residence (%) - American Indian and Alaska Native
Place of birth - Born in state of residence (%) - Multirace
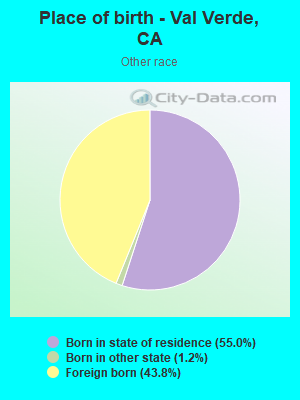
Place of birth - Born in state of residence (%) - Other Race
Place of birth - Born in other state (%)
Place of birth - Born in other state (%) - White
Place of birth - Born in other state (%) - Black or African American
Place of birth - Born in other state (%) - Asian
Place of birth - Born in other state (%) - Hispanic or Latino
Place of birth - Born in other state (%) - American Indian and Alaska Native
Place of birth - Born in other state (%) - Multirace
Place of birth - Born in other state (%) - Other Race
Place of birth - Native, outside of US (%)
Place of birth - Native, outside of US (%) - White
Place of birth - Native, outside of US (%) - Black or African American
Place of birth - Native, outside of US (%) - Asian
Place of birth - Native, outside of US (%) - Hispanic or Latino
Place of birth - Native, outside of US (%) - American Indian and Alaska Native
Place of birth - Native, outside of US (%) - Multirace
Place of birth - Native, outside of US (%) - Other Race
Place of birth - Foreign born (%)
Place of birth - Foreign born (%) - White
Place of birth - Foreign born (%) - Black or African American
Place of birth - Foreign born (%) - Asian
Place of birth - Foreign born (%) - Hispanic or Latino
Place of birth - Foreign born (%) - American Indian and Alaska Native
Place of birth - Foreign born (%) - Multirace
Place of birth - Foreign born (%) - Other Race
Residents speaking English at home (%)
Residents speaking English at home - Born in the United States (%)
Residents speaking English at home - Native, born elsewhere (%)
Residents speaking English at home - Foreign born (%)
Residents speaking Spanish at home (%)
Residents speaking Spanish at home - Born in the United States (%)
Residents speaking Spanish at home - Native, born elsewhere (%)
Residents speaking Spanish at home - Foreign born (%)
Residents speaking other language at home (%)
Residents speaking other language at home - Born in the United States (%)
Residents speaking other language at home - Native, born elsewhere (%)
Residents speaking other language at home - Foreign born (%)
Marital status - Never married (%)
Marital status - Now married (%)
Marital status - Separated (%)
Marital status - Widowed (%)
Marital status - Divorced (%)
Ancestries Reported - Arab (%)
Ancestries Reported - Czech (%)
Ancestries Reported - Danish (%)
Ancestries Reported - Dutch (%)
Ancestries Reported - English (%)
Ancestries Reported - French (%)
Ancestries Reported - French Canadian (%)
Ancestries Reported - German (%)
Ancestries Reported - Greek (%)
Ancestries Reported - Hungarian (%)
Ancestries Reported - Irish (%)
Ancestries Reported - Italian (%)
Ancestries Reported - Lithuanian (%)
Ancestries Reported - Norwegian (%)
Ancestries Reported - Polish (%)
Ancestries Reported - Portuguese (%)
Ancestries Reported - Russian (%)
Ancestries Reported - Scotch-Irish (%)
Ancestries Reported - Scottish (%)
Ancestries Reported - Slovak (%)
Ancestries Reported - Subsaharan African (%)
Ancestries Reported - Swedish (%)
Ancestries Reported - Swiss (%)
Ancestries Reported - Ukrainian (%)
Ancestries Reported - United States (%)
Ancestries Reported - Welsh (%)
Ancestries Reported - West Indian (%)
Ancestries Reported - Other (%)
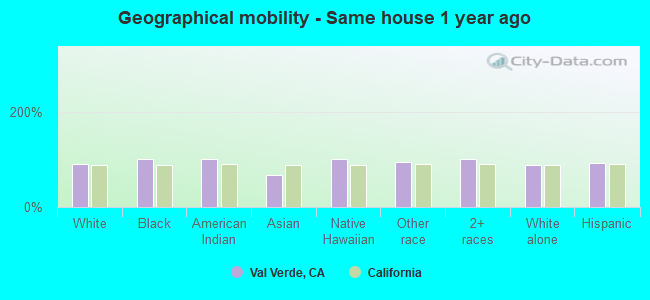
Geographical mobility - Same house 1 year ago (%)
Geographical mobility - Same house 1 year ago (%) - White
Geographical mobility - Same house 1 year ago (%) - Black or African American
Geographical mobility - Same house 1 year ago (%) - Asian
Geographical mobility - Same house 1 year ago (%) - Hispanic or Latino
Geographical mobility - Same house 1 year ago (%) - American Indian and Alaska Native
Geographical mobility - Same house 1 year ago (%) - Multirace
Geographical mobility - Same house 1 year ago (%) - Other Race
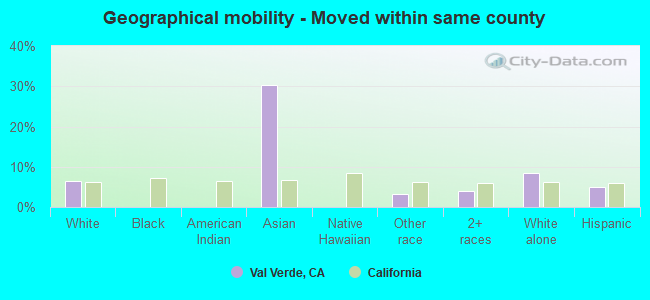
Geographical mobility - Moved within same county (%)
Geographical mobility - Moved within same county (%) - White
Geographical mobility - Moved within same county (%) - Black or African American
Geographical mobility - Moved within same county (%) - Asian
Geographical mobility - Moved within same county (%) - Hispanic or Latino
Geographical mobility - Moved within same county (%) - American Indian and Alaska Native
Geographical mobility - Moved within same county (%) - Multirace
Geographical mobility - Moved within same county (%) - Other Race
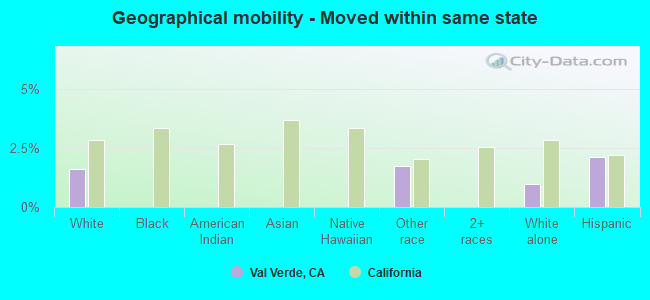
Geographical mobility - Moved from different county within same state (%)
Geographical mobility - Moved from different county within same state (%) - White
Geographical mobility - Moved from different county within same state (%) - Black or African American
Geographical mobility - Moved from different county within same state (%) - Asian
Geographical mobility - Moved from different county within same state (%) - Hispanic or Latino
Geographical mobility - Moved from different county within same state (%) - American Indian and Alaska Native
Geographical mobility - Moved from different county within same state (%) - Multirace
Geographical mobility - Moved from different county within same state (%) - Other Race
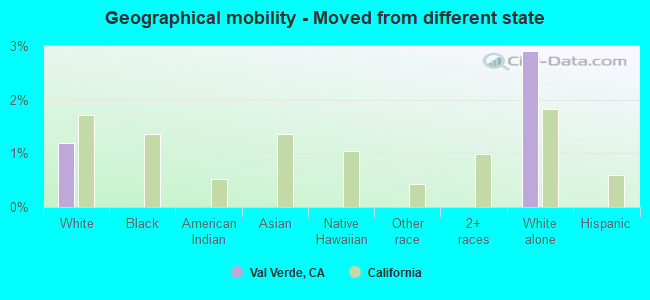
Geographical mobility - Moved from different state (%)
Geographical mobility - Moved from different state (%) - White
Geographical mobility - Moved from different state (%) - Black or African American
Geographical mobility - Moved from different state (%) - Asian
Geographical mobility - Moved from different state (%) - Hispanic or Latino
Geographical mobility - Moved from different state (%) - American Indian and Alaska Native
Geographical mobility - Moved from different state (%) - Multirace
Geographical mobility - Moved from different state (%) - Other Race
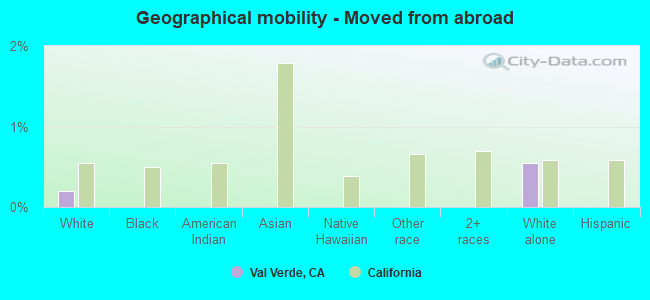
Geographical mobility - Moved from abroad (%)
Geographical mobility - Moved from abroad (%) - White
Geographical mobility - Moved from abroad (%) - Black or African American
Geographical mobility - Moved from abroad (%) - Asian
Geographical mobility - Moved from abroad (%) - Hispanic or Latino
Geographical mobility - Moved from abroad (%) - American Indian and Alaska Native
Geographical mobility - Moved from abroad (%) - Multirace
Geographical mobility - Moved from abroad (%) - Other Race
Place of birth for the foreign-born population - Ireland (%)
Place of birth for the foreign-born population - Denmark (%)
Place of birth for the foreign-born population - Norway (%)
Place of birth for the foreign-born population - Sweden (%)
Place of birth for the foreign-born population - United Kingdom (%)
Place of birth for the foreign-born population - England (%)
Place of birth for the foreign-born population - Scotland (%)
Place of birth for the foreign-born population - Other Northern Europe (%)
Place of birth for the foreign-born population - Austria (%)
Place of birth for the foreign-born population - Belgium (%)
Place of birth for the foreign-born population - France (%)
Place of birth for the foreign-born population - Germany (%)
Place of birth for the foreign-born population - Netherlands (%)
Place of birth for the foreign-born population - Switzerland (%)
Place of birth for the foreign-born population - Other Western Europe (%)
Place of birth for the foreign-born population - Greece (%)
Place of birth for the foreign-born population - Italy (%)
Place of birth for the foreign-born population - Portugal (%)
Place of birth for the foreign-born population - Spain (%)
Place of birth for the foreign-born population - Other Southern Europe (%)
Place of birth for the foreign-born population - Albania (%)
Place of birth for the foreign-born population - Belarus (%)
Place of birth for the foreign-born population - Bosnia and Herzegovina (%)
Place of birth for the foreign-born population - Bulgaria (%)
Place of birth for the foreign-born population - Croatia (%)
Place of birth for the foreign-born population - Czechoslovakia (%)
Place of birth for the foreign-born population - Hungary (%)
Place of birth for the foreign-born population - Latvia (%)
Place of birth for the foreign-born population - Lithuania (%)
Place of birth for the foreign-born population - North Macedonia (Macedonia) (%)
Place of birth for the foreign-born population - Moldova (%)
Place of birth for the foreign-born population - Poland (%)
Place of birth for the foreign-born population - Romania (%)
Place of birth for the foreign-born population - Russia (%)
Place of birth for the foreign-born population - Serbia (%)
Place of birth for the foreign-born population - Ukraine (%)
Place of birth for the foreign-born population - Other Eastern Europe (%)
Place of birth for the foreign-born population - China (%)
Place of birth for the foreign-born population - Hong Kong (%)
Place of birth for the foreign-born population - Taiwan (%)
Place of birth for the foreign-born population - Japan (%)
Place of birth for the foreign-born population - Korea (%)
Place of birth for the foreign-born population - Other Eastern Asia (%)
Place of birth for the foreign-born population - Afghanistan (%)
Place of birth for the foreign-born population - Bangladesh (%)
Place of birth for the foreign-born population - India (%)
Place of birth for the foreign-born population - Iran (%)
Place of birth for the foreign-born population - Kazakhstan (%)
Place of birth for the foreign-born population - Nepal (%)
Place of birth for the foreign-born population - Pakistan (%)
Place of birth for the foreign-born population - Sri Lanka (%)
Place of birth for the foreign-born population - Uzbekistan (%)
Place of birth for the foreign-born population - Other South Central Asia (%)
Place of birth for the foreign-born population - Burma (%)
Place of birth for the foreign-born population - Cambodia (%)
Place of birth for the foreign-born population - Indonesia (%)
Place of birth for the foreign-born population - Laos (%)
Place of birth for the foreign-born population - Malaysia (%)
Place of birth for the foreign-born population - Philippines (%)
Place of birth for the foreign-born population - Singapore (%)
Place of birth for the foreign-born population - Thailand (%)
Place of birth for the foreign-born population - Vietnam (%)
Place of birth for the foreign-born population - Other South Eastern Asia (%)
Place of birth for the foreign-born population - Armenia (%)
Place of birth for the foreign-born population - Iraq (%)
Place of birth for the foreign-born population - Israel (%)
Place of birth for the foreign-born population - Jordan (%)
Place of birth for the foreign-born population - Kuwait (%)
Place of birth for the foreign-born population - Lebanon (%)
Place of birth for the foreign-born population - Saudi Arabia (%)
Place of birth for the foreign-born population - Syria (%)
Place of birth for the foreign-born population - Turkey (%)
Place of birth for the foreign-born population - Yemen (%)
Place of birth for the foreign-born population - Other Western Asia (%)
Place of birth for the foreign-born population - Eritrea (%)
Place of birth for the foreign-born population - Ethiopia (%)
Place of birth for the foreign-born population - Kenya (%)
Place of birth for the foreign-born population - Somalia (%)
Place of birth for the foreign-born population - Uganda (%)
Place of birth for the foreign-born population - Zimbabwe (%)
Place of birth for the foreign-born population - Other Eastern Africa (%)
Place of birth for the foreign-born population - Cameroon (%)
Place of birth for the foreign-born population - Congo (%)
Place of birth for the foreign-born population - Democratic Republic of Congo (Zaire) (%)
Place of birth for the foreign-born population - Other Middle Africa (%)
Place of birth for the foreign-born population - Egypt (%)
Place of birth for the foreign-born population - Morocco (%)
Place of birth for the foreign-born population - Sudan (%)
Place of birth for the foreign-born population - Other Northern Africa (%)
Place of birth for the foreign-born population - South Africa (%)
Place of birth for the foreign-born population - Other Southern Africa (%)
Place of birth for the foreign-born population - Cabo Verde (%)
Place of birth for the foreign-born population - Ghana (%)
Place of birth for the foreign-born population - Liberia (%)
Place of birth for the foreign-born population - Nigeria (%)
Place of birth for the foreign-born population - Senegal (%)
Place of birth for the foreign-born population - Sierra Leone (%)
Place of birth for the foreign-born population - Other Western Africa (%)
Place of birth for the foreign-born population - Australia (%)
Place of birth for the foreign-born population - New Zealand (%)
Place of birth for the foreign-born population - Fiji (%)
Place of birth for the foreign-born population - Micronesia (%)
Place of birth for the foreign-born population - Bahamas (%)
Place of birth for the foreign-born population - Barbados (%)
Place of birth for the foreign-born population - Cuba (%)
Place of birth for the foreign-born population - Dominica (%)
Place of birth for the foreign-born population - Dominican Republic (%)
Place of birth for the foreign-born population - Grenada (%)
Place of birth for the foreign-born population - Haiti (%)
Place of birth for the foreign-born population - Jamaica (%)
Place of birth for the foreign-born population - St. Vincent and the Grenadines (%)
Place of birth for the foreign-born population - Trinidad and Tobago (%)
Place of birth for the foreign-born population - West Indies (%)
Place of birth for the foreign-born population - Other Caribbean (%)
Place of birth for the foreign-born population - Belize (%)
Place of birth for the foreign-born population - Costa Rica (%)
Place of birth for the foreign-born population - El Salvador (%)
Place of birth for the foreign-born population - Guatemala (%)
Place of birth for the foreign-born population - Honduras (%)
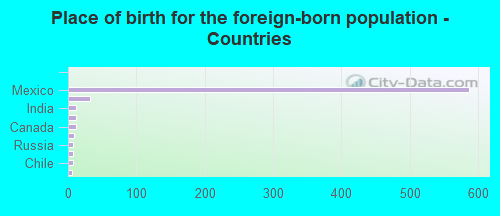
Place of birth for the foreign-born population - Mexico (%)
Place of birth for the foreign-born population - Nicaragua (%)
Place of birth for the foreign-born population - Panama (%)
Place of birth for the foreign-born population - Other Central America (%)
Place of birth for the foreign-born population - Argentina (%)
Place of birth for the foreign-born population - Bolivia (%)
Place of birth for the foreign-born population - Brazil (%)
Place of birth for the foreign-born population - Chile (%)
Place of birth for the foreign-born population - Colombia (%)
Place of birth for the foreign-born population - Ecuador (%)
Place of birth for the foreign-born population - Guyana (%)
Place of birth for the foreign-born population - Peru (%)
Place of birth for the foreign-born population - Uruguay (%)
Place of birth for the foreign-born population - Venezuela (%)
Place of birth for the foreign-born population - Other South America (%)
Place of birth for the foreign-born population - Canada (%)
Place of birth for the foreign-born population - Other Northern America (%)
Place of birth for the foreign-born population - Other (%)
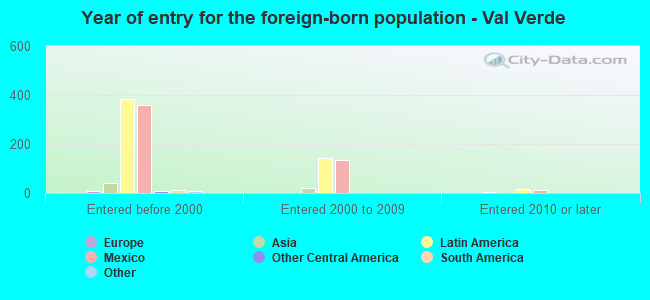
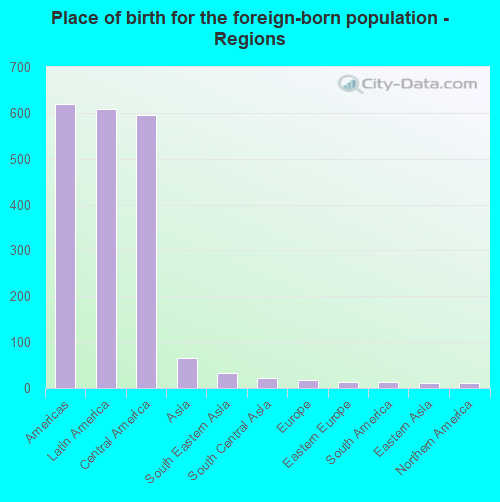
According to 2022 data, the most numerous races in Val Verde, CA are Hispanic (1,844 residents), White alone (680 residents), and Asian alone (99 residents). 49.3% of Val Verde residents speak English at home. 25.8% of Val Verde, CA residents are foreign-born (22.0% born in Latin America), which is about the same as the foreign-born rate of 26.0% across the entire state of California.
Race distribution in Val Verde
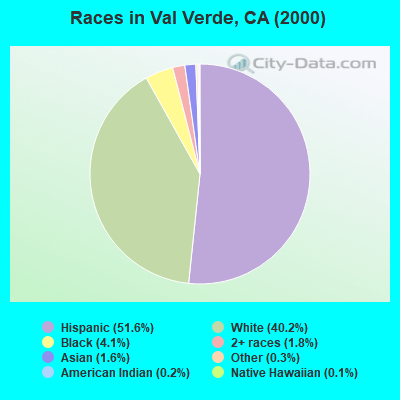
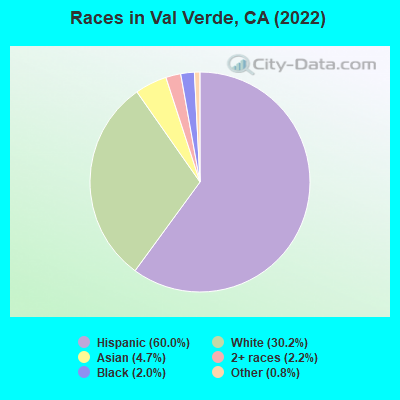
2000 2022
15,816,790 46.7% White alone 10,966,556 32.4% Hispanic 3,648,860 10.8% Asian alone 2,181,926 6.4% Black alone 903,115 2.7% Two or more races 178,984 0.5% American Indian alone 103,736 0.3% Native Hawaiian and Other 71,681 0.2% Other race alone
15,732,184 40.3% Hispanic 13,160,426 33.7% White alone 5,957,867 15.3% Asian alone 2,025,218 5.2% Black alone 1,663,222 4.3% Two or more races 251,618 0.6% Other race alone 135,777 0.3% Native Hawaiian and Other 103,030 0.3% American Indian alone
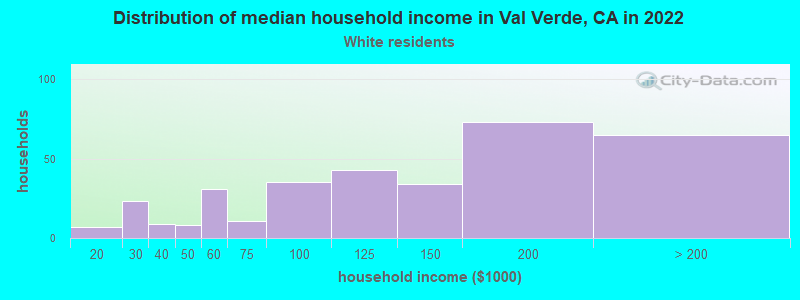
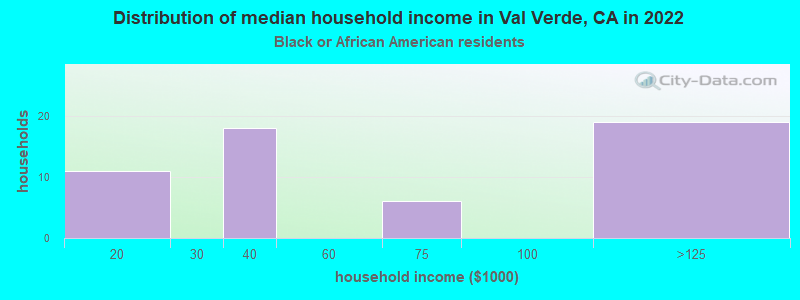
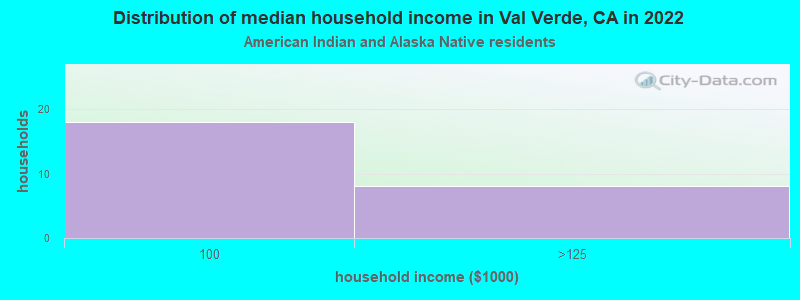
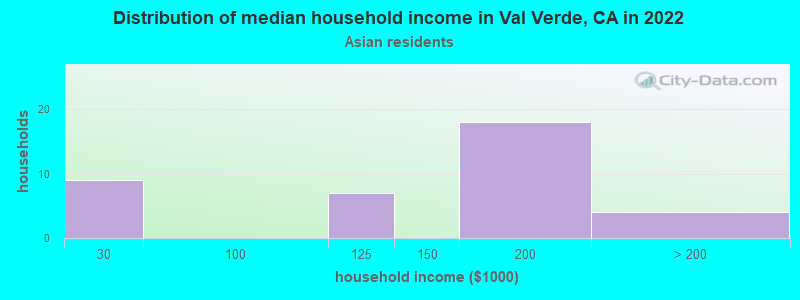
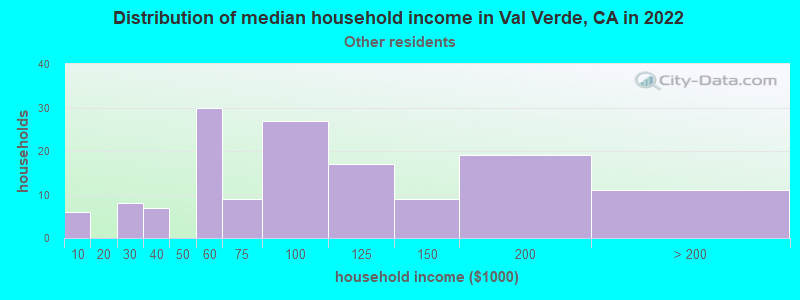
Income and house value in Val Verde Median household income in 2022 $116,394 White non-Hispanic householders$37,558 Black householdersover $200,000 Asian householders$139,845 Some other race householdersover $200,000 Two or more races householders$126,362 Hispanic or Latino race householdersMedian 2022 house value $569,768 White Non-Hispanic householders$341,933 Black or African American householders$552,132 Some other race householders$809,841 Two or more races householders$517,578 Hispanic or Latino householders
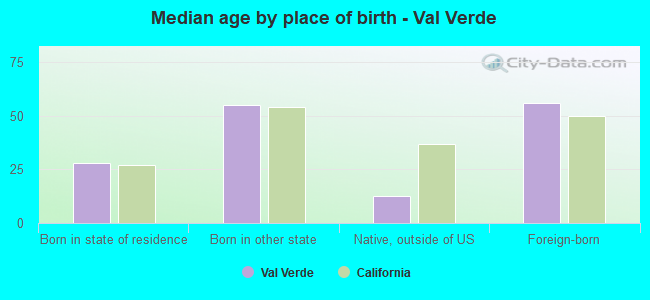
Median age by race in Val Verde
34.9 Median age for White residents34.7 35.8 28.7 Median age for Black or African American residents18.2 Median age for American Indian / Alaska Native residents33.5 Median age for Asian residents28.7 53.7 38.8 Median age for Other race residents38.4 43.8 29.6 Median age for Two or more races residents48.4 16.0 41.4 Median age for White alone residents45.2 40.5 30.9 Median age for Hispanic or Latino residents31.3 30.1
Owner/renter occupied households by race in Val Verde
House owners and renters - White residents 376 83.7% Owner occupied73 16.3% Renter occupiedHouse owners and renters - Black or African American residents 17 37.5% Owner occupied29 62.5% Renter occupiedHouse owners and renters - American Indian / Alaska Native residents 18 100.0% Owner occupiedHouse owners and renters - Asian residents 23 100.0% Owner occupiedHouse owners and renters - Other race residents 87 82.4% Owner occupied19 17.6% Renter occupiedHouse owners and renters - Two or more races residents 114 100.0% Owner occupiedHouse owners and renters - White alone residents 219 85.6% Owner occupied37 14.4% Renter occupiedHouse owners and renters - Hispanic or Latino residents 331 83.3% Owner occupied67 16.7% Renter occupied
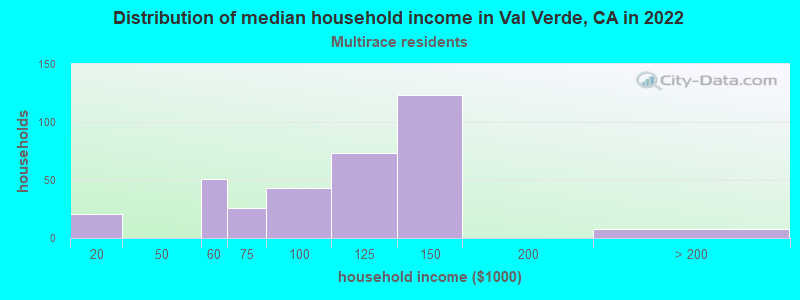
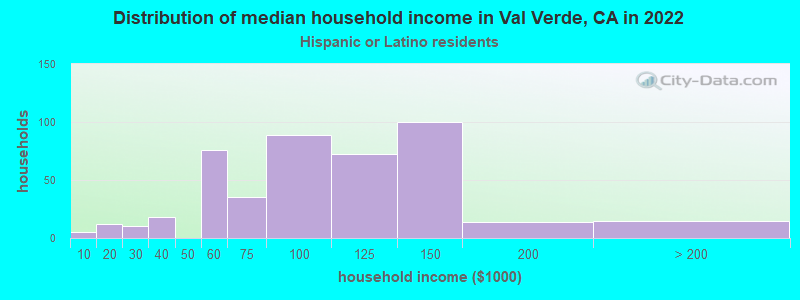
Language usage in Val Verde
English speakers - Total 49.3% of residents of Val Verde speak English at home.
47.3% of residents speak Spanish at home 703 57.5% Speak English very well520 42.5% Speak English less than very well2.8% of residents speak other language at home 62 86.1% Speak English very well10 13.9% Speak English less than very well
English speakers - Born in the United States 95.8% of residents of Val Verde speak English at home.
3.4% of residents speak Spanish at home 9 100.0% Speak English very well
English speakers - Native, born elsewhere 75.9% of residents of Val Verde speak English at home.
24.1% of residents speak Spanish at home 7 100.0% Speak English less than very well
English speakers - Foreign-born 7.0% of residents of Val Verde speak English at home.
80.0% of residents speak Spanish at home 150 27.2% Speak English very well401 72.8% Speak English less than very well10.3% of residents speak other language at home 61 85.9% Speak English very well10 14.1% Speak English less than very well
White (Caucasian) - Speak only English Native:
70.1% (859)Foreign-born:
11.2% (34)
White (Caucasian) - Speak another language Native:
25.7% (315)Foreign-born:
86.7% (261)
Asian - Speak only English Native:
100.0% (33)Foreign-born:
10.3% (6)
Other race - Speak another language Native:
67.3% (163)Foreign-born:
98.5% (176)
Two or more races - Speak another language Native:
40.1% (109)Foreign-born:
100.0% (107)
White alone - Speak only English Native:
99.1% (590)Foreign-born:
50.1% (23)
White alone - Speak another language Native:
0.7% (4)Foreign-born:
48.5% (22)
Hispanic or Latino - Speak only English Native:
43.5% (524)Foreign-born:
3.2% (18)
Hispanic or Latino - Speak another language Native:
56.7% (683)Foreign-born:
96.2% (543)
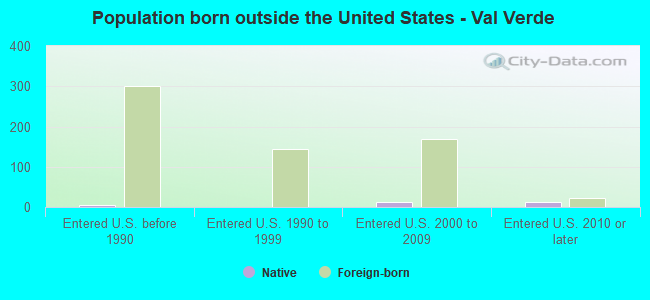
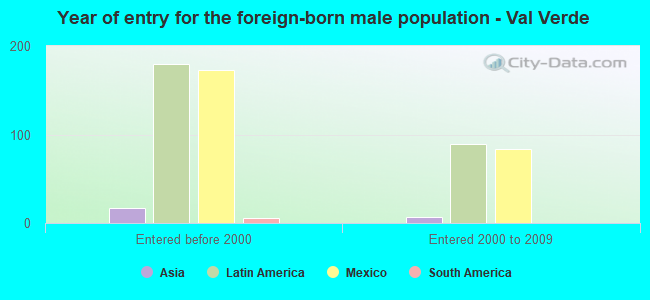
Foreign-born residents in Val Verde 704 residents are foreign born (22.0% Latin America ).
This city:
25.8%California:
100.0%
Marital status for residents in Val Verde Marital status - White (Caucasian) population 15 years and over
Males 44.6% Never married40.5% Now married0.0% Separated3.0% Widowed11.9% DivorcedFemales 37.4% Never married41.6% Now married0.5% Separated4.4% Widowed16.1% DivorcedWomen who gave birth in the past 12 months Now married:
27.0% (8)Unmarried:
73.0% (21)
Women who did not give birth in the past 12 months Now married:
35.9% (130)Unmarried:
64.1% (232)
Marital status - Black or African American population 15 years and over
Males 0.0% Never married70.5% Now married0.0% Separated0.0% Widowed29.5% DivorcedFemales 0.0% Never married66.7% Now married0.0% Separated0.0% Widowed33.3% DivorcedWomen who did not give birth in the past 12 months Now married:
100.0% (7)Unmarried:
0.0% (0)
Marital status - American Indian / Alaska Native population 15 years and over
Males 46.2% Never married53.8% Now married0.0% Separated0.0% Widowed0.0% DivorcedFemales 0.0% Never married54.5% Now married0.0% Separated0.0% Widowed45.5% DivorcedWomen who did not give birth in the past 12 months Now married:
100.0% (9)Unmarried:
0.0% (0)
Marital status - Asian population 15 years and over
Males 36.2% Never married51.1% Now married0.0% Separated0.0% Widowed12.8% DivorcedFemales 8.3% Never married63.9% Now married16.7% Separated0.0% Widowed11.1% DivorcedWomen who gave birth in the past 12 months Now married:
100.0% (4)Unmarried:
0.0% (0)
Women who did not give birth in the past 12 months Now married:
70.0% (7)Unmarried:
30.0% (3)
Marital status - Other race population 15 years and over
Males 61.5% Never married26.4% Now married0.0% Separated0.0% Widowed12.1% DivorcedFemales 40.2% Never married54.3% Now married0.0% Separated5.4% Widowed0.0% DivorcedWomen who gave birth in the past 12 months Now married:
0.0% (0)Unmarried:
100.0% (4)
Women who did not give birth in the past 12 months Now married:
49.2% (34)Unmarried:
50.8% (36)
Marital status - Two or more races population 15 years and over
Males 35.2% Never married64.8% Now married0.0% Separated0.0% Widowed0.0% DivorcedFemales 25.0% Never married75.0% Now married0.0% Separated0.0% Widowed0.0% DivorcedWomen who did not give birth in the past 12 months Now married:
75.0% (62)Unmarried:
25.0% (21)
Marital status - White alone, not Hispanic / Latino population 15 years and over
Males 49.1% Never married36.9% Now married0.0% Separated7.1% Widowed6.8% DivorcedFemales 36.6% Never married44.4% Now married0.0% Separated6.4% Widowed12.5% DivorcedWomen who gave birth in the past 12 months Now married:
100.0% (4)Unmarried:
0.0% (0)
Women who did not give birth in the past 12 months Now married:
34.5% (53)Unmarried:
65.5% (100)
Marital status - Hispanic or Latino population 15 years and over
Males 48.4% Never married38.0% Now married0.0% Separated0.0% Widowed13.5% DivorcedFemales 36.9% Never married43.9% Now married0.6% Separated3.3% Widowed15.2% DivorcedWomen who gave birth in the past 12 months Now married:
16.2% (6)Unmarried:
83.8% (31)
Women who did not give birth in the past 12 months Now married:
42.4% (167)Unmarried:
57.6% (227)
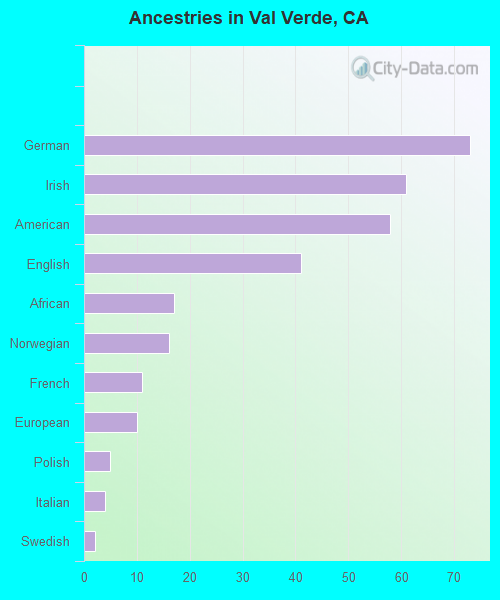
Ancestries in Val Verde
58 3.4% American34 2.0% German32 1.9% European24 1.4% Irish14 0.8% English10 0.6% Iranian9 0.5% Norwegian8 0.5% Scandinavian7 0.4% Polish5 0.3% French4 0.2% Scotch-Irish3 0.2% Czechoslovakian3 0.2% Italian3 0.2% Latvian3 0.2% African3 0.2% Swedish
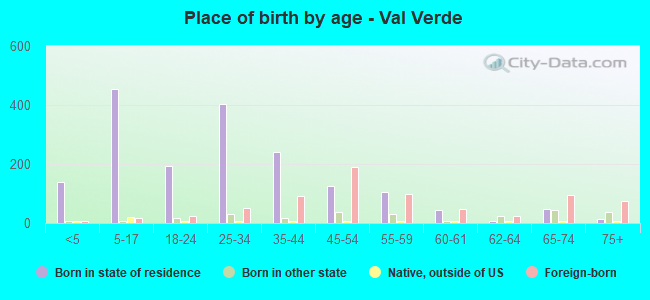
Children Nativity (place of birth) in Val Verde
Children under 6 years - Living with two parents Both parents native 41 100.0% NativeBoth parents foreign-born 17 100.0% NativeOne native, one foreign-born parent 15 100.0% NativeChildren under 6 years - Living with one parent Native parent 76 100.0% NativeForeign-born parent 18 100.0% NativeChildren 6 to 17 years - Living with two parents Both parents native 216 100.0% NativeBoth parents foreign-born 99 100.0% NativeOne native, one foreign-born parent 61 100.0% NativeChildren 6 to 17 years - Living with one parent Native parent 25 100.0% NativeForeign-born parent 21 50.0% Native21 50.0% Foreign-born
Grandparents responsible for own grandchildren in Val Verde
Grandparents (30 to 59 years) White / Caucasian 2 8.1% Responsible for grandchildren20 91.9% Not responsible for grandchildrenOther race 4 100.0% Not responsible for grandchildrenWhite alone, not Hispanic / Latino 2 100.0% Responsible for grandchildrenHispanic or Latino 34 100.0% Not responsible for grandchildren
Grandparents (60 years and over) White / Caucasian 27 100.0% Not responsible for grandchildrenWhite alone, not Hispanic / Latino 6 100.0% Not responsible for grandchildrenHispanic or Latino 29 100.0% Not responsible for grandchildren