Races in Valley Stream, New York (NY) Detailed Stats
Data:
Races - White alone (%)
Races - White alone (% change since 2000)
Races - Black alone (%)
Races - Black alone (% change since 2000)
Races - American Indian alone (%)
Races - American Indian alone (% change since 2000)
Races - Asian alone (%)
Races - Asian alone (% change since 2000)
Races - Hispanic (%)
Races - Hispanic (% change since 2000)
Races - Native Hawaiian and Other Pacific Islander alone (%)
Races - Native Hawaiian and Other Pacific Islander alone (% change since 2000)
Races - Two or more races(%)
Races - Two or more races(% change since 2000)
Races - Other race alone (%)
Races - Other race alone (% change since 2000)
Racial diversity
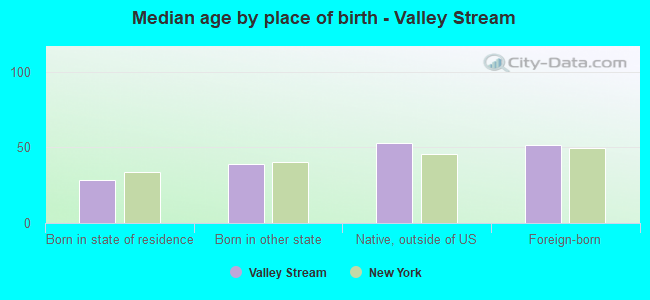
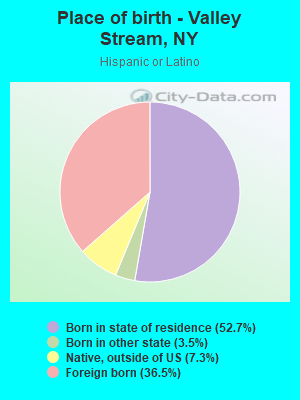
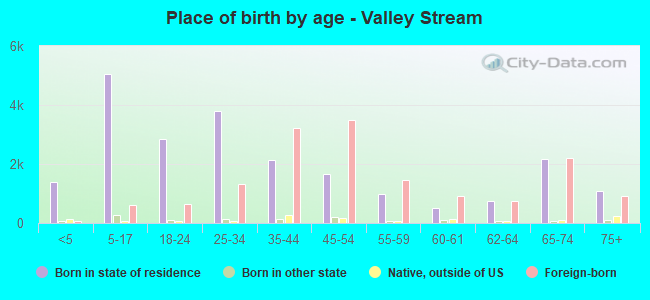
Place of birth - Born in state of residence (%)
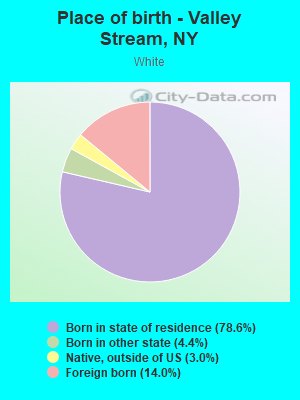
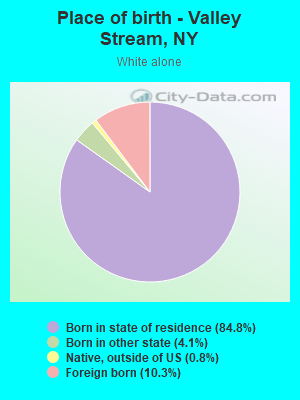
Place of birth - Born in state of residence (%) - White
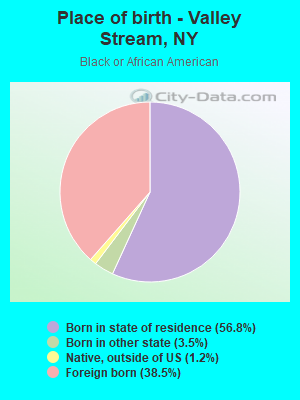
Place of birth - Born in state of residence (%) - Black or African American
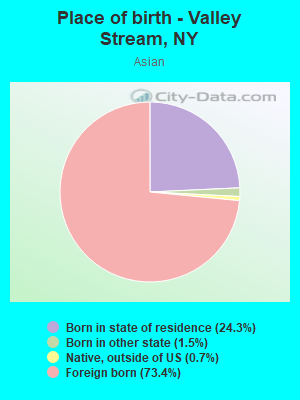
Place of birth - Born in state of residence (%) - Asian
Place of birth - Born in state of residence (%) - Hispanic or Latino
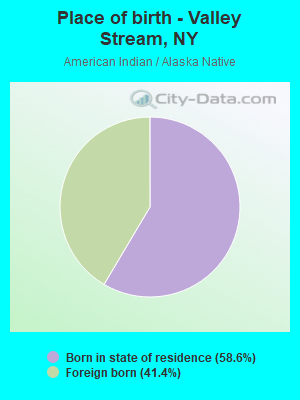
Place of birth - Born in state of residence (%) - American Indian and Alaska Native
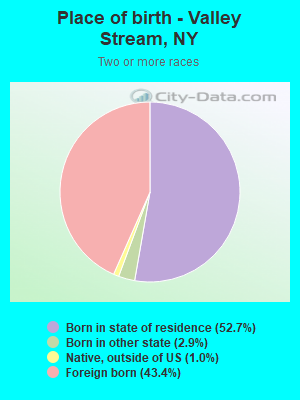
Place of birth - Born in state of residence (%) - Multirace
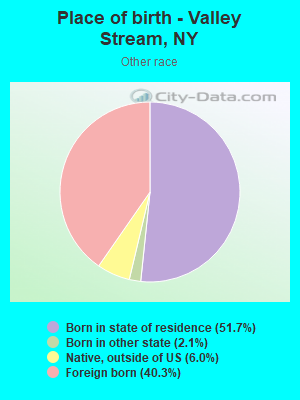
Place of birth - Born in state of residence (%) - Other Race
Place of birth - Born in other state (%)
Place of birth - Born in other state (%) - White
Place of birth - Born in other state (%) - Black or African American
Place of birth - Born in other state (%) - Asian
Place of birth - Born in other state (%) - Hispanic or Latino
Place of birth - Born in other state (%) - American Indian and Alaska Native
Place of birth - Born in other state (%) - Multirace
Place of birth - Born in other state (%) - Other Race
Place of birth - Native, outside of US (%)
Place of birth - Native, outside of US (%) - White
Place of birth - Native, outside of US (%) - Black or African American
Place of birth - Native, outside of US (%) - Asian
Place of birth - Native, outside of US (%) - Hispanic or Latino
Place of birth - Native, outside of US (%) - American Indian and Alaska Native
Place of birth - Native, outside of US (%) - Multirace
Place of birth - Native, outside of US (%) - Other Race
Place of birth - Foreign born (%)
Place of birth - Foreign born (%) - White
Place of birth - Foreign born (%) - Black or African American
Place of birth - Foreign born (%) - Asian
Place of birth - Foreign born (%) - Hispanic or Latino
Place of birth - Foreign born (%) - American Indian and Alaska Native
Place of birth - Foreign born (%) - Multirace
Place of birth - Foreign born (%) - Other Race
Residents speaking English at home (%)
Residents speaking English at home - Born in the United States (%)
Residents speaking English at home - Native, born elsewhere (%)
Residents speaking English at home - Foreign born (%)
Residents speaking Spanish at home (%)
Residents speaking Spanish at home - Born in the United States (%)
Residents speaking Spanish at home - Native, born elsewhere (%)
Residents speaking Spanish at home - Foreign born (%)
Residents speaking other language at home (%)
Residents speaking other language at home - Born in the United States (%)
Residents speaking other language at home - Native, born elsewhere (%)
Residents speaking other language at home - Foreign born (%)
Marital status - Never married (%)
Marital status - Now married (%)
Marital status - Separated (%)
Marital status - Widowed (%)
Marital status - Divorced (%)
Ancestries Reported - Arab (%)
Ancestries Reported - Czech (%)
Ancestries Reported - Danish (%)
Ancestries Reported - Dutch (%)
Ancestries Reported - English (%)
Ancestries Reported - French (%)
Ancestries Reported - French Canadian (%)
Ancestries Reported - German (%)
Ancestries Reported - Greek (%)
Ancestries Reported - Hungarian (%)
Ancestries Reported - Irish (%)
Ancestries Reported - Italian (%)
Ancestries Reported - Lithuanian (%)
Ancestries Reported - Norwegian (%)
Ancestries Reported - Polish (%)
Ancestries Reported - Portuguese (%)
Ancestries Reported - Russian (%)
Ancestries Reported - Scotch-Irish (%)
Ancestries Reported - Scottish (%)
Ancestries Reported - Slovak (%)
Ancestries Reported - Subsaharan African (%)
Ancestries Reported - Swedish (%)
Ancestries Reported - Swiss (%)
Ancestries Reported - Ukrainian (%)
Ancestries Reported - United States (%)
Ancestries Reported - Welsh (%)
Ancestries Reported - West Indian (%)
Ancestries Reported - Other (%)
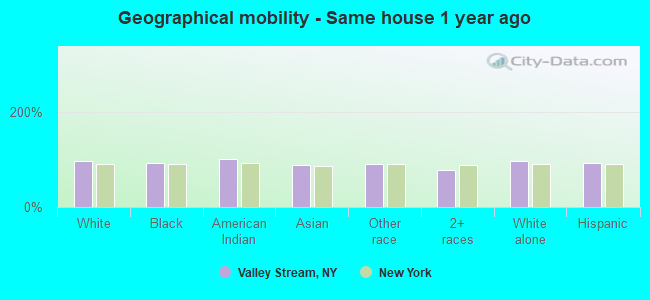
Geographical mobility - Same house 1 year ago (%)
Geographical mobility - Same house 1 year ago (%) - White
Geographical mobility - Same house 1 year ago (%) - Black or African American
Geographical mobility - Same house 1 year ago (%) - Asian
Geographical mobility - Same house 1 year ago (%) - Hispanic or Latino
Geographical mobility - Same house 1 year ago (%) - American Indian and Alaska Native
Geographical mobility - Same house 1 year ago (%) - Multirace
Geographical mobility - Same house 1 year ago (%) - Other Race
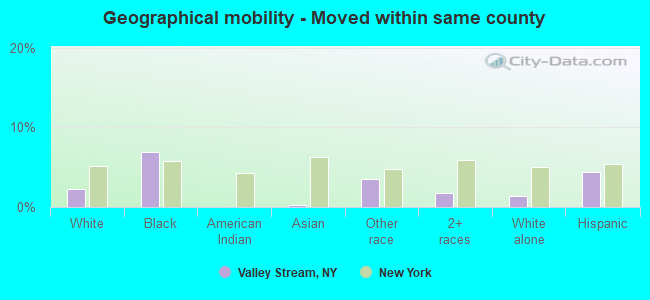
Geographical mobility - Moved within same county (%)
Geographical mobility - Moved within same county (%) - White
Geographical mobility - Moved within same county (%) - Black or African American
Geographical mobility - Moved within same county (%) - Asian
Geographical mobility - Moved within same county (%) - Hispanic or Latino
Geographical mobility - Moved within same county (%) - American Indian and Alaska Native
Geographical mobility - Moved within same county (%) - Multirace
Geographical mobility - Moved within same county (%) - Other Race
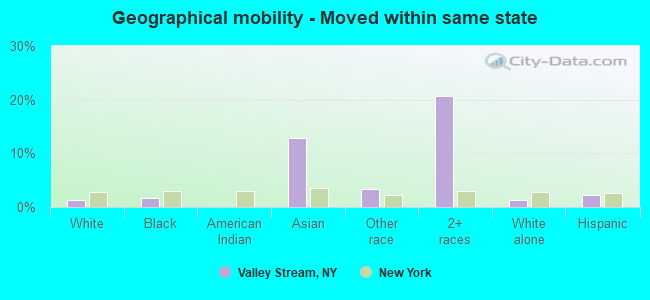
Geographical mobility - Moved from different county within same state (%)
Geographical mobility - Moved from different county within same state (%) - White
Geographical mobility - Moved from different county within same state (%) - Black or African American
Geographical mobility - Moved from different county within same state (%) - Asian
Geographical mobility - Moved from different county within same state (%) - Hispanic or Latino
Geographical mobility - Moved from different county within same state (%) - American Indian and Alaska Native
Geographical mobility - Moved from different county within same state (%) - Multirace
Geographical mobility - Moved from different county within same state (%) - Other Race
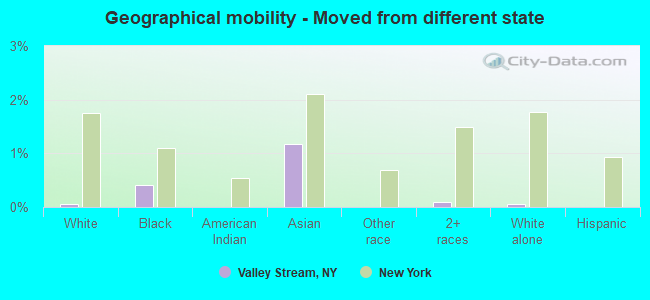
Geographical mobility - Moved from different state (%)
Geographical mobility - Moved from different state (%) - White
Geographical mobility - Moved from different state (%) - Black or African American
Geographical mobility - Moved from different state (%) - Asian
Geographical mobility - Moved from different state (%) - Hispanic or Latino
Geographical mobility - Moved from different state (%) - American Indian and Alaska Native
Geographical mobility - Moved from different state (%) - Multirace
Geographical mobility - Moved from different state (%) - Other Race
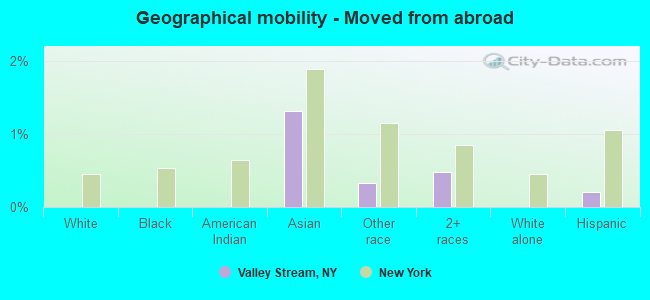
Geographical mobility - Moved from abroad (%)
Geographical mobility - Moved from abroad (%) - White
Geographical mobility - Moved from abroad (%) - Black or African American
Geographical mobility - Moved from abroad (%) - Asian
Geographical mobility - Moved from abroad (%) - Hispanic or Latino
Geographical mobility - Moved from abroad (%) - American Indian and Alaska Native
Geographical mobility - Moved from abroad (%) - Multirace
Geographical mobility - Moved from abroad (%) - Other Race
Place of birth for the foreign-born population - Ireland (%)
Place of birth for the foreign-born population - Denmark (%)
Place of birth for the foreign-born population - Norway (%)
Place of birth for the foreign-born population - Sweden (%)
Place of birth for the foreign-born population - United Kingdom (%)
Place of birth for the foreign-born population - England (%)
Place of birth for the foreign-born population - Scotland (%)
Place of birth for the foreign-born population - Other Northern Europe (%)
Place of birth for the foreign-born population - Austria (%)
Place of birth for the foreign-born population - Belgium (%)
Place of birth for the foreign-born population - France (%)
Place of birth for the foreign-born population - Germany (%)
Place of birth for the foreign-born population - Netherlands (%)
Place of birth for the foreign-born population - Switzerland (%)
Place of birth for the foreign-born population - Other Western Europe (%)
Place of birth for the foreign-born population - Greece (%)
Place of birth for the foreign-born population - Italy (%)
Place of birth for the foreign-born population - Portugal (%)
Place of birth for the foreign-born population - Spain (%)
Place of birth for the foreign-born population - Other Southern Europe (%)
Place of birth for the foreign-born population - Albania (%)
Place of birth for the foreign-born population - Belarus (%)
Place of birth for the foreign-born population - Bosnia and Herzegovina (%)
Place of birth for the foreign-born population - Bulgaria (%)
Place of birth for the foreign-born population - Croatia (%)
Place of birth for the foreign-born population - Czechoslovakia (%)
Place of birth for the foreign-born population - Hungary (%)
Place of birth for the foreign-born population - Latvia (%)
Place of birth for the foreign-born population - Lithuania (%)
Place of birth for the foreign-born population - North Macedonia (Macedonia) (%)
Place of birth for the foreign-born population - Moldova (%)
Place of birth for the foreign-born population - Poland (%)
Place of birth for the foreign-born population - Romania (%)
Place of birth for the foreign-born population - Russia (%)
Place of birth for the foreign-born population - Serbia (%)
Place of birth for the foreign-born population - Ukraine (%)
Place of birth for the foreign-born population - Other Eastern Europe (%)
Place of birth for the foreign-born population - China (%)
Place of birth for the foreign-born population - Hong Kong (%)
Place of birth for the foreign-born population - Taiwan (%)
Place of birth for the foreign-born population - Japan (%)
Place of birth for the foreign-born population - Korea (%)
Place of birth for the foreign-born population - Other Eastern Asia (%)
Place of birth for the foreign-born population - Afghanistan (%)
Place of birth for the foreign-born population - Bangladesh (%)
Place of birth for the foreign-born population - India (%)
Place of birth for the foreign-born population - Iran (%)
Place of birth for the foreign-born population - Kazakhstan (%)
Place of birth for the foreign-born population - Nepal (%)
Place of birth for the foreign-born population - Pakistan (%)
Place of birth for the foreign-born population - Sri Lanka (%)
Place of birth for the foreign-born population - Uzbekistan (%)
Place of birth for the foreign-born population - Other South Central Asia (%)
Place of birth for the foreign-born population - Burma (%)
Place of birth for the foreign-born population - Cambodia (%)
Place of birth for the foreign-born population - Indonesia (%)
Place of birth for the foreign-born population - Laos (%)
Place of birth for the foreign-born population - Malaysia (%)
Place of birth for the foreign-born population - Philippines (%)
Place of birth for the foreign-born population - Singapore (%)
Place of birth for the foreign-born population - Thailand (%)
Place of birth for the foreign-born population - Vietnam (%)
Place of birth for the foreign-born population - Other South Eastern Asia (%)
Place of birth for the foreign-born population - Armenia (%)
Place of birth for the foreign-born population - Iraq (%)
Place of birth for the foreign-born population - Israel (%)
Place of birth for the foreign-born population - Jordan (%)
Place of birth for the foreign-born population - Kuwait (%)
Place of birth for the foreign-born population - Lebanon (%)
Place of birth for the foreign-born population - Saudi Arabia (%)
Place of birth for the foreign-born population - Syria (%)
Place of birth for the foreign-born population - Turkey (%)
Place of birth for the foreign-born population - Yemen (%)
Place of birth for the foreign-born population - Other Western Asia (%)
Place of birth for the foreign-born population - Eritrea (%)
Place of birth for the foreign-born population - Ethiopia (%)
Place of birth for the foreign-born population - Kenya (%)
Place of birth for the foreign-born population - Somalia (%)
Place of birth for the foreign-born population - Uganda (%)
Place of birth for the foreign-born population - Zimbabwe (%)
Place of birth for the foreign-born population - Other Eastern Africa (%)
Place of birth for the foreign-born population - Cameroon (%)
Place of birth for the foreign-born population - Congo (%)
Place of birth for the foreign-born population - Democratic Republic of Congo (Zaire) (%)
Place of birth for the foreign-born population - Other Middle Africa (%)
Place of birth for the foreign-born population - Egypt (%)
Place of birth for the foreign-born population - Morocco (%)
Place of birth for the foreign-born population - Sudan (%)
Place of birth for the foreign-born population - Other Northern Africa (%)
Place of birth for the foreign-born population - South Africa (%)
Place of birth for the foreign-born population - Other Southern Africa (%)
Place of birth for the foreign-born population - Cabo Verde (%)
Place of birth for the foreign-born population - Ghana (%)
Place of birth for the foreign-born population - Liberia (%)
Place of birth for the foreign-born population - Nigeria (%)
Place of birth for the foreign-born population - Senegal (%)
Place of birth for the foreign-born population - Sierra Leone (%)
Place of birth for the foreign-born population - Other Western Africa (%)
Place of birth for the foreign-born population - Australia (%)
Place of birth for the foreign-born population - New Zealand (%)
Place of birth for the foreign-born population - Fiji (%)
Place of birth for the foreign-born population - Micronesia (%)
Place of birth for the foreign-born population - Bahamas (%)
Place of birth for the foreign-born population - Barbados (%)
Place of birth for the foreign-born population - Cuba (%)
Place of birth for the foreign-born population - Dominica (%)
Place of birth for the foreign-born population - Dominican Republic (%)
Place of birth for the foreign-born population - Grenada (%)
Place of birth for the foreign-born population - Haiti (%)
Place of birth for the foreign-born population - Jamaica (%)
Place of birth for the foreign-born population - St. Vincent and the Grenadines (%)
Place of birth for the foreign-born population - Trinidad and Tobago (%)
Place of birth for the foreign-born population - West Indies (%)
Place of birth for the foreign-born population - Other Caribbean (%)
Place of birth for the foreign-born population - Belize (%)
Place of birth for the foreign-born population - Costa Rica (%)
Place of birth for the foreign-born population - El Salvador (%)
Place of birth for the foreign-born population - Guatemala (%)
Place of birth for the foreign-born population - Honduras (%)
Place of birth for the foreign-born population - Mexico (%)
Place of birth for the foreign-born population - Nicaragua (%)
Place of birth for the foreign-born population - Panama (%)
Place of birth for the foreign-born population - Other Central America (%)
Place of birth for the foreign-born population - Argentina (%)
Place of birth for the foreign-born population - Bolivia (%)
Place of birth for the foreign-born population - Brazil (%)
Place of birth for the foreign-born population - Chile (%)
Place of birth for the foreign-born population - Colombia (%)
Place of birth for the foreign-born population - Ecuador (%)
Place of birth for the foreign-born population - Guyana (%)
Place of birth for the foreign-born population - Peru (%)
Place of birth for the foreign-born population - Uruguay (%)
Place of birth for the foreign-born population - Venezuela (%)
Place of birth for the foreign-born population - Other South America (%)
Place of birth for the foreign-born population - Canada (%)
Place of birth for the foreign-born population - Other Northern America (%)
Place of birth for the foreign-born population - Other (%)
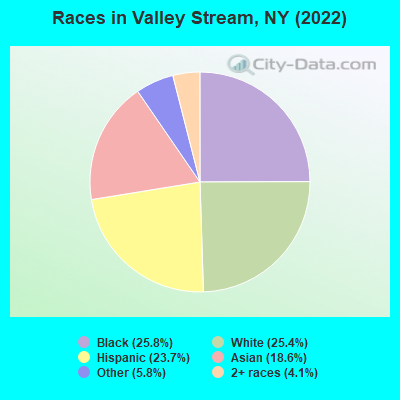
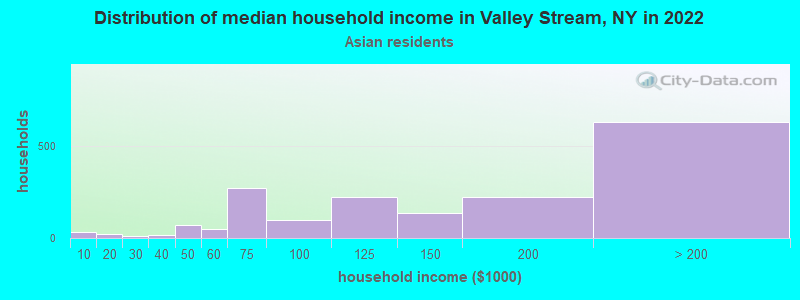
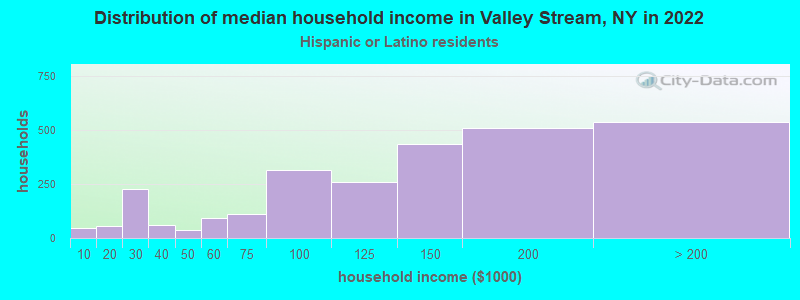
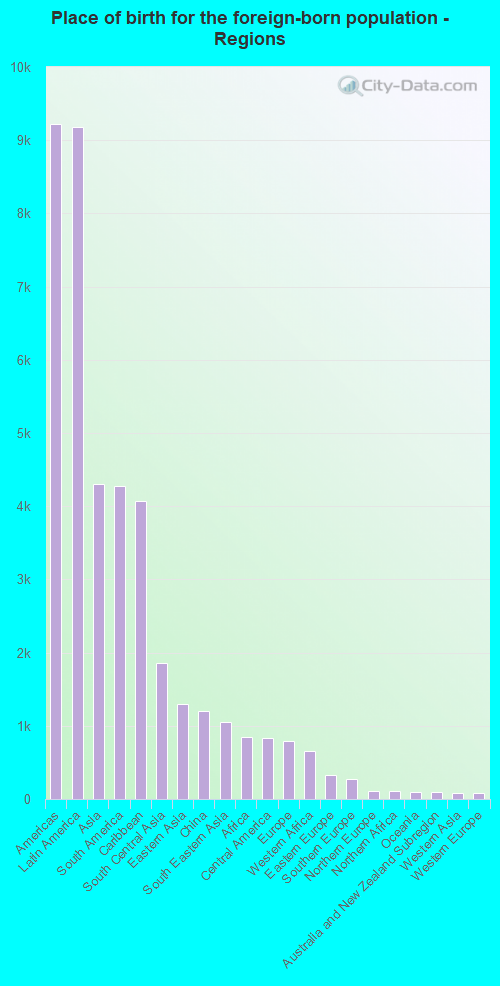
According to 2022 data, the most numerous races in Valley Stream, NY are White alone (10,188 residents), Hispanic (9,518 residents), and Black alone (10,334 residents). 58.3% of Valley Stream residents speak English at home. 38.0% of Valley Stream, NY residents are foreign-born (23.0% born in Latin America, 10.8% born in Asia), which is 42.1% greater than the foreign-born rate of 22.0% across the entire state of New York.
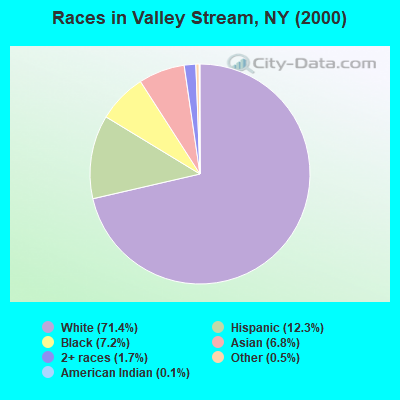
Race distribution in Valley Stream
2000 2022
25,981 71.4% White alone 4,463 12.3% Hispanic 2,603 7.2% Black alone 2,469 6.8% Asian alone 607 1.7% Two or more races 193 0.5% Other race alone 39 0.1% American Indian alone 13 0.04% Native Hawaiian and Other
10,334 25.8% Black alone 10,188 25.4% White alone 9,518 23.7% Hispanic 7,476 18.6% Asian alone 2,311 5.8% Other race alone 1,644 4.1% Two or more races
2000 2022
11,760,981 62.0% White alone 2,867,583 15.1% Hispanic 2,812,623 14.8% Black alone 1,035,926 5.5% Asian alone 366,116 1.9% Two or more races 75,499 0.4% Other race alone 52,499 0.3% American Indian alone 5,230 0.03% Native Hawaiian and Other
10,408,933 52.9% White alone 3,867,299 19.7% Hispanic 2,633,840 13.4% Black alone 1,776,286 9.0% Asian alone 732,670 3.7% Two or more races 216,110 1.1% Other race alone 35,082 0.2% American Indian alone 6,931 0.04% Native Hawaiian and Other
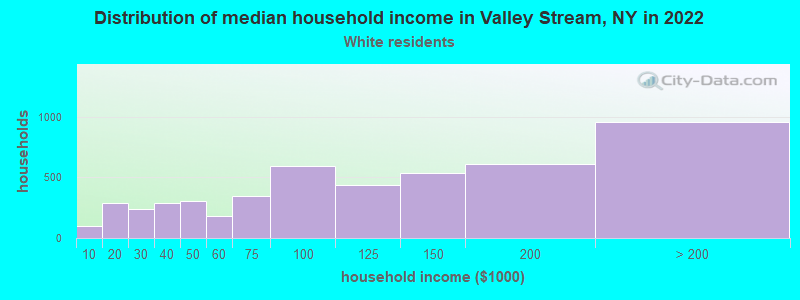
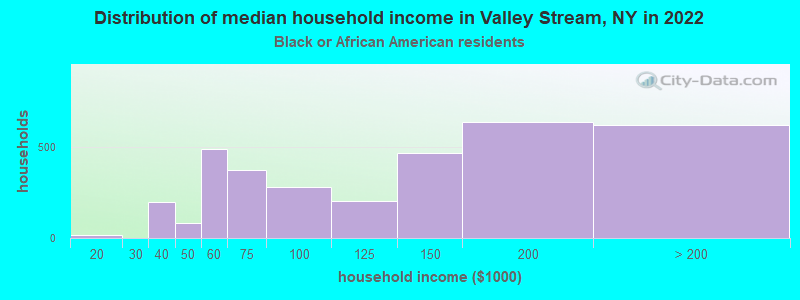
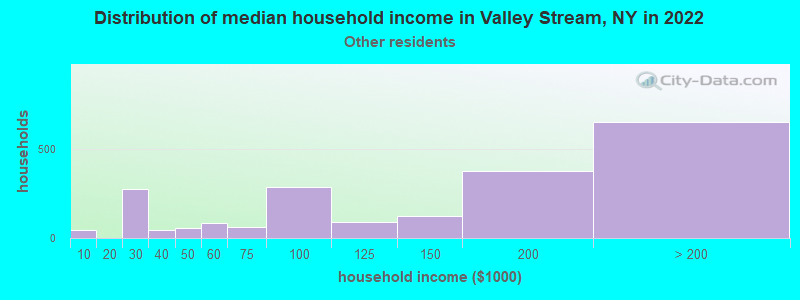
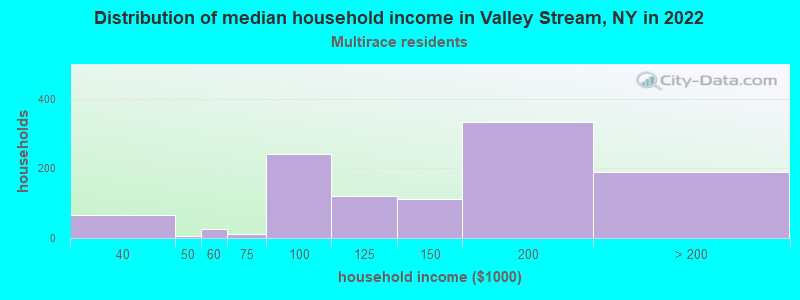
Income and house value in Valley Stream Median household income in 2022 $97,915 White non-Hispanic householders$133,154 Black householders$141,218 Asian householders$142,723 Some other race householders$145,131 Two or more races householders$133,878 Hispanic or Latino race householdersMedian 2022 house value $575,889 White Non-Hispanic householders$628,058 Black or African American householders$505,943 American Indian or Alaska Native householders $652,830 Asian householders$611,154 Some other race householders$596,582 Two or more races householders$592,793 Hispanic or Latino householders
Median age by race in Valley Stream
55.8 Median age for White residents53.0 59.6 35.4 Median age for Black or African American residents37.9 34.1 -855,158,729.3 Median age for American Indian / Alaska Native residents-607,543,322.5 -837,121,211.3 39.3 Median age for Asian residents41.3 38.3 -487,992,314.6 Median age for Native Hawaiian / Pacific Islander residents-477,502,295.2 -497,387,669.3 42.6 Median age for Other race residents42.2 41.4 30.9 Median age for Two or more races residents27.7 36.6 57.6 Median age for White alone residents54.4 61.0 40.8 Median age for Hispanic or Latino residents34.4 43.3
Owner/renter occupied households by race in Valley Stream
House owners and renters - White residents 4,050 83.8% Owner occupied785 16.2% Renter occupiedHouse owners and renters - Black or African American residents 2,229 71.3% Owner occupied896 28.7% Renter occupiedHouse owners and renters - American Indian / Alaska Native residents 11 100.0% Owner occupiedHouse owners and renters - Asian residents 1,762 95.2% Owner occupied89 4.8% Renter occupiedHouse owners and renters - Other race residents 1,452 73.5% Owner occupied524 26.5% Renter occupiedHouse owners and renters - Two or more races residents 959 89.2% Owner occupied116 10.8% Renter occupiedHouse owners and renters - White alone residents 3,603 86.1% Owner occupied580 13.9% Renter occupiedHouse owners and renters - Hispanic or Latino residents 1,839 69.8% Owner occupied796 30.2% Renter occupied
Language usage in Valley Stream
English speakers - Total 58.3% of residents of Valley Stream speak English at home.
19.1% of residents speak Spanish at home 5,207 70.8% Speak English very well2,148 29.2% Speak English less than very well23.0% of residents speak other language at home 5,570 63.0% Speak English very well3,278 37.0% Speak English less than very well
English speakers - Born in the United States 75.0% of residents of Valley Stream speak English at home.
28.8% of residents speak Spanish at home 349 100.0% Speak English very well4.9% of residents speak other language at home 59 100.0% Speak English very well
English speakers - Native, born elsewhere 21.1% of residents of Valley Stream speak English at home.
59.8% of residents speak Spanish at home 479 86.8% Speak English very well73 13.2% Speak English less than very well16.9% of residents speak other language at home 156 100.0% Speak English very well
English speakers - Foreign-born 33.2% of residents of Valley Stream speak English at home.
20.1% of residents speak Spanish at home 1,278 40.4% Speak English very well1,886 59.6% Speak English less than very well45.8% of residents speak other language at home 3,952 54.9% Speak English very well3,247 45.1% Speak English less than very well
White (Caucasian) - Speak only English Native:
86.1% (8,542)Foreign-born:
15.9% (265)
White (Caucasian) - Speak another language Native:
12.2% (1,209)Foreign-born:
81.2% (1,353)
Black or African American - Speak only English Native:
88.7% (5,233)Foreign-born:
63.3% (2,523)
Black or African American - Speak another language Native:
11.4% (673)Foreign-born:
36.6% (1,461)
American Indian / Alaska Native - Speak another language Native:
100.0% (16)Foreign-born:
100.0% (9)
Asian - Speak only English Native:
56.0% (960)Foreign-born:
16.0% (887)
Asian - Speak another language Native:
44.4% (761)Foreign-born:
83.0% (4,596)
Other race - Speak only English Native:
47.2% (1,930)Foreign-born:
21.4% (641)
Other race - Speak another language Native:
53.9% (2,202)Foreign-born:
74.2% (2,220)
Two or more races - Speak only English Native:
43.0% (1,081)Foreign-born:
49.3% (999)
Two or more races - Speak another language Native:
62.6% (1,574)Foreign-born:
45.9% (931)
White alone - Speak only English Native:
94.1% (8,392)Foreign-born:
24.3% (254)
White alone - Speak another language Native:
5.9% (526)Foreign-born:
75.8% (793)
Hispanic or Latino - Speak only English Native:
29.0% (1,655)Foreign-born:
7.2% (251)
Hispanic or Latino - Speak another language Native:
71.4% (4,068)Foreign-born:
92.8% (3,244)
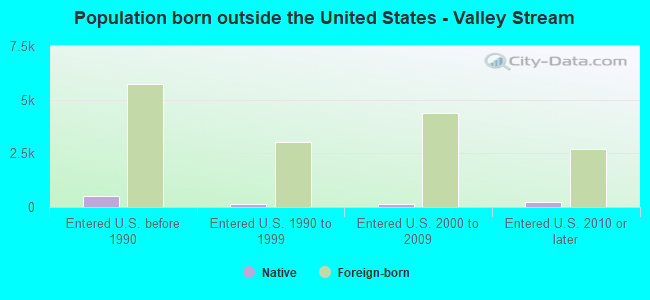
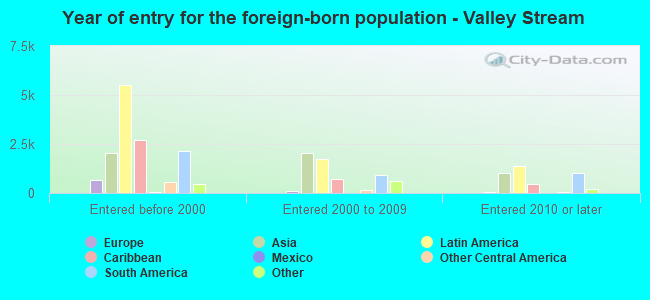
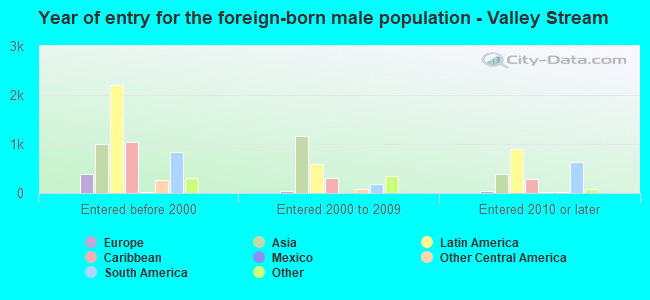
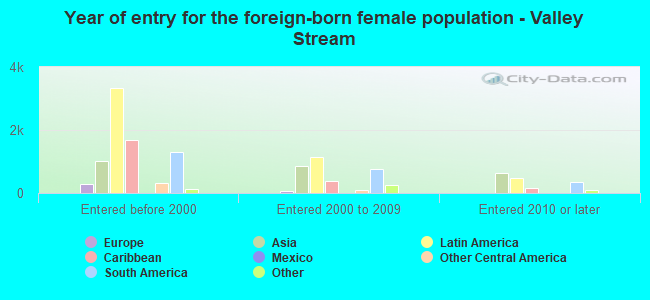
Foreign-born residents in Valley Stream 15,246 residents are foreign born (23.0% Latin America , 10.8% Asia ).
This city:
38.0%New York:
22.6%
Marital status for residents in Valley Stream Marital status - White (Caucasian) population 15 years and over
Males 31.7% Never married60.2% Now married1.1% Separated4.2% Widowed2.9% DivorcedFemales 26.4% Never married49.4% Now married1.7% Separated13.2% Widowed9.2% DivorcedWomen who gave birth in the past 12 months Now married:
100.0% (41)Unmarried:
0.0% (0)
Women who did not give birth in the past 12 months Now married:
37.2% (775)Unmarried:
62.8% (1,309)
Marital status - Black or African American population 15 years and over
Males 35.7% Never married52.9% Now married0.4% Separated1.4% Widowed9.6% DivorcedFemales 41.9% Never married37.2% Now married1.2% Separated4.9% Widowed14.8% DivorcedWomen who gave birth in the past 12 months Now married:
62.9% (90)Unmarried:
37.1% (53)
Women who did not give birth in the past 12 months Now married:
35.6% (982)Unmarried:
64.4% (1,773)
Marital status - American Indian / Alaska Native population 15 years and over
Males 100.0% Never married0.0% Now married0.0% Separated0.0% Widowed0.0% DivorcedFemales 0.0% Never married100.0% Now married0.0% Separated0.0% Widowed0.0% DivorcedWomen who did not give birth in the past 12 months Now married:
100.0% (20)Unmarried:
0.0% (0)
Marital status - Asian population 15 years and over
Males 39.5% Never married58.9% Now married0.0% Separated1.3% Widowed0.3% DivorcedFemales 31.4% Never married59.1% Now married0.0% Separated5.0% Widowed4.4% DivorcedWomen who gave birth in the past 12 months Now married:
100.0% (43)Unmarried:
0.0% (0)
Women who did not give birth in the past 12 months Now married:
48.0% (1,060)Unmarried:
52.0% (1,147)
Marital status - Other race population 15 years and over
Males 36.4% Never married55.8% Now married0.8% Separated0.0% Widowed7.0% DivorcedFemales 38.1% Never married46.6% Now married1.2% Separated5.4% Widowed8.6% DivorcedWomen who did not give birth in the past 12 months Now married:
42.0% (801)Unmarried:
58.0% (1,105)
Marital status - Two or more races population 15 years and over
Males 61.6% Never married37.1% Now married0.0% Separated0.0% Widowed1.3% DivorcedFemales 32.5% Never married46.5% Now married2.3% Separated6.4% Widowed12.3% DivorcedWomen who gave birth in the past 12 months Now married:
100.0% (29)Unmarried:
0.0% (0)
Women who did not give birth in the past 12 months Now married:
42.9% (532)Unmarried:
57.1% (707)
Marital status - White alone, not Hispanic / Latino population 15 years and over
Males 32.3% Never married60.8% Now married0.7% Separated4.5% Widowed1.6% DivorcedFemales 25.3% Never married51.0% Now married1.5% Separated14.2% Widowed8.0% DivorcedWomen who gave birth in the past 12 months Now married:
100.0% (29)Unmarried:
0.0% (0)
Women who did not give birth in the past 12 months Now married:
36.9% (565)Unmarried:
63.1% (966)
Marital status - Hispanic or Latino population 15 years and over
Males 39.5% Never married53.0% Now married1.3% Separated0.7% Widowed5.5% DivorcedFemales 34.0% Never married48.6% Now married1.3% Separated4.0% Widowed12.2% DivorcedWomen who gave birth in the past 12 months Now married:
100.0% (35)Unmarried:
0.0% (0)
Women who did not give birth in the past 12 months Now married:
39.3% (962)Unmarried:
60.7% (1,485)
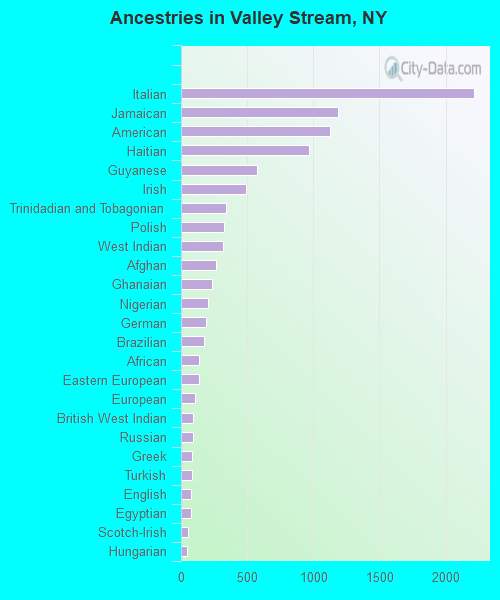
Ancestries in Valley Stream
2,217 9.9% Italian1,190 5.3% Jamaican1,125 5.0% American965 4.3% Haitian571 2.5% Guyanese490 2.2% Irish340 1.5% Trinidadian and Tobagonian327 1.5% Polish316 1.4% West Indian263 1.2% Afghan236 1.1% Ghanaian204 0.9% Nigerian186 0.8% German174 0.8% Brazilian137 0.6% African136 0.6% Eastern European105 0.5% European90 0.4% British West Indian89 0.4% Russian82 0.4% Greek81 0.4% Turkish78 0.3% English72 0.3% Egyptian55 0.2% Scotch-Irish45 0.2% Hungarian41 0.2% Scottish34 0.2% Slavic31 0.1% Romanian23 0.1% French Canadian18 0.08% Lebanese17 0.08% Czechoslovakian16 0.07% Israeli14 0.06% Dutch14 0.06% Bahamian13 0.06% Ukrainian11 0.05% Barbadian9 0.04% British8 0.04% French7 0.03% Norwegian6 0.03% Czech
Geographical mobility in Valley Stream Same house 1 year ago 11,469 95.9% White (Caucasian)9,560 91.6% Black or African American30 100.0% American Indian / Alaska Native6,471 86.6% Asian6,717 91.2% Other race3,580 77.4% Two or more races9,818 96.7% White alone, not Hispanic / Latino8,823 92.8% Hispanic or LatinoMoved within same county 269 2.2% White / Caucasian719 6.9% Black or African American18 0.2% Asian258 3.5% Other race83 1.8% Two or more races141 1.4% White alone, not Hispanic / Latino422 4.4% Hispanic or LatinoMoved within same state 156 1.3% White / Caucasian171 1.6% Black or African American964 12.9% Asian246 3.3% Other race955 20.6% Two or more races135 1.3% White alone, not Hispanic / Latino209 2.2% Hispanic or LatinoMoved from different state 6 0.0% White / Caucasian43 0.4% Black or African American87 1.2% Asian4 0.1% Two or more races6 0.1% White alone, not Hispanic / LatinoMoved from abroad 98 1.3% Asian24 0.3% Other race22 0.5% Two or more races19 0.2% Hispanic or Latino
Children Nativity (place of birth) in Valley Stream
Children under 6 years - Living with two parents Both parents native 414 100.0% NativeBoth parents foreign-born 716 99.6% Native3 0.4% Foreign-bornOne native, one foreign-born parent 426 100.0% NativeChildren under 6 years - Living with one parent Native parent 152 100.0% NativeForeign-born parent 103 70.4% Native43 29.6% Foreign-bornChildren 6 to 17 years - Living with two parents Both parents native 1,066 100.0% NativeBoth parents foreign-born 1,453 81.4% Native332 18.6% Foreign-bornOne native, one foreign-born parent 1,044 99.1% Native10 0.9% Foreign-bornChildren 6 to 17 years - Living with one parent Native parent 564 100.0% NativeForeign-born parent 771 61.6% Native481 38.4% Foreign-born
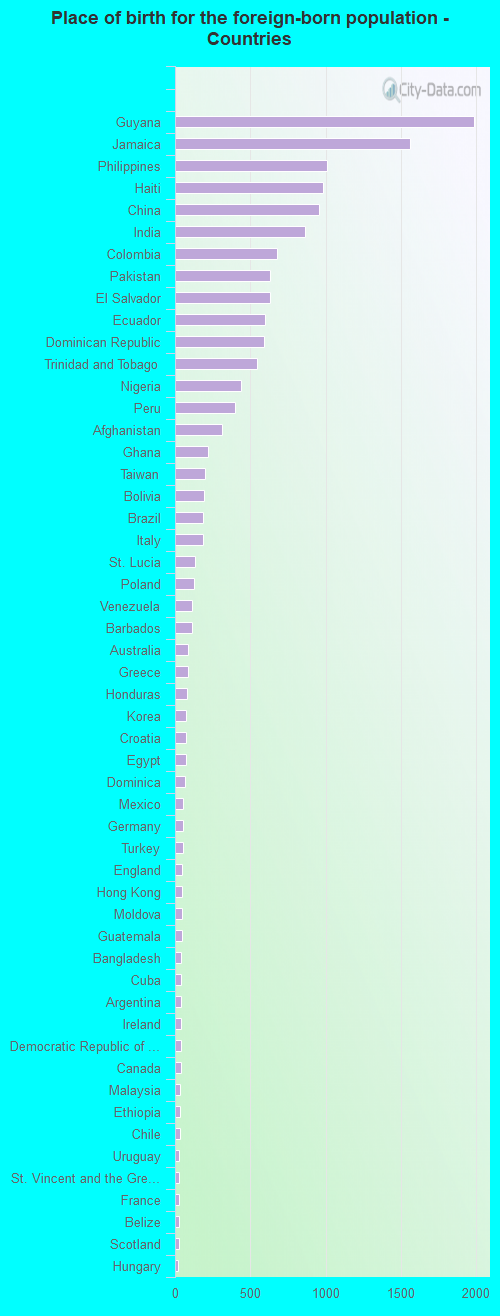
Place of birth for residents in Valley Stream 9,217 Americas9,179 Latin America4,299 Asia4,273 South America4,071 Caribbean1,863 South Central Asia1,296 Eastern Asia1,206 China1,054 South Eastern Asia841 Africa834 Central America798 Europe657 Western Africa323 Eastern Europe276 Southern Europe113 Northern Europe109 Northern Africa89 Oceania89 Australia and New Zealand Subregion85 Western Asia84 Western Europe37 Middle Africa37 Northern America35 Eastern Africa1,987 Guyana1,560 Jamaica1,010 Philippines981 Haiti955 China862 India676 Colombia634 Pakistan629 El Salvador597 Ecuador590 Dominican Republic543 Trinidad and Tobago439 Nigeria401 Peru311 Afghanistan218 Ghana202 Taiwan192 Bolivia189 Brazil188 Italy130 St. Lucia129 Poland115 Venezuela111 Barbados89 Australia88 Greece82 Honduras76 Korea76 Croatia70 Egypt69 Dominica53 Mexico52 Germany50 Turkey49 England48 Hong Kong45 Moldova44 Guatemala43 Bangladesh43 Cuba40 Argentina38 Ireland37 Democratic Republic of Congo (Zaire)37 Canada35 Malaysia35 Ethiopia35 Chile29 Uruguay26 St. Vincent and the Grenadines25 France25 Belize25 Scotland21 Hungary13 Japan13 Grenada13 Romania11 United Arab Emirates11 Nepal11 Ukraine10 Israel7 Saudi Arabia7 Indonesia5 Belgium
Grandparents responsible for own grandchildren in Valley Stream
Grandparents (30 to 59 years) White / Caucasian 19 100.0% Not responsible for grandchildrenBlack or African American 90 41.6% Responsible for grandchildren126 58.4% Not responsible for grandchildrenAsian 5 100.0% Not responsible for grandchildrenOther race 148 100.0% Not responsible for grandchildrenTwo or more races 77 100.0% Not responsible for grandchildrenHispanic or Latino 105 100.0% Not responsible for grandchildrenGrandparents (60 years and over) White / Caucasian 20 8.9% Responsible for grandchildren203 91.1% Not responsible for grandchildrenBlack or African American 154 100.0% Not responsible for grandchildrenAsian 7 1.4% Responsible for grandchildren507 98.6% Not responsible for grandchildrenOther race 174 100.0% Not responsible for grandchildrenTwo or more races 114 100.0% Not responsible for grandchildrenHispanic or Latino 268 100.0% Not responsible for grandchildren