Races in Vashon, Washington (WA) Detailed Stats
Data:
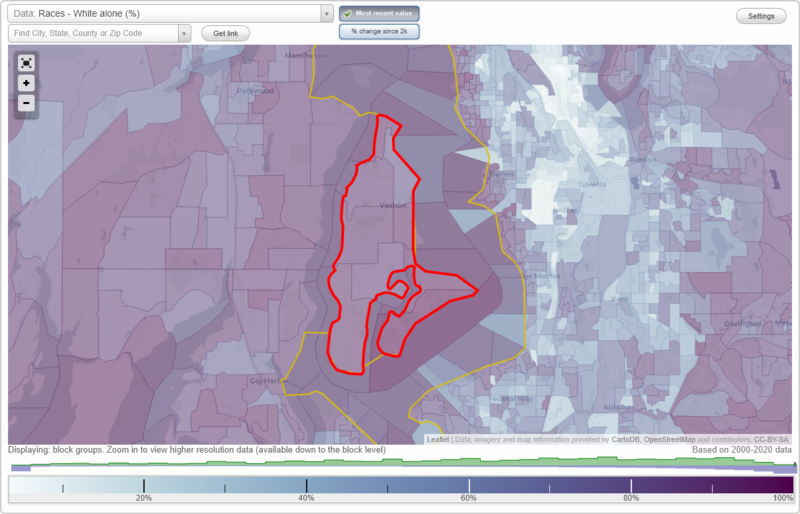
Races - White alone (%)
Races - White alone (% change since 2000)
Races - Black alone (%)
Races - Black alone (% change since 2000)
Races - American Indian alone (%)
Races - American Indian alone (% change since 2000)
Races - Asian alone (%)
Races - Asian alone (% change since 2000)
Races - Hispanic (%)
Races - Hispanic (% change since 2000)
Races - Native Hawaiian and Other Pacific Islander alone (%)
Races - Native Hawaiian and Other Pacific Islander alone (% change since 2000)
Races - Two or more races(%)
Races - Two or more races(% change since 2000)
Races - Other race alone (%)
Races - Other race alone (% change since 2000)
Racial diversity
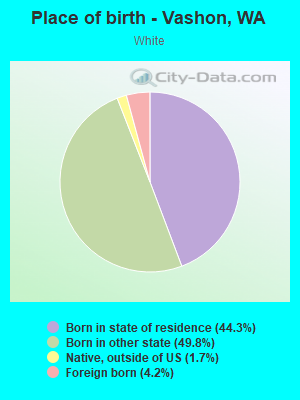
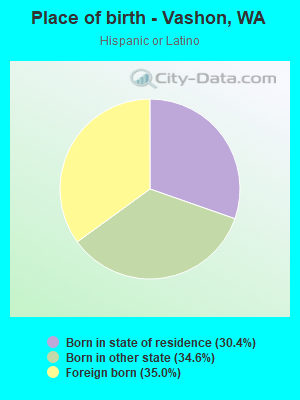
Place of birth - Born in state of residence (%)
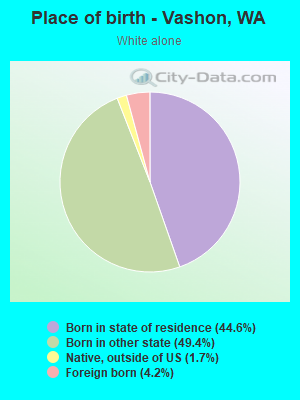
Place of birth - Born in state of residence (%) - White
Place of birth - Born in state of residence (%) - Black or African American
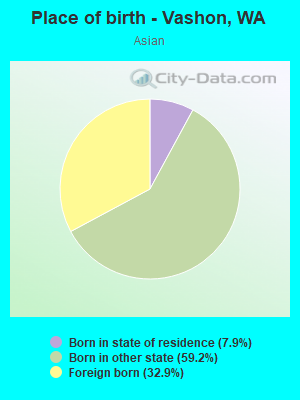
Place of birth - Born in state of residence (%) - Asian
Place of birth - Born in state of residence (%) - Hispanic or Latino
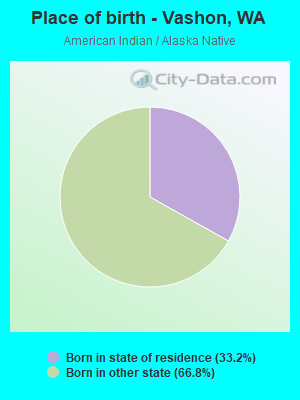
Place of birth - Born in state of residence (%) - American Indian and Alaska Native
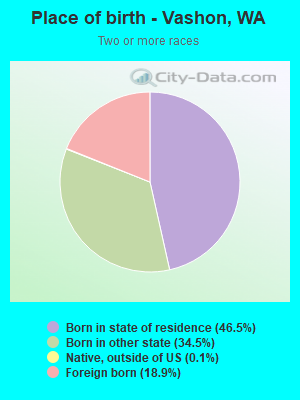
Place of birth - Born in state of residence (%) - Multirace
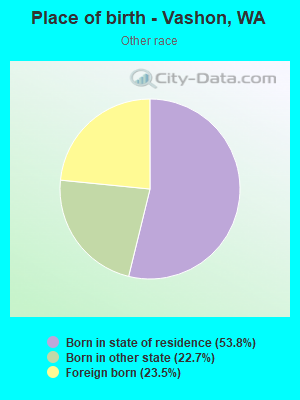
Place of birth - Born in state of residence (%) - Other Race
Place of birth - Born in other state (%)
Place of birth - Born in other state (%) - White
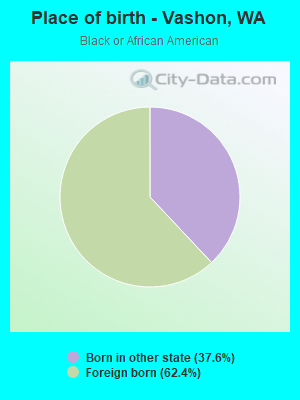
Place of birth - Born in other state (%) - Black or African American
Place of birth - Born in other state (%) - Asian
Place of birth - Born in other state (%) - Hispanic or Latino
Place of birth - Born in other state (%) - American Indian and Alaska Native
Place of birth - Born in other state (%) - Multirace
Place of birth - Born in other state (%) - Other Race
Place of birth - Native, outside of US (%)
Place of birth - Native, outside of US (%) - White
Place of birth - Native, outside of US (%) - Black or African American
Place of birth - Native, outside of US (%) - Asian
Place of birth - Native, outside of US (%) - Hispanic or Latino
Place of birth - Native, outside of US (%) - American Indian and Alaska Native
Place of birth - Native, outside of US (%) - Multirace
Place of birth - Native, outside of US (%) - Other Race
Place of birth - Foreign born (%)
Place of birth - Foreign born (%) - White
Place of birth - Foreign born (%) - Black or African American
Place of birth - Foreign born (%) - Asian
Place of birth - Foreign born (%) - Hispanic or Latino
Place of birth - Foreign born (%) - American Indian and Alaska Native
Place of birth - Foreign born (%) - Multirace
Place of birth - Foreign born (%) - Other Race
Residents speaking English at home (%)
Residents speaking English at home - Born in the United States (%)
Residents speaking English at home - Native, born elsewhere (%)
Residents speaking English at home - Foreign born (%)
Residents speaking Spanish at home (%)
Residents speaking Spanish at home - Born in the United States (%)
Residents speaking Spanish at home - Native, born elsewhere (%)
Residents speaking Spanish at home - Foreign born (%)
Residents speaking other language at home (%)
Residents speaking other language at home - Born in the United States (%)
Residents speaking other language at home - Native, born elsewhere (%)
Residents speaking other language at home - Foreign born (%)
Marital status - Never married (%)
Marital status - Now married (%)
Marital status - Separated (%)
Marital status - Widowed (%)
Marital status - Divorced (%)
Ancestries Reported - Arab (%)
Ancestries Reported - Czech (%)
Ancestries Reported - Danish (%)
Ancestries Reported - Dutch (%)
Ancestries Reported - English (%)
Ancestries Reported - French (%)
Ancestries Reported - French Canadian (%)
Ancestries Reported - German (%)
Ancestries Reported - Greek (%)
Ancestries Reported - Hungarian (%)
Ancestries Reported - Irish (%)
Ancestries Reported - Italian (%)
Ancestries Reported - Lithuanian (%)
Ancestries Reported - Norwegian (%)
Ancestries Reported - Polish (%)
Ancestries Reported - Portuguese (%)
Ancestries Reported - Russian (%)
Ancestries Reported - Scotch-Irish (%)
Ancestries Reported - Scottish (%)
Ancestries Reported - Slovak (%)
Ancestries Reported - Subsaharan African (%)
Ancestries Reported - Swedish (%)
Ancestries Reported - Swiss (%)
Ancestries Reported - Ukrainian (%)
Ancestries Reported - United States (%)
Ancestries Reported - Welsh (%)
Ancestries Reported - West Indian (%)
Ancestries Reported - Other (%)
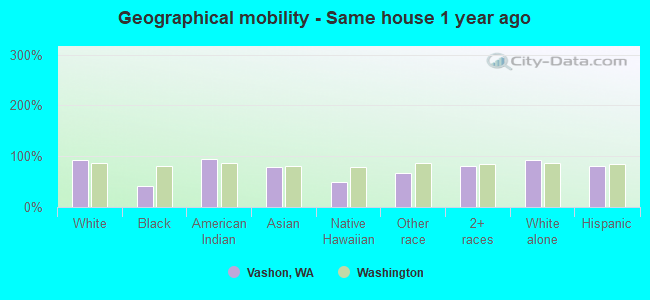
Geographical mobility - Same house 1 year ago (%)
Geographical mobility - Same house 1 year ago (%) - White
Geographical mobility - Same house 1 year ago (%) - Black or African American
Geographical mobility - Same house 1 year ago (%) - Asian
Geographical mobility - Same house 1 year ago (%) - Hispanic or Latino
Geographical mobility - Same house 1 year ago (%) - American Indian and Alaska Native
Geographical mobility - Same house 1 year ago (%) - Multirace
Geographical mobility - Same house 1 year ago (%) - Other Race
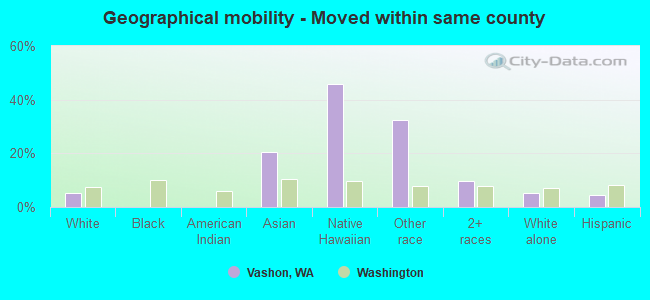
Geographical mobility - Moved within same county (%)
Geographical mobility - Moved within same county (%) - White
Geographical mobility - Moved within same county (%) - Black or African American
Geographical mobility - Moved within same county (%) - Asian
Geographical mobility - Moved within same county (%) - Hispanic or Latino
Geographical mobility - Moved within same county (%) - American Indian and Alaska Native
Geographical mobility - Moved within same county (%) - Multirace
Geographical mobility - Moved within same county (%) - Other Race
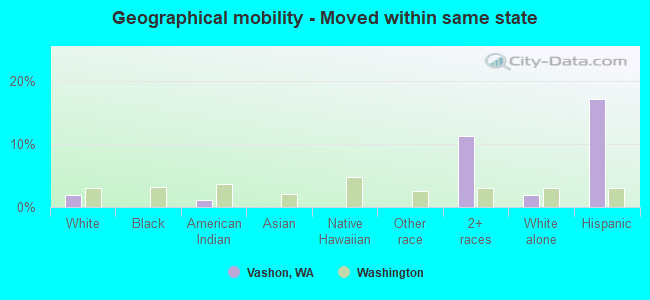
Geographical mobility - Moved from different county within same state (%)
Geographical mobility - Moved from different county within same state (%) - White
Geographical mobility - Moved from different county within same state (%) - Black or African American
Geographical mobility - Moved from different county within same state (%) - Asian
Geographical mobility - Moved from different county within same state (%) - Hispanic or Latino
Geographical mobility - Moved from different county within same state (%) - American Indian and Alaska Native
Geographical mobility - Moved from different county within same state (%) - Multirace
Geographical mobility - Moved from different county within same state (%) - Other Race
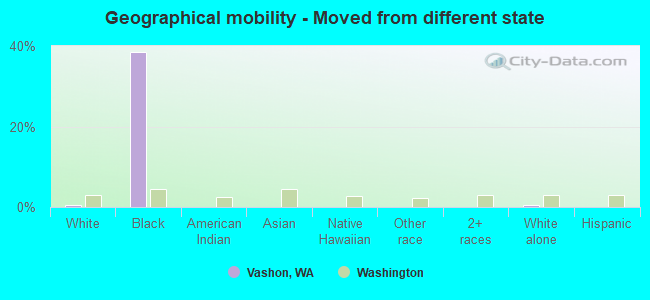
Geographical mobility - Moved from different state (%)
Geographical mobility - Moved from different state (%) - White
Geographical mobility - Moved from different state (%) - Black or African American
Geographical mobility - Moved from different state (%) - Asian
Geographical mobility - Moved from different state (%) - Hispanic or Latino
Geographical mobility - Moved from different state (%) - American Indian and Alaska Native
Geographical mobility - Moved from different state (%) - Multirace
Geographical mobility - Moved from different state (%) - Other Race
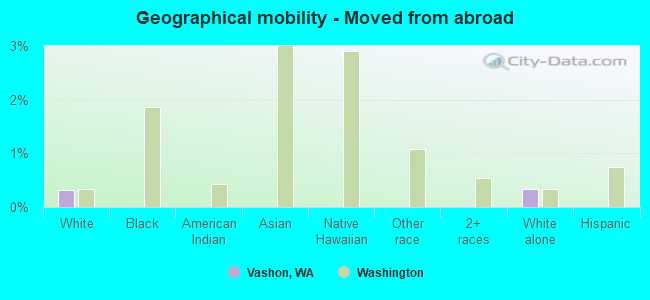
Geographical mobility - Moved from abroad (%)
Geographical mobility - Moved from abroad (%) - White
Geographical mobility - Moved from abroad (%) - Black or African American
Geographical mobility - Moved from abroad (%) - Asian
Geographical mobility - Moved from abroad (%) - Hispanic or Latino
Geographical mobility - Moved from abroad (%) - American Indian and Alaska Native
Geographical mobility - Moved from abroad (%) - Multirace
Geographical mobility - Moved from abroad (%) - Other Race
Place of birth for the foreign-born population - Ireland (%)
Place of birth for the foreign-born population - Denmark (%)
Place of birth for the foreign-born population - Norway (%)
Place of birth for the foreign-born population - Sweden (%)
Place of birth for the foreign-born population - United Kingdom (%)
Place of birth for the foreign-born population - England (%)
Place of birth for the foreign-born population - Scotland (%)
Place of birth for the foreign-born population - Other Northern Europe (%)
Place of birth for the foreign-born population - Austria (%)
Place of birth for the foreign-born population - Belgium (%)
Place of birth for the foreign-born population - France (%)
Place of birth for the foreign-born population - Germany (%)
Place of birth for the foreign-born population - Netherlands (%)
Place of birth for the foreign-born population - Switzerland (%)
Place of birth for the foreign-born population - Other Western Europe (%)
Place of birth for the foreign-born population - Greece (%)
Place of birth for the foreign-born population - Italy (%)
Place of birth for the foreign-born population - Portugal (%)
Place of birth for the foreign-born population - Spain (%)
Place of birth for the foreign-born population - Other Southern Europe (%)
Place of birth for the foreign-born population - Albania (%)
Place of birth for the foreign-born population - Belarus (%)
Place of birth for the foreign-born population - Bosnia and Herzegovina (%)
Place of birth for the foreign-born population - Bulgaria (%)
Place of birth for the foreign-born population - Croatia (%)
Place of birth for the foreign-born population - Czechoslovakia (%)
Place of birth for the foreign-born population - Hungary (%)
Place of birth for the foreign-born population - Latvia (%)
Place of birth for the foreign-born population - Lithuania (%)
Place of birth for the foreign-born population - North Macedonia (Macedonia) (%)
Place of birth for the foreign-born population - Moldova (%)
Place of birth for the foreign-born population - Poland (%)
Place of birth for the foreign-born population - Romania (%)
Place of birth for the foreign-born population - Russia (%)
Place of birth for the foreign-born population - Serbia (%)
Place of birth for the foreign-born population - Ukraine (%)
Place of birth for the foreign-born population - Other Eastern Europe (%)
Place of birth for the foreign-born population - China (%)
Place of birth for the foreign-born population - Hong Kong (%)
Place of birth for the foreign-born population - Taiwan (%)
Place of birth for the foreign-born population - Japan (%)
Place of birth for the foreign-born population - Korea (%)
Place of birth for the foreign-born population - Other Eastern Asia (%)
Place of birth for the foreign-born population - Afghanistan (%)
Place of birth for the foreign-born population - Bangladesh (%)
Place of birth for the foreign-born population - India (%)
Place of birth for the foreign-born population - Iran (%)
Place of birth for the foreign-born population - Kazakhstan (%)
Place of birth for the foreign-born population - Nepal (%)
Place of birth for the foreign-born population - Pakistan (%)
Place of birth for the foreign-born population - Sri Lanka (%)
Place of birth for the foreign-born population - Uzbekistan (%)
Place of birth for the foreign-born population - Other South Central Asia (%)
Place of birth for the foreign-born population - Burma (%)
Place of birth for the foreign-born population - Cambodia (%)
Place of birth for the foreign-born population - Indonesia (%)
Place of birth for the foreign-born population - Laos (%)
Place of birth for the foreign-born population - Malaysia (%)
Place of birth for the foreign-born population - Philippines (%)
Place of birth for the foreign-born population - Singapore (%)
Place of birth for the foreign-born population - Thailand (%)
Place of birth for the foreign-born population - Vietnam (%)
Place of birth for the foreign-born population - Other South Eastern Asia (%)
Place of birth for the foreign-born population - Armenia (%)
Place of birth for the foreign-born population - Iraq (%)
Place of birth for the foreign-born population - Israel (%)
Place of birth for the foreign-born population - Jordan (%)
Place of birth for the foreign-born population - Kuwait (%)
Place of birth for the foreign-born population - Lebanon (%)
Place of birth for the foreign-born population - Saudi Arabia (%)
Place of birth for the foreign-born population - Syria (%)
Place of birth for the foreign-born population - Turkey (%)
Place of birth for the foreign-born population - Yemen (%)
Place of birth for the foreign-born population - Other Western Asia (%)
Place of birth for the foreign-born population - Eritrea (%)
Place of birth for the foreign-born population - Ethiopia (%)
Place of birth for the foreign-born population - Kenya (%)
Place of birth for the foreign-born population - Somalia (%)
Place of birth for the foreign-born population - Uganda (%)
Place of birth for the foreign-born population - Zimbabwe (%)
Place of birth for the foreign-born population - Other Eastern Africa (%)
Place of birth for the foreign-born population - Cameroon (%)
Place of birth for the foreign-born population - Congo (%)
Place of birth for the foreign-born population - Democratic Republic of Congo (Zaire) (%)
Place of birth for the foreign-born population - Other Middle Africa (%)
Place of birth for the foreign-born population - Egypt (%)
Place of birth for the foreign-born population - Morocco (%)
Place of birth for the foreign-born population - Sudan (%)
Place of birth for the foreign-born population - Other Northern Africa (%)
Place of birth for the foreign-born population - South Africa (%)
Place of birth for the foreign-born population - Other Southern Africa (%)
Place of birth for the foreign-born population - Cabo Verde (%)
Place of birth for the foreign-born population - Ghana (%)
Place of birth for the foreign-born population - Liberia (%)
Place of birth for the foreign-born population - Nigeria (%)
Place of birth for the foreign-born population - Senegal (%)
Place of birth for the foreign-born population - Sierra Leone (%)
Place of birth for the foreign-born population - Other Western Africa (%)
Place of birth for the foreign-born population - Australia (%)
Place of birth for the foreign-born population - New Zealand (%)
Place of birth for the foreign-born population - Fiji (%)
Place of birth for the foreign-born population - Micronesia (%)
Place of birth for the foreign-born population - Bahamas (%)
Place of birth for the foreign-born population - Barbados (%)
Place of birth for the foreign-born population - Cuba (%)
Place of birth for the foreign-born population - Dominica (%)
Place of birth for the foreign-born population - Dominican Republic (%)
Place of birth for the foreign-born population - Grenada (%)
Place of birth for the foreign-born population - Haiti (%)
Place of birth for the foreign-born population - Jamaica (%)
Place of birth for the foreign-born population - St. Vincent and the Grenadines (%)
Place of birth for the foreign-born population - Trinidad and Tobago (%)
Place of birth for the foreign-born population - West Indies (%)
Place of birth for the foreign-born population - Other Caribbean (%)
Place of birth for the foreign-born population - Belize (%)
Place of birth for the foreign-born population - Costa Rica (%)
Place of birth for the foreign-born population - El Salvador (%)
Place of birth for the foreign-born population - Guatemala (%)
Place of birth for the foreign-born population - Honduras (%)
Place of birth for the foreign-born population - Mexico (%)
Place of birth for the foreign-born population - Nicaragua (%)
Place of birth for the foreign-born population - Panama (%)
Place of birth for the foreign-born population - Other Central America (%)
Place of birth for the foreign-born population - Argentina (%)
Place of birth for the foreign-born population - Bolivia (%)
Place of birth for the foreign-born population - Brazil (%)
Place of birth for the foreign-born population - Chile (%)
Place of birth for the foreign-born population - Colombia (%)
Place of birth for the foreign-born population - Ecuador (%)
Place of birth for the foreign-born population - Guyana (%)
Place of birth for the foreign-born population - Peru (%)
Place of birth for the foreign-born population - Uruguay (%)
Place of birth for the foreign-born population - Venezuela (%)
Place of birth for the foreign-born population - Other South America (%)
Place of birth for the foreign-born population - Canada (%)
Place of birth for the foreign-born population - Other Northern America (%)
Place of birth for the foreign-born population - Other (%)
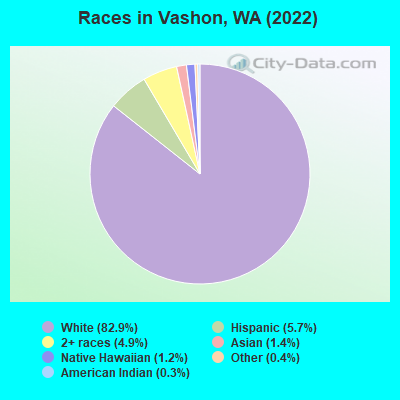
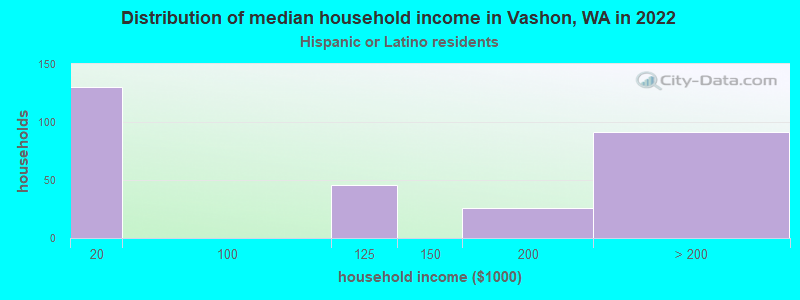
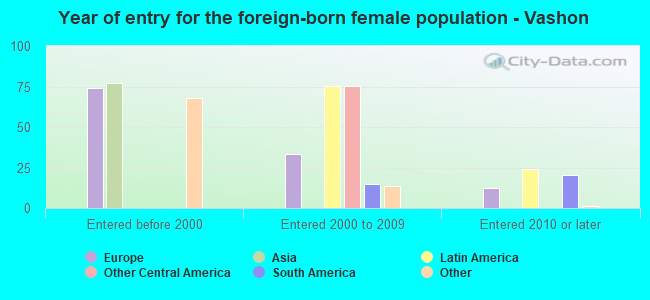
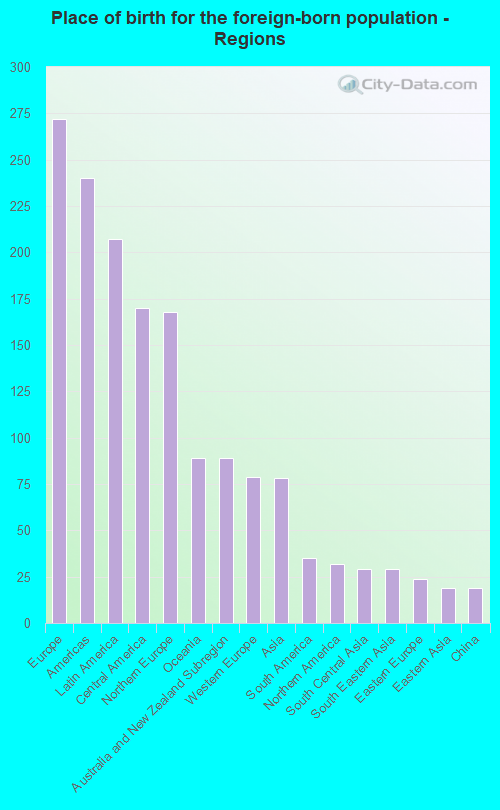
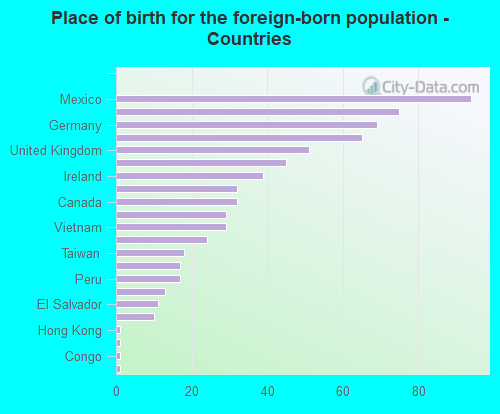
According to 2022 data, the most numerous races in Vashon, WA are White alone (9,117 residents), Hispanic (629 residents), and Asian alone (150 residents). 91.7% of Vashon residents speak English at home. 6.2% of Vashon, WA residents are foreign-born (2.4% born in Europe, 1.8% born in Latin America, 0.8% born in Oceania, 0.7% born in Asia), which is 141.9% less than the foreign-born rate of 15.0% across the entire state of Washington.
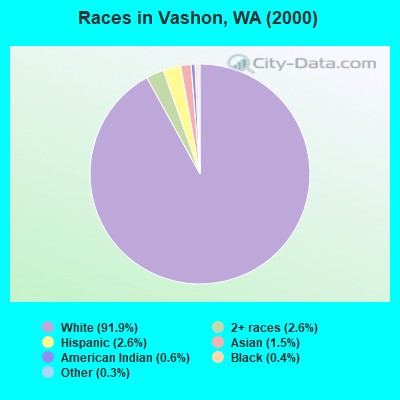
Race distribution in Vashon
2000 2022
4,652,490 78.9% White alone 441,509 7.5% Hispanic 319,401 5.4% Asian alone 184,631 3.1% Black alone 175,926 3.0% Two or more races 85,396 1.4% American Indian alone 22,779 0.4% Native Hawaiian and Other 11,989 0.2% Other race alone
4,941,456 63.5% White alone 1,093,313 14.0% Hispanic 755,832 9.7% Asian alone 523,448 6.7% Two or more races 299,537 3.8% Black alone 69,024 0.9% American Indian alone 52,231 0.7% Native Hawaiian and Other 50,945 0.7% Other race alone
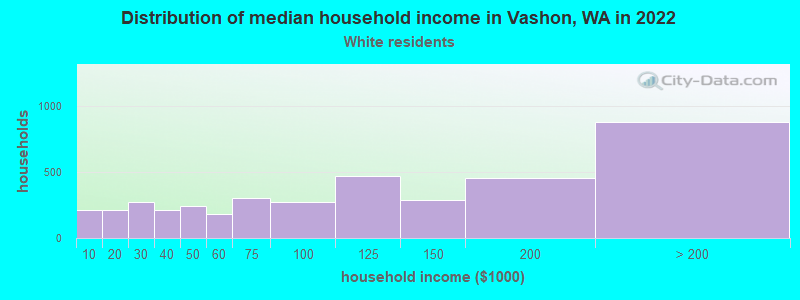
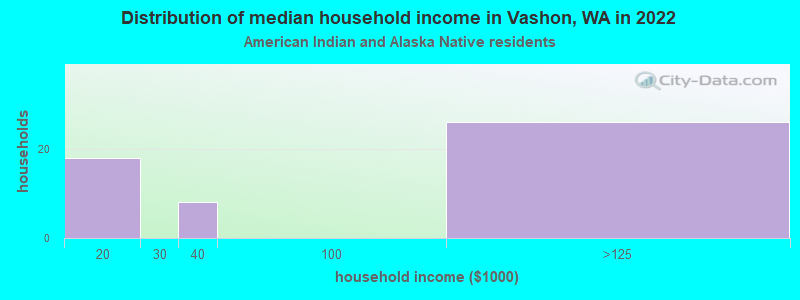
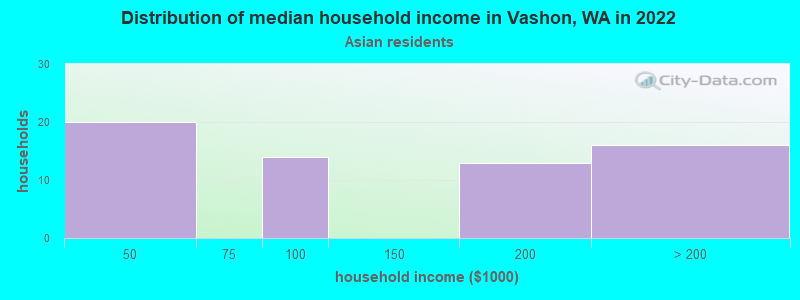
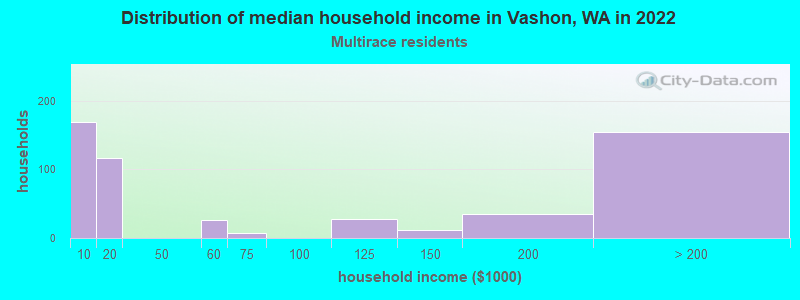
Income and house value in Vashon Median household income in 2022 $102,851 White non-Hispanic householdersMedian 2022 house value $786,893 White Non-Hispanic householders$616,573 Black or African American householders$491,227 American Indian or Alaska Native householders $957,502 Asian householders$652,842 Some other race householders$580,304 Two or more races householders$652,842 Hispanic or Latino householders
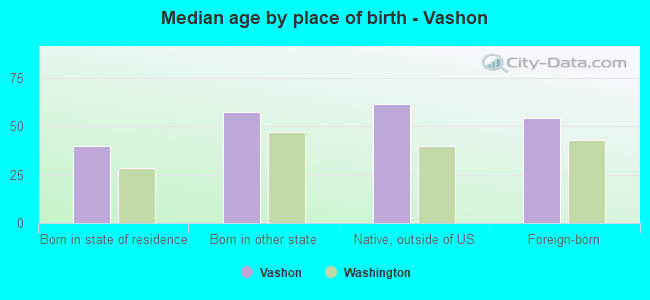
Median age by race in Vashon
53.9 Median age for White residents52.6 55.7 33.8 Median age for Black or African American residents32.9 -697,247,705.7 49.0 Median age for American Indian / Alaska Native residents33.7 62.8 60.8 Median age for Asian residents66.7 52.2 23.4 Median age for Native Hawaiian / Pacific Islander residents-664,509,168.7 -651,945,320.1 60.0 Median age for Other race residents59.1 -666,666,666.0 44.6 Median age for Two or more races residents47.0 41.0 53.6 Median age for White alone residents52.5 55.9 42.7 Median age for Hispanic or Latino residents42.9 44.0
Owner/renter occupied households by race in Vashon
House owners and renters - White residents 3,272 82.0% Owner occupied719 18.0% Renter occupiedHouse owners and renters - American Indian / Alaska Native residents 12 35.0% Owner occupied23 65.0% Renter occupiedHouse owners and renters - Asian residents 49 78.4% Owner occupied13 21.6% Renter occupiedHouse owners and renters - Native Hawaiian / Pacific Islander residents 76 100.0% Owner occupiedHouse owners and renters - Other race residents 16 100.0% Owner occupiedHouse owners and renters - Two or more races residents 382 70.9% Owner occupied157 29.1% Renter occupiedHouse owners and renters - White alone residents 3,284 81.7% Owner occupied733 18.3% Renter occupiedHouse owners and renters - Hispanic or Latino residents 148 69.4% Owner occupied65 30.6% Renter occupied
Language usage in Vashon
English speakers - Total 91.7% of residents of Vashon speak English at home.
3.3% of residents speak Spanish at home 287 81.3% Speak English very well66 18.7% Speak English less than very well2.7% of residents speak other language at home 253 86.9% Speak English very well38 13.1% Speak English less than very well
English speakers - Born in the United States 96.3% of residents of Vashon speak English at home.
1.7% of residents speak Spanish at home 89 100.0% Speak English very well1.5% of residents speak other language at home 79 100.0% Speak English very well
English speakers - Native, born elsewhere 86.0% of residents of Vashon speak English at home.
7.0% of residents speak other language at home 13 100.0% Speak English very well
English speakers - Foreign-born 52.8% of residents of Vashon speak English at home.
29.0% of residents speak Spanish at home 136 68.7% Speak English very well62 31.3% Speak English less than very well16.4% of residents speak other language at home 74 66.1% Speak English very well38 33.9% Speak English less than very well
White (Caucasian) - Speak only English Native:
97.5% (8,251)Foreign-born:
69.7% (267)
White (Caucasian) - Speak another language Native:
2.5% (212)Foreign-born:
29.0% (111)
Black or African American - Speak only English Native:
100.0% (2)Foreign-born:
39.0% (1)
Asian - Speak only English Native:
94.3% (98)Foreign-born:
60.0% (30)
Other race - Speak another language Native:
39.1% (24)Foreign-born:
100.0% (18)
Two or more races - Speak only English Native:
92.1% (722)Foreign-born:
16.4% (35)
Two or more races - Speak another language Native:
6.4% (50)Foreign-born:
83.6% (177)
White alone - Speak only English Native:
97.2% (8,282)Foreign-born:
70.5% (271)
White alone - Speak another language Native:
2.7% (230)Foreign-born:
23.1% (89)
Hispanic or Latino - Speak only English Native:
81.9% (300)Foreign-born:
11.3% (24)
Hispanic or Latino - Speak another language Native:
16.2% (59)Foreign-born:
88.0% (190)
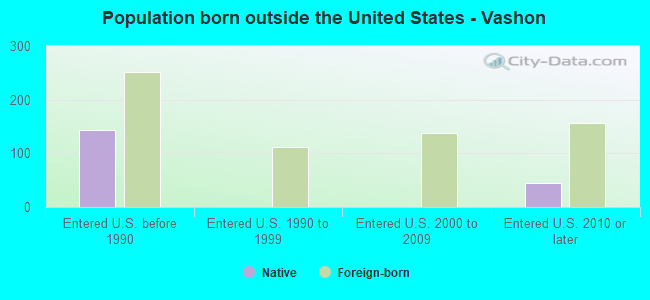
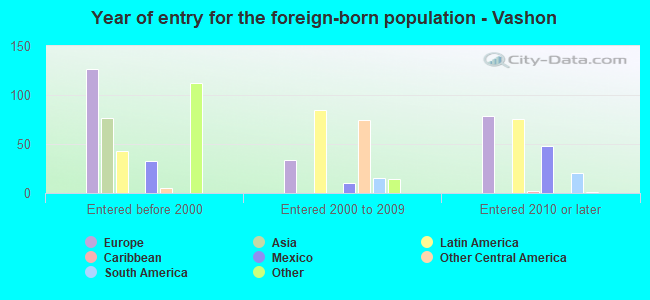
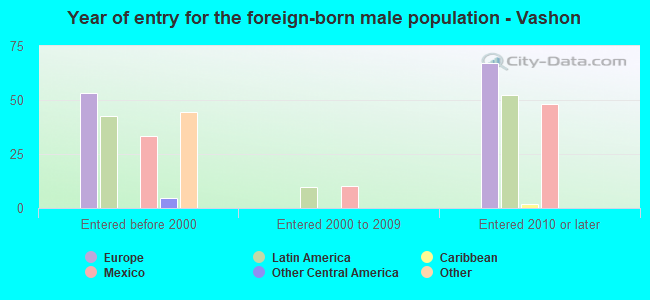
Foreign-born residents in Vashon 682 residents are foreign born (2.4% Europe , 1.8% Latin America , 0.8% Oceania , 0.7% Asia ).
This city:
6.2%Washington:
14.9%
Marital status for residents in Vashon Marital status - White (Caucasian) population 15 years and over
Males 26.6% Never married61.9% Now married1.1% Separated3.3% Widowed7.1% DivorcedFemales 19.0% Never married51.9% Now married0.8% Separated10.1% Widowed18.3% DivorcedWomen who gave birth in the past 12 months Now married:
100.0% (57)Unmarried:
0.0% (0)
Women who did not give birth in the past 12 months Now married:
48.6% (654)Unmarried:
51.4% (692)
Marital status - Black or African American population 15 years and over
Males 75.0% Never married25.0% Now married0.0% Separated0.0% Widowed0.0% DivorcedFemales 0.0% Never married100.0% Now married0.0% Separated0.0% Widowed0.0% DivorcedWomen who did not give birth in the past 12 months Now married:
100.0% (1)Unmarried:
0.0% (0)
Marital status - American Indian / Alaska Native population 15 years and over
Males 95.7% Never married0.0% Now married0.0% Separated4.3% Widowed0.0% DivorcedFemales 4.0% Never married96.0% Now married0.0% Separated0.0% Widowed0.0% DivorcedWomen who gave birth in the past 12 months Now married:
0.0% (0)Unmarried:
100.0% (1)
Marital status - Asian population 15 years and over
Males 21.0% Never married18.5% Now married16.0% Separated0.0% Widowed44.4% DivorcedFemales 20.7% Never married50.0% Now married0.0% Separated1.7% Widowed27.6% DivorcedWomen who did not give birth in the past 12 months Now married:
100.0% (20)Unmarried:
0.0% (0)
Marital status - Native Hawaiian / Pacific Islander population 15 years and over
Males 100.0% Never married0.0% Now married0.0% Separated0.0% Widowed0.0% DivorcedFemales 0.0% Never married100.0% Now married0.0% Separated0.0% Widowed0.0% DivorcedWomen who did not give birth in the past 12 months Now married:
100.0% (15)Unmarried:
0.0% (0)
Marital status - Other race population 15 years and over
Males 3.2% Never married48.4% Now married0.0% Separated0.0% Widowed48.4% DivorcedFemales 0.0% Never married58.8% Now married0.0% Separated0.0% Widowed41.2% DivorcedWomen who did not give birth in the past 12 months Now married:
100.0% (25)Unmarried:
0.0% (0)
Marital status - Two or more races population 15 years and over
Males 24.7% Never married43.4% Now married0.0% Separated31.9% Widowed0.0% DivorcedFemales 33.9% Never married61.4% Now married4.7% Separated0.0% Widowed0.0% DivorcedWomen who gave birth in the past 12 months Now married:
100.0% (58)Unmarried:
0.0% (0)
Women who did not give birth in the past 12 months Now married:
41.0% (72)Unmarried:
59.0% (104)
Marital status - White alone, not Hispanic / Latino population 15 years and over
Males 26.8% Never married61.6% Now married1.1% Separated3.3% Widowed7.2% DivorcedFemales 19.0% Never married51.6% Now married0.8% Separated10.1% Widowed18.4% DivorcedWomen who gave birth in the past 12 months Now married:
100.0% (59)Unmarried:
0.0% (0)
Women who did not give birth in the past 12 months Now married:
48.4% (661)Unmarried:
51.6% (704)
Marital status - Hispanic or Latino population 15 years and over
Males 13.9% Never married83.2% Now married0.0% Separated2.9% Widowed0.0% DivorcedFemales 26.5% Never married73.5% Now married0.0% Separated0.0% Widowed0.0% DivorcedWomen who did not give birth in the past 12 months Now married:
57.7% (101)Unmarried:
42.3% (74)
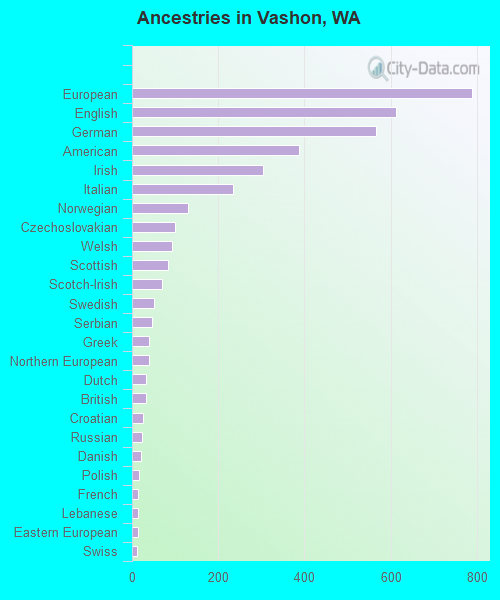
Ancestries in Vashon
789 16.3% European612 12.6% English567 11.7% German387 8.0% American304 6.3% Irish235 4.8% Italian131 2.7% Norwegian99 2.0% Czechoslovakian93 1.9% Welsh83 1.7% Scottish70 1.4% Scotch-Irish51 1.1% Swedish46 0.9% Serbian40 0.8% Greek40 0.8% Northern European33 0.7% Dutch32 0.7% British26 0.5% Croatian23 0.5% Russian20 0.4% Danish17 0.4% Polish14 0.3% French13 0.3% Lebanese13 0.3% Eastern European12 0.2% Swiss9 0.2% Scandinavian8 0.2% Finnish6 0.1% Hungarian5 0.1% Pennsylvania German
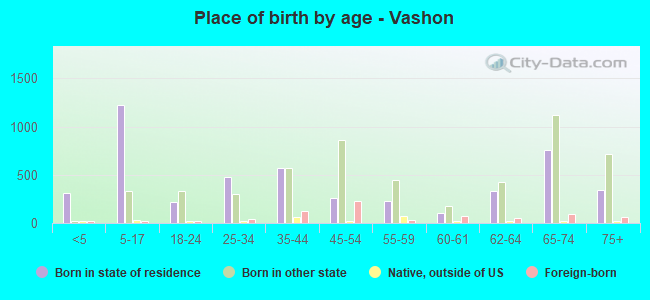
Children Nativity (place of birth) in Vashon
Children under 6 years - Living with two parents Both parents native 247 100.0% NativeChildren under 6 years - Living with one parent Native parent 47 100.0% NativeChildren 6 to 17 years - Living with two parents Both parents native 1,087 100.0% NativeOne native, one foreign-born parent 158 100.0% NativeChildren 6 to 17 years - Living with one parent Native parent 208 100.0% NativeForeign-born parent 28 50.9% Native27 49.1% Foreign-born
Grandparents responsible for own grandchildren in Vashon
Grandparents (30 to 59 years) White / Caucasian 22 41.7% Responsible for grandchildren31 58.3% Not responsible for grandchildrenWhite alone, not Hispanic / Latino 22 39.2% Responsible for grandchildren34 60.8% Not responsible for grandchildrenGrandparents (60 years and over) White / Caucasian 89 44.7% Responsible for grandchildren110 55.3% Not responsible for grandchildrenWhite alone, not Hispanic / Latino 88 44.1% Responsible for grandchildren112 55.9% Not responsible for grandchildren