Races in Visalia, California (CA) Detailed Stats
Data:
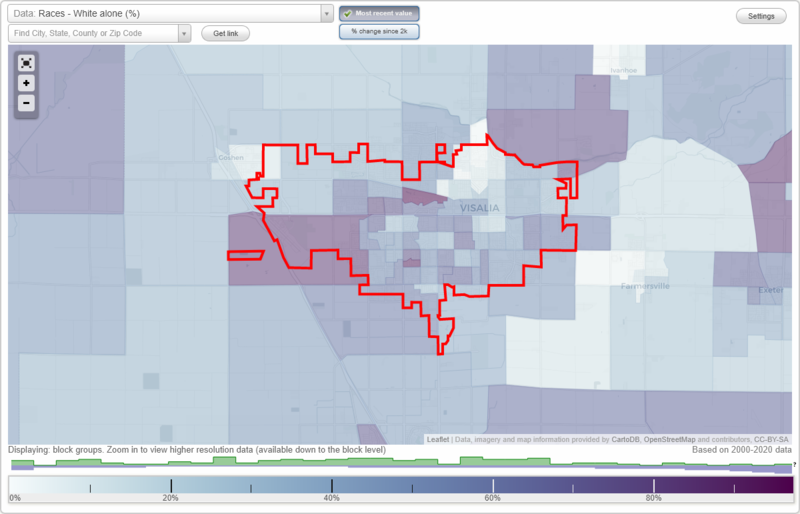
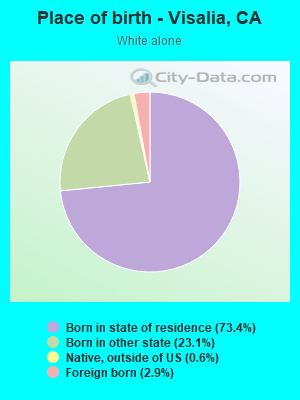
Races - White alone (%)
Races - White alone (% change since 2000)
Races - Black alone (%)
Races - Black alone (% change since 2000)
Races - American Indian alone (%)
Races - American Indian alone (% change since 2000)
Races - Asian alone (%)
Races - Asian alone (% change since 2000)
Races - Hispanic (%)
Races - Hispanic (% change since 2000)
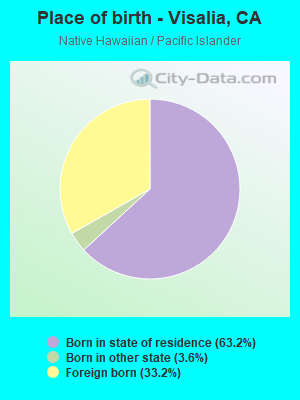
Races - Native Hawaiian and Other Pacific Islander alone (%)
Races - Native Hawaiian and Other Pacific Islander alone (% change since 2000)
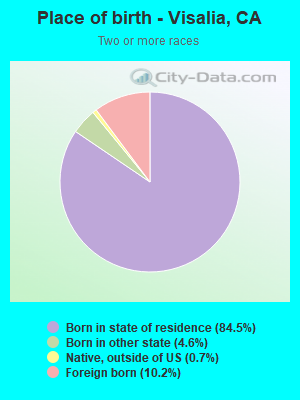
Races - Two or more races(%)
Races - Two or more races(% change since 2000)
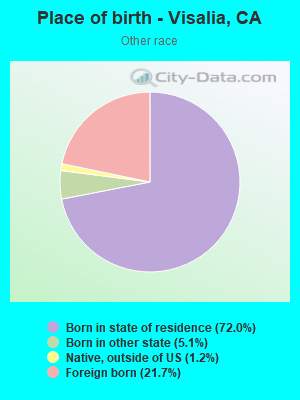
Races - Other race alone (%)
Races - Other race alone (% change since 2000)
Racial diversity
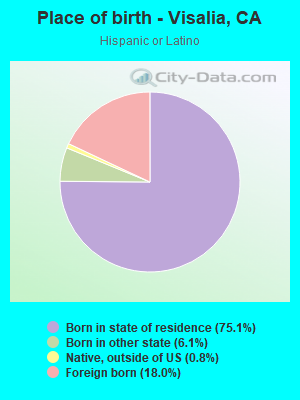
Place of birth - Born in state of residence (%)
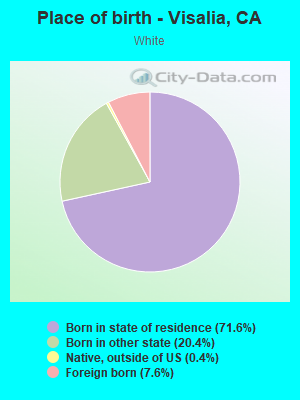
Place of birth - Born in state of residence (%) - White
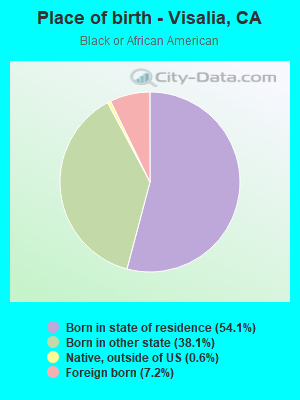
Place of birth - Born in state of residence (%) - Black or African American
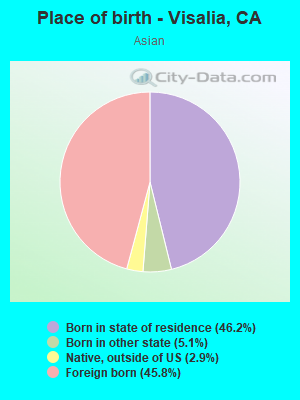
Place of birth - Born in state of residence (%) - Asian
Place of birth - Born in state of residence (%) - Hispanic or Latino
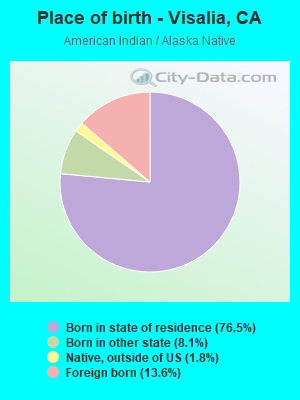
Place of birth - Born in state of residence (%) - American Indian and Alaska Native
Place of birth - Born in state of residence (%) - Multirace
Place of birth - Born in state of residence (%) - Other Race
Place of birth - Born in other state (%)
Place of birth - Born in other state (%) - White
Place of birth - Born in other state (%) - Black or African American
Place of birth - Born in other state (%) - Asian
Place of birth - Born in other state (%) - Hispanic or Latino
Place of birth - Born in other state (%) - American Indian and Alaska Native
Place of birth - Born in other state (%) - Multirace
Place of birth - Born in other state (%) - Other Race
Place of birth - Native, outside of US (%)
Place of birth - Native, outside of US (%) - White
Place of birth - Native, outside of US (%) - Black or African American
Place of birth - Native, outside of US (%) - Asian
Place of birth - Native, outside of US (%) - Hispanic or Latino
Place of birth - Native, outside of US (%) - American Indian and Alaska Native
Place of birth - Native, outside of US (%) - Multirace
Place of birth - Native, outside of US (%) - Other Race
Place of birth - Foreign born (%)
Place of birth - Foreign born (%) - White
Place of birth - Foreign born (%) - Black or African American
Place of birth - Foreign born (%) - Asian
Place of birth - Foreign born (%) - Hispanic or Latino
Place of birth - Foreign born (%) - American Indian and Alaska Native
Place of birth - Foreign born (%) - Multirace
Place of birth - Foreign born (%) - Other Race
Residents speaking English at home (%)
Residents speaking English at home - Born in the United States (%)
Residents speaking English at home - Native, born elsewhere (%)
Residents speaking English at home - Foreign born (%)
Residents speaking Spanish at home (%)
Residents speaking Spanish at home - Born in the United States (%)
Residents speaking Spanish at home - Native, born elsewhere (%)
Residents speaking Spanish at home - Foreign born (%)
Residents speaking other language at home (%)
Residents speaking other language at home - Born in the United States (%)
Residents speaking other language at home - Native, born elsewhere (%)
Residents speaking other language at home - Foreign born (%)
Marital status - Never married (%)
Marital status - Now married (%)
Marital status - Separated (%)
Marital status - Widowed (%)
Marital status - Divorced (%)
Ancestries Reported - Arab (%)
Ancestries Reported - Czech (%)
Ancestries Reported - Danish (%)
Ancestries Reported - Dutch (%)
Ancestries Reported - English (%)
Ancestries Reported - French (%)
Ancestries Reported - French Canadian (%)
Ancestries Reported - German (%)
Ancestries Reported - Greek (%)
Ancestries Reported - Hungarian (%)
Ancestries Reported - Irish (%)
Ancestries Reported - Italian (%)
Ancestries Reported - Lithuanian (%)
Ancestries Reported - Norwegian (%)
Ancestries Reported - Polish (%)
Ancestries Reported - Portuguese (%)
Ancestries Reported - Russian (%)
Ancestries Reported - Scotch-Irish (%)
Ancestries Reported - Scottish (%)
Ancestries Reported - Slovak (%)
Ancestries Reported - Subsaharan African (%)
Ancestries Reported - Swedish (%)
Ancestries Reported - Swiss (%)
Ancestries Reported - Ukrainian (%)
Ancestries Reported - United States (%)
Ancestries Reported - Welsh (%)
Ancestries Reported - West Indian (%)
Ancestries Reported - Other (%)
Geographical mobility - Same house 1 year ago (%)
Geographical mobility - Same house 1 year ago (%) - White
Geographical mobility - Same house 1 year ago (%) - Black or African American
Geographical mobility - Same house 1 year ago (%) - Asian
Geographical mobility - Same house 1 year ago (%) - Hispanic or Latino
Geographical mobility - Same house 1 year ago (%) - American Indian and Alaska Native
Geographical mobility - Same house 1 year ago (%) - Multirace
Geographical mobility - Same house 1 year ago (%) - Other Race
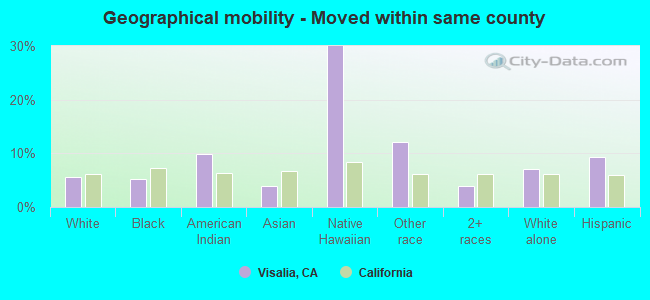
Geographical mobility - Moved within same county (%)
Geographical mobility - Moved within same county (%) - White
Geographical mobility - Moved within same county (%) - Black or African American
Geographical mobility - Moved within same county (%) - Asian
Geographical mobility - Moved within same county (%) - Hispanic or Latino
Geographical mobility - Moved within same county (%) - American Indian and Alaska Native
Geographical mobility - Moved within same county (%) - Multirace
Geographical mobility - Moved within same county (%) - Other Race
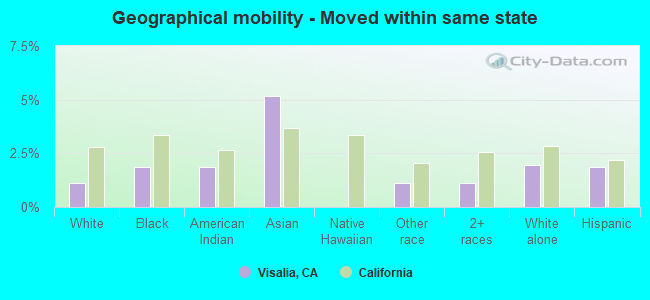
Geographical mobility - Moved from different county within same state (%)
Geographical mobility - Moved from different county within same state (%) - White
Geographical mobility - Moved from different county within same state (%) - Black or African American
Geographical mobility - Moved from different county within same state (%) - Asian
Geographical mobility - Moved from different county within same state (%) - Hispanic or Latino
Geographical mobility - Moved from different county within same state (%) - American Indian and Alaska Native
Geographical mobility - Moved from different county within same state (%) - Multirace
Geographical mobility - Moved from different county within same state (%) - Other Race
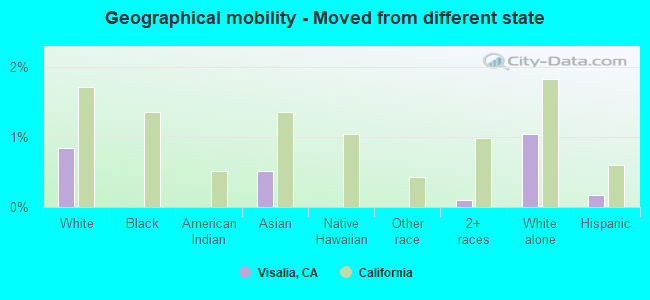
Geographical mobility - Moved from different state (%)
Geographical mobility - Moved from different state (%) - White
Geographical mobility - Moved from different state (%) - Black or African American
Geographical mobility - Moved from different state (%) - Asian
Geographical mobility - Moved from different state (%) - Hispanic or Latino
Geographical mobility - Moved from different state (%) - American Indian and Alaska Native
Geographical mobility - Moved from different state (%) - Multirace
Geographical mobility - Moved from different state (%) - Other Race
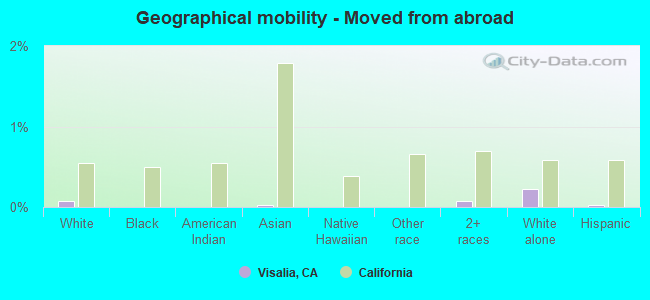
Geographical mobility - Moved from abroad (%)
Geographical mobility - Moved from abroad (%) - White
Geographical mobility - Moved from abroad (%) - Black or African American
Geographical mobility - Moved from abroad (%) - Asian
Geographical mobility - Moved from abroad (%) - Hispanic or Latino
Geographical mobility - Moved from abroad (%) - American Indian and Alaska Native
Geographical mobility - Moved from abroad (%) - Multirace
Geographical mobility - Moved from abroad (%) - Other Race
Place of birth for the foreign-born population - Ireland (%)
Place of birth for the foreign-born population - Denmark (%)
Place of birth for the foreign-born population - Norway (%)
Place of birth for the foreign-born population - Sweden (%)
Place of birth for the foreign-born population - United Kingdom (%)
Place of birth for the foreign-born population - England (%)
Place of birth for the foreign-born population - Scotland (%)
Place of birth for the foreign-born population - Other Northern Europe (%)
Place of birth for the foreign-born population - Austria (%)
Place of birth for the foreign-born population - Belgium (%)
Place of birth for the foreign-born population - France (%)
Place of birth for the foreign-born population - Germany (%)
Place of birth for the foreign-born population - Netherlands (%)
Place of birth for the foreign-born population - Switzerland (%)
Place of birth for the foreign-born population - Other Western Europe (%)
Place of birth for the foreign-born population - Greece (%)
Place of birth for the foreign-born population - Italy (%)
Place of birth for the foreign-born population - Portugal (%)
Place of birth for the foreign-born population - Spain (%)
Place of birth for the foreign-born population - Other Southern Europe (%)
Place of birth for the foreign-born population - Albania (%)
Place of birth for the foreign-born population - Belarus (%)
Place of birth for the foreign-born population - Bosnia and Herzegovina (%)
Place of birth for the foreign-born population - Bulgaria (%)
Place of birth for the foreign-born population - Croatia (%)
Place of birth for the foreign-born population - Czechoslovakia (%)
Place of birth for the foreign-born population - Hungary (%)
Place of birth for the foreign-born population - Latvia (%)
Place of birth for the foreign-born population - Lithuania (%)
Place of birth for the foreign-born population - North Macedonia (Macedonia) (%)
Place of birth for the foreign-born population - Moldova (%)
Place of birth for the foreign-born population - Poland (%)
Place of birth for the foreign-born population - Romania (%)
Place of birth for the foreign-born population - Russia (%)
Place of birth for the foreign-born population - Serbia (%)
Place of birth for the foreign-born population - Ukraine (%)
Place of birth for the foreign-born population - Other Eastern Europe (%)
Place of birth for the foreign-born population - China (%)
Place of birth for the foreign-born population - Hong Kong (%)
Place of birth for the foreign-born population - Taiwan (%)
Place of birth for the foreign-born population - Japan (%)
Place of birth for the foreign-born population - Korea (%)
Place of birth for the foreign-born population - Other Eastern Asia (%)
Place of birth for the foreign-born population - Afghanistan (%)
Place of birth for the foreign-born population - Bangladesh (%)
Place of birth for the foreign-born population - India (%)
Place of birth for the foreign-born population - Iran (%)
Place of birth for the foreign-born population - Kazakhstan (%)
Place of birth for the foreign-born population - Nepal (%)
Place of birth for the foreign-born population - Pakistan (%)
Place of birth for the foreign-born population - Sri Lanka (%)
Place of birth for the foreign-born population - Uzbekistan (%)
Place of birth for the foreign-born population - Other South Central Asia (%)
Place of birth for the foreign-born population - Burma (%)
Place of birth for the foreign-born population - Cambodia (%)
Place of birth for the foreign-born population - Indonesia (%)
Place of birth for the foreign-born population - Laos (%)
Place of birth for the foreign-born population - Malaysia (%)
Place of birth for the foreign-born population - Philippines (%)
Place of birth for the foreign-born population - Singapore (%)
Place of birth for the foreign-born population - Thailand (%)
Place of birth for the foreign-born population - Vietnam (%)
Place of birth for the foreign-born population - Other South Eastern Asia (%)
Place of birth for the foreign-born population - Armenia (%)
Place of birth for the foreign-born population - Iraq (%)
Place of birth for the foreign-born population - Israel (%)
Place of birth for the foreign-born population - Jordan (%)
Place of birth for the foreign-born population - Kuwait (%)
Place of birth for the foreign-born population - Lebanon (%)
Place of birth for the foreign-born population - Saudi Arabia (%)
Place of birth for the foreign-born population - Syria (%)
Place of birth for the foreign-born population - Turkey (%)
Place of birth for the foreign-born population - Yemen (%)
Place of birth for the foreign-born population - Other Western Asia (%)
Place of birth for the foreign-born population - Eritrea (%)
Place of birth for the foreign-born population - Ethiopia (%)
Place of birth for the foreign-born population - Kenya (%)
Place of birth for the foreign-born population - Somalia (%)
Place of birth for the foreign-born population - Uganda (%)
Place of birth for the foreign-born population - Zimbabwe (%)
Place of birth for the foreign-born population - Other Eastern Africa (%)
Place of birth for the foreign-born population - Cameroon (%)
Place of birth for the foreign-born population - Congo (%)
Place of birth for the foreign-born population - Democratic Republic of Congo (Zaire) (%)
Place of birth for the foreign-born population - Other Middle Africa (%)
Place of birth for the foreign-born population - Egypt (%)
Place of birth for the foreign-born population - Morocco (%)
Place of birth for the foreign-born population - Sudan (%)
Place of birth for the foreign-born population - Other Northern Africa (%)
Place of birth for the foreign-born population - South Africa (%)
Place of birth for the foreign-born population - Other Southern Africa (%)
Place of birth for the foreign-born population - Cabo Verde (%)
Place of birth for the foreign-born population - Ghana (%)
Place of birth for the foreign-born population - Liberia (%)
Place of birth for the foreign-born population - Nigeria (%)
Place of birth for the foreign-born population - Senegal (%)
Place of birth for the foreign-born population - Sierra Leone (%)
Place of birth for the foreign-born population - Other Western Africa (%)
Place of birth for the foreign-born population - Australia (%)
Place of birth for the foreign-born population - New Zealand (%)
Place of birth for the foreign-born population - Fiji (%)
Place of birth for the foreign-born population - Micronesia (%)
Place of birth for the foreign-born population - Bahamas (%)
Place of birth for the foreign-born population - Barbados (%)
Place of birth for the foreign-born population - Cuba (%)
Place of birth for the foreign-born population - Dominica (%)
Place of birth for the foreign-born population - Dominican Republic (%)
Place of birth for the foreign-born population - Grenada (%)
Place of birth for the foreign-born population - Haiti (%)
Place of birth for the foreign-born population - Jamaica (%)
Place of birth for the foreign-born population - St. Vincent and the Grenadines (%)
Place of birth for the foreign-born population - Trinidad and Tobago (%)
Place of birth for the foreign-born population - West Indies (%)
Place of birth for the foreign-born population - Other Caribbean (%)
Place of birth for the foreign-born population - Belize (%)
Place of birth for the foreign-born population - Costa Rica (%)
Place of birth for the foreign-born population - El Salvador (%)
Place of birth for the foreign-born population - Guatemala (%)
Place of birth for the foreign-born population - Honduras (%)
Place of birth for the foreign-born population - Mexico (%)
Place of birth for the foreign-born population - Nicaragua (%)
Place of birth for the foreign-born population - Panama (%)
Place of birth for the foreign-born population - Other Central America (%)
Place of birth for the foreign-born population - Argentina (%)
Place of birth for the foreign-born population - Bolivia (%)
Place of birth for the foreign-born population - Brazil (%)
Place of birth for the foreign-born population - Chile (%)
Place of birth for the foreign-born population - Colombia (%)
Place of birth for the foreign-born population - Ecuador (%)
Place of birth for the foreign-born population - Guyana (%)
Place of birth for the foreign-born population - Peru (%)
Place of birth for the foreign-born population - Uruguay (%)
Place of birth for the foreign-born population - Venezuela (%)
Place of birth for the foreign-born population - Other South America (%)
Place of birth for the foreign-born population - Canada (%)
Place of birth for the foreign-born population - Other Northern America (%)
Place of birth for the foreign-born population - Other (%)
Latest news about races in Visalia, CA collected exclusively by city-data.com from local newspapers, TV, and radio stations
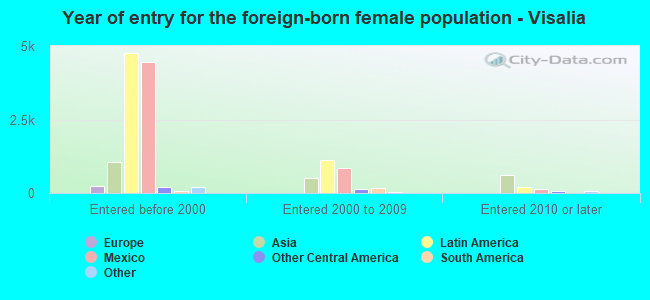
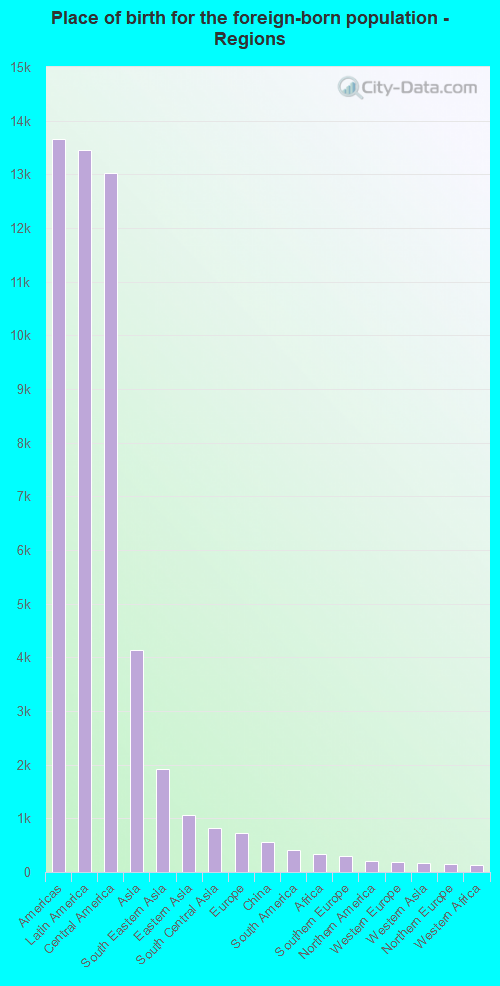
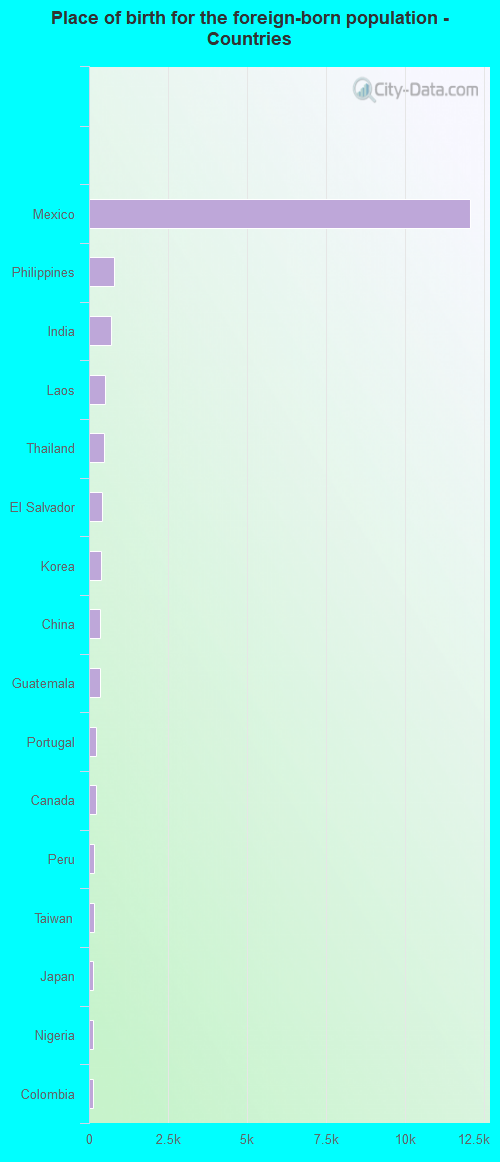
According to 2022 data, the most numerous races in Visalia, CA are Hispanic (74,816 residents), White alone (44,915 residents), and Asian alone (8,221 residents). 65.1% of Visalia residents speak English at home. 14.1% of Visalia, CA residents are foreign-born (10.0% born in Latin America, 3.1% born in Asia), which is 83.8% less than the foreign-born rate of 26.0% across the entire state of California.
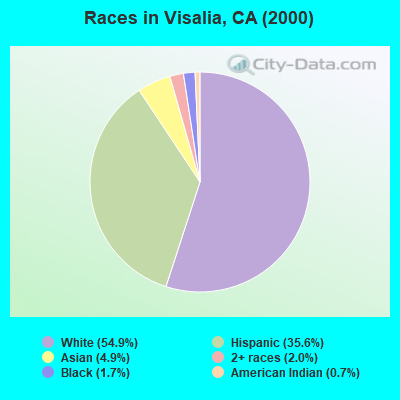
Race distribution in Visalia
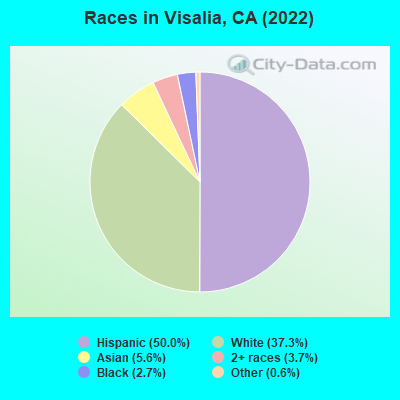
2000 2022
50,269 54.9% White alone 32,619 35.6% Hispanic 4,472 4.9% Asian alone 1,806 2.0% Two or more races 1,558 1.7% Black alone 675 0.7% American Indian alone 87 0.10% Other race alone 79 0.09% Native Hawaiian and Other
74,816 55.5% Hispanic 44,915 33.3% White alone 8,221 6.1% Asian alone 3,042 2.3% Black alone 2,643 2.0% Two or more races 502 0.4% American Indian alone 83 0.06% Native Hawaiian and Other
2000 2022
15,816,790 46.7% White alone 10,966,556 32.4% Hispanic 3,648,860 10.8% Asian alone 2,181,926 6.4% Black alone 903,115 2.7% Two or more races 178,984 0.5% American Indian alone 103,736 0.3% Native Hawaiian and Other 71,681 0.2% Other race alone
15,732,184 40.3% Hispanic 13,160,426 33.7% White alone 5,957,867 15.3% Asian alone 2,025,218 5.2% Black alone 1,663,222 4.3% Two or more races 251,618 0.6% Other race alone 135,777 0.3% Native Hawaiian and Other 103,030 0.3% American Indian alone
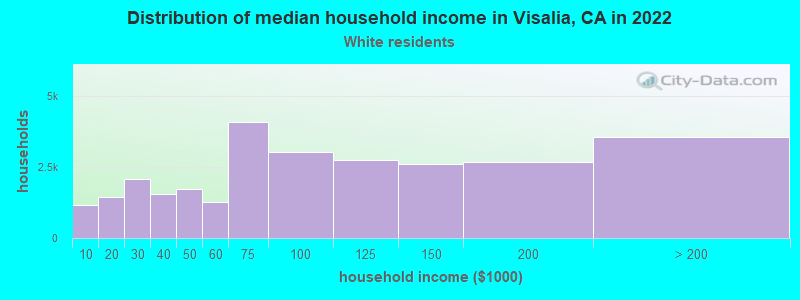
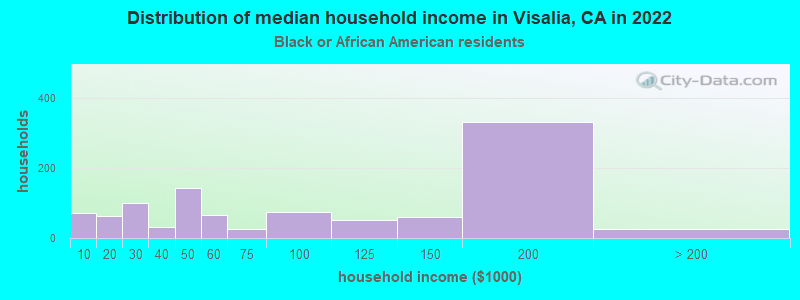
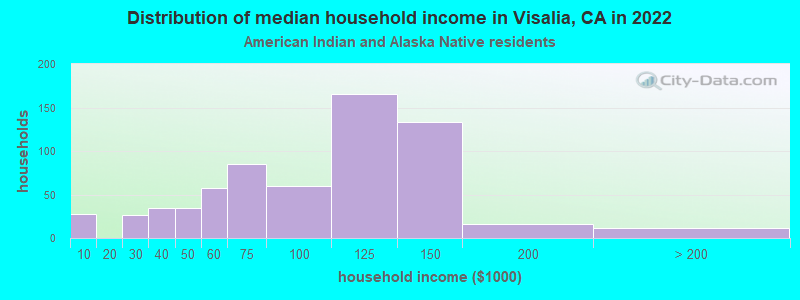
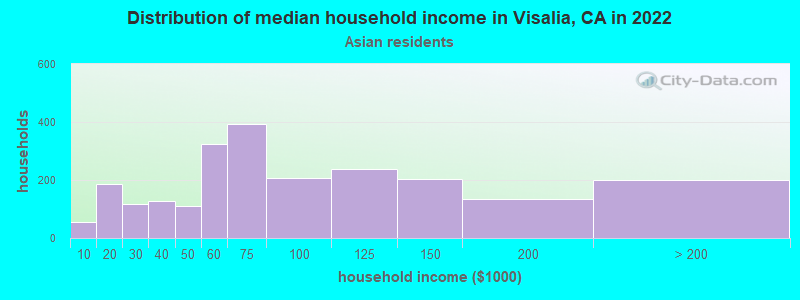
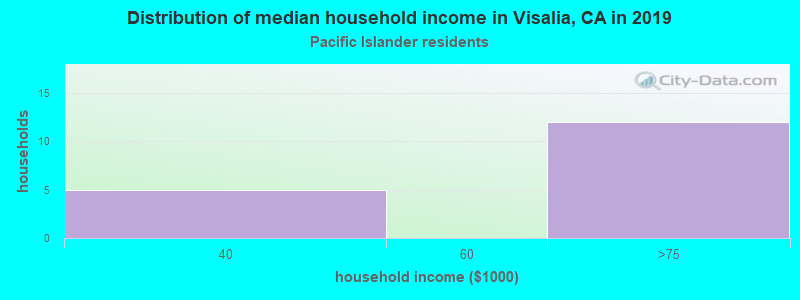
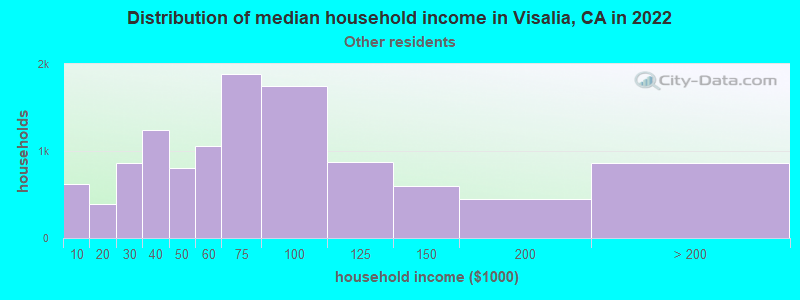
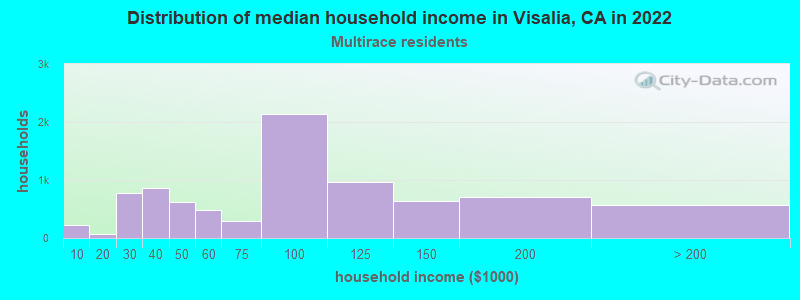
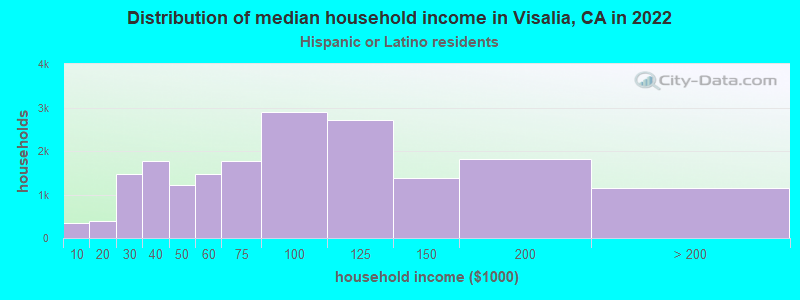
Income and house value in Visalia Median household income in 2022 $67,643 White non-Hispanic householders$51,328 Black householders$110,211 American Indian and Alaska Native householders$87,478 Asian householders$3,775 Native Hawaiian and other Pacific Islander householders$75,698 Some other race householders$98,351 Two or more races householders$77,550 Hispanic or Latino race householdersMedian 2022 house value $434,075 White Non-Hispanic householders$473,307 Black or African American householders$400,961 American Indian or Alaska Native householders $445,592 Asian householders$323,936 Some other race householders$410,679 Two or more races householders$337,973 Hispanic or Latino householders
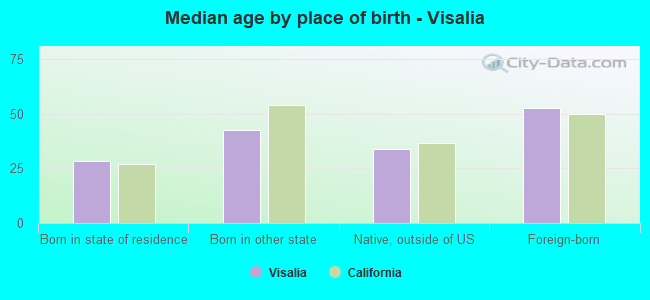
Median age by race in Visalia
36.6 Median age for White residents34.4 39.3 23.8 Median age for Black or African American residents17.8 42.0 39.7 Median age for American Indian / Alaska Native residents43.6 30.5 35.7 Median age for Asian residents36.5 30.7 51.9 Median age for Native Hawaiian / Pacific Islander residents20.4 53.7 33.6 Median age for Other race residents33.9 32.9 39.2 Median age for Two or more races residents39.7 37.0 42.5 Median age for White alone residents39.9 45.3 31.3 Median age for Hispanic or Latino residents32.0 30.2
Owner/renter occupied households by race in Visalia
House owners and renters - White residents 15,153 60.3% Owner occupied9,965 39.7% Renter occupiedHouse owners and renters - Black or African American residents 370 34.1% Owner occupied714 65.9% Renter occupiedHouse owners and renters - American Indian / Alaska Native residents 379 62.6% Owner occupied226 37.4% Renter occupiedHouse owners and renters - Asian residents 1,337 53.4% Owner occupied1,168 46.6% Renter occupiedHouse owners and renters - Native Hawaiian / Pacific Islander residents 11 66.4% Owner occupied6 33.6% Renter occupiedHouse owners and renters - Other race residents 8,196 57.6% Owner occupied6,044 42.4% Renter occupiedHouse owners and renters - Two or more races residents 2,267 58.2% Owner occupied1,625 41.8% Renter occupiedHouse owners and renters - White alone residents 11,630 59.0% Owner occupied8,098 41.0% Renter occupiedHouse owners and renters - Hispanic or Latino residents 13,153 57.8% Owner occupied9,588 42.2% Renter occupied
Language usage in Visalia
English speakers - Total 65.1% of residents of Visalia speak English at home.
29.7% of residents speak Spanish at home 23,087 64.1% Speak English very well12,932 35.9% Speak English less than very well5.2% of residents speak other language at home 3,869 60.9% Speak English very well2,486 39.1% Speak English less than very well
English speakers - Born in the United States 83.3% of residents of Visalia speak English at home.
14.5% of residents speak Spanish at home 1,765 73.8% Speak English very well627 26.2% Speak English less than very well2.0% of residents speak other language at home 296 90.5% Speak English very well31 9.5% Speak English less than very well
English speakers - Native, born elsewhere 52.4% of residents of Visalia speak English at home.
31.9% of residents speak Spanish at home 279 79.0% Speak English very well74 21.0% Speak English less than very well15.8% of residents speak other language at home 156 89.1% Speak English very well19 10.9% Speak English less than very well
English speakers - Foreign-born 10.0% of residents of Visalia speak English at home.
66.3% of residents speak Spanish at home 4,248 34.7% Speak English very well7,995 65.3% Speak English less than very well22.5% of residents speak other language at home 1,946 46.9% Speak English very well2,207 53.1% Speak English less than very well
White (Caucasian) - Speak only English Native:
84.8% (44,822)Foreign-born:
24.0% (1,146)
White (Caucasian) - Speak another language Native:
15.2% (8,026)Foreign-born:
77.8% (3,714)
Black or African American - Speak only English Native:
94.6% (2,175)Foreign-born:
47.2% (98)
Black or African American - Speak another language Native:
5.5% (127)Foreign-born:
50.8% (105)
American Indian / Alaska Native - Speak only English Native:
67.8% (1,036)Foreign-born:
4.3% (11)
American Indian / Alaska Native - Speak another language Native:
27.4% (419)Foreign-born:
95.9% (251)
Asian - Speak only English Native:
55.7% (2,985)Foreign-born:
15.3% (430)
Asian - Speak another language Native:
44.1% (2,365)Foreign-born:
85.1% (2,390)
Native Hawaiian / Pacific Islander - Speak only English Native:
83.9% (59)Foreign-born:
93.2% (44)
Native Hawaiian / Pacific Islander - Speak another language Native:
18.8% (13)Foreign-born:
25.4% (12)
Other race - Speak only English Native:
35.8% (11,415)Foreign-born:
0.5% (52)
Other race - Speak another language Native:
64.8% (20,635)Foreign-born:
98.0% (11,100)
Two or more races - Speak only English Native:
63.3% (7,144)Foreign-born:
11.4% (180)
Two or more races - Speak another language Native:
38.2% (4,314)Foreign-born:
86.9% (1,379)
White alone - Speak only English Native:
95.6% (38,999)Foreign-born:
32.8% (545)
White alone - Speak another language Native:
4.3% (1,774)Foreign-born:
67.2% (1,118)
Hispanic or Latino - Speak only English Native:
43.0% (22,690)Foreign-born:
6.3% (981)
Hispanic or Latino - Speak another language Native:
57.1% (30,129)Foreign-born:
93.9% (14,732)
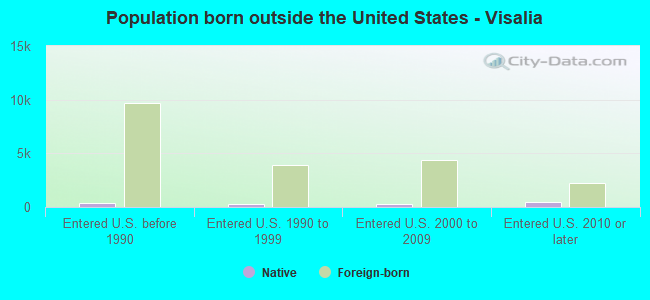
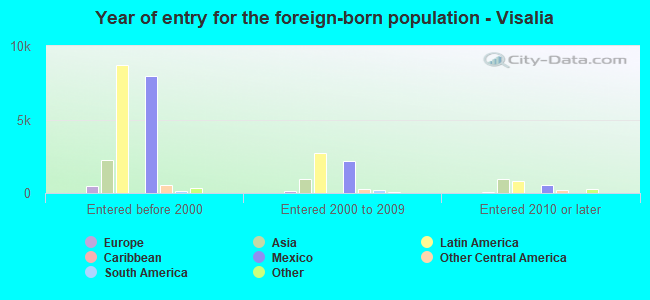
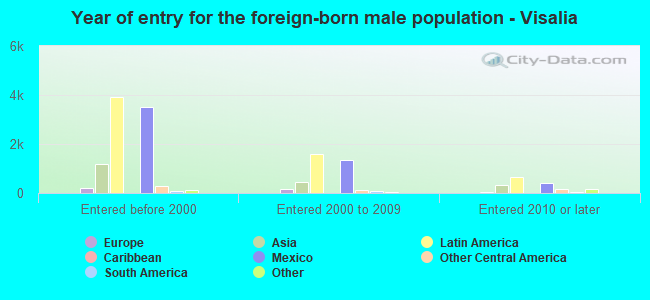
Foreign-born residents in Visalia 18,900 residents are foreign born (10.0% Latin America , 3.1% Asia ).
This city:
14.1%California:
100.0%
Marital status for residents in Visalia Marital status - White (Caucasian) population 15 years and over
Males 32.3% Never married54.1% Now married0.6% Separated1.8% Widowed11.3% DivorcedFemales 24.3% Never married46.3% Now married2.4% Separated9.5% Widowed17.5% DivorcedWomen who gave birth in the past 12 months Now married:
86.9% (1,361)Unmarried:
13.1% (206)
Women who did not give birth in the past 12 months Now married:
45.8% (5,378)Unmarried:
54.2% (6,363)
Marital status - Black or African American population 15 years and over
Males 46.7% Never married42.1% Now married2.5% Separated0.0% Widowed8.7% DivorcedFemales 52.5% Never married21.6% Now married0.0% Separated3.6% Widowed22.3% DivorcedWomen who gave birth in the past 12 months Now married:
39.4% (35)Unmarried:
60.6% (54)
Women who did not give birth in the past 12 months Now married:
22.0% (147)Unmarried:
78.0% (519)
Marital status - American Indian / Alaska Native population 15 years and over
Males 42.0% Never married46.1% Now married1.9% Separated0.7% Widowed9.3% DivorcedFemales 27.0% Never married44.8% Now married8.0% Separated10.0% Widowed10.2% DivorcedWomen who gave birth in the past 12 months Now married:
17.1% (9)Unmarried:
82.9% (42)
Women who did not give birth in the past 12 months Now married:
49.7% (228)Unmarried:
50.3% (231)
Marital status - Asian population 15 years and over
Males 38.4% Never married51.3% Now married2.0% Separated0.0% Widowed8.4% DivorcedFemales 34.4% Never married54.0% Now married0.0% Separated3.3% Widowed8.2% DivorcedWomen who gave birth in the past 12 months Now married:
70.6% (22)Unmarried:
29.4% (9)
Women who did not give birth in the past 12 months Now married:
47.2% (863)Unmarried:
52.8% (967)
Marital status - Native Hawaiian / Pacific Islander population 15 years and over
Males 66.0% Never married23.4% Now married0.0% Separated0.0% Widowed10.6% DivorcedFemales 15.9% Never married69.6% Now married0.0% Separated14.5% Widowed0.0% DivorcedWomen who did not give birth in the past 12 months Now married:
73.2% (29)Unmarried:
26.8% (11)
Marital status - Other race population 15 years and over
Males 49.5% Never married44.4% Now married0.0% Separated0.2% Widowed6.0% DivorcedFemales 31.6% Never married50.7% Now married5.5% Separated1.9% Widowed10.4% DivorcedWomen who gave birth in the past 12 months Now married:
43.9% (297)Unmarried:
56.1% (379)
Women who did not give birth in the past 12 months Now married:
43.1% (4,624)Unmarried:
56.9% (6,094)
Marital status - Two or more races population 15 years and over
Males 44.0% Never married49.8% Now married2.4% Separated1.9% Widowed1.8% DivorcedFemales 43.5% Never married41.6% Now married1.4% Separated2.9% Widowed10.5% DivorcedWomen who gave birth in the past 12 months Now married:
6.5% (40)Unmarried:
93.5% (573)
Women who did not give birth in the past 12 months Now married:
39.3% (1,927)Unmarried:
60.7% (2,981)
Marital status - White alone, not Hispanic / Latino population 15 years and over
Males 28.1% Never married56.5% Now married0.0% Separated2.5% Widowed12.9% DivorcedFemales 21.3% Never married46.1% Now married1.6% Separated10.9% Widowed20.1% DivorcedWomen who gave birth in the past 12 months Now married:
100.0% (948)Unmarried:
0.0% (0)
Women who did not give birth in the past 12 months Now married:
47.1% (4,095)Unmarried:
52.9% (4,594)
Marital status - Hispanic or Latino population 15 years and over
Males 44.5% Never married47.2% Now married0.6% Separated0.4% Widowed7.3% DivorcedFemales 32.9% Never married48.6% Now married4.6% Separated3.4% Widowed10.6% DivorcedWomen who gave birth in the past 12 months Now married:
49.2% (997)Unmarried:
50.8% (1,028)
Women who did not give birth in the past 12 months Now married:
44.5% (7,389)Unmarried:
55.5% (9,230)
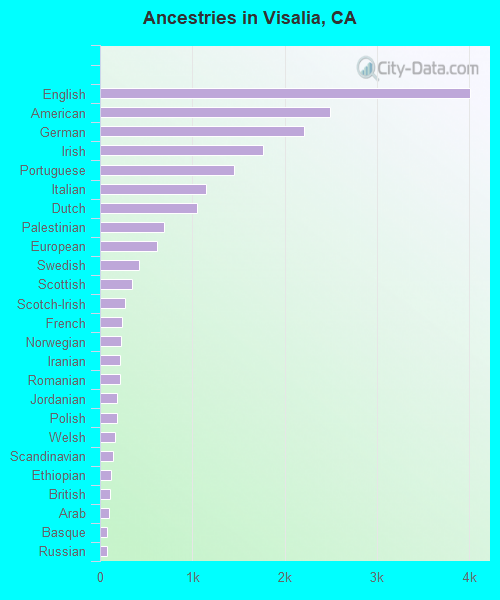
Ancestries in Visalia
2,298 2.8% American1,771 2.1% English1,471 1.8% German1,326 1.6% Irish1,146 1.4% Portuguese968 1.2% European689 0.8% Italian520 0.6% Dutch368 0.4% Scottish295 0.4% Northern European242 0.3% British205 0.2% Swedish199 0.2% Scotch-Irish198 0.2% Armenian196 0.2% Nigerian195 0.2% Scandinavian187 0.2% Norwegian183 0.2% Polish139 0.2% Egyptian134 0.2% French122 0.1% Welsh113 0.1% Jordanian80 0.10% Russian71 0.09% Danish68 0.08% Arab66 0.08% Eastern European56 0.07% Lebanese52 0.06% Ethiopian49 0.06% African40 0.05% Finnish37 0.04% Brazilian30 0.04% French Canadian28 0.03% Canadian28 0.03% Czech26 0.03% Belizean25 0.03% Palestinian23 0.03% Romanian23 0.03% Greek21 0.03% Swiss20 0.02% Czechoslovakian20 0.02% Trinidadian and Tobagonian18 0.02% Basque15 0.02% Iranian14 0.02% Israeli13 0.02% Pennsylvania German13 0.02% Slovak12 0.01% Belgian10 0.01% New Zealander7 0.01% Dutch West Indian
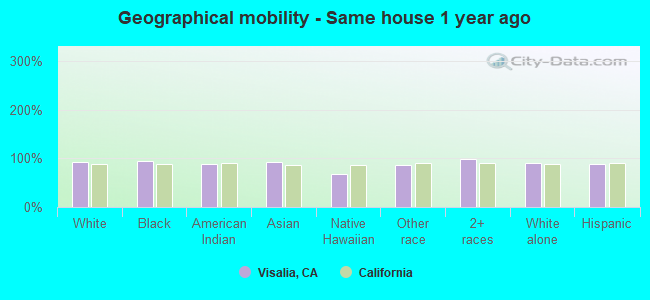
Geographical mobility in Visalia Same house 1 year ago 56,151 92.6% White (Caucasian)2,618 94.0% Black or African American1,732 88.4% American Indian / Alaska Native7,573 92.2% Asian79 67.2% Native Hawaiian / Pacific Islander38,291 85.5% Other race14,713 98.2% Two or more races42,805 89.9% White alone, not Hispanic / Latino60,990 88.1% Hispanic or LatinoMoved within same county 3,375 5.6% White / Caucasian143 5.1% Black or African American193 9.8% American Indian / Alaska Native316 3.8% Asian35 29.9% Native Hawaiian / Pacific Islander5,421 12.1% Other race578 3.9% Two or more races3,334 7.0% White alone, not Hispanic / Latino6,431 9.3% Hispanic or LatinoMoved within same state 672 1.1% White / Caucasian51 1.8% Black or African American36 1.9% American Indian / Alaska Native423 5.2% Asian510 1.1% Other race168 1.1% Two or more races939 2.0% White alone, not Hispanic / Latino1,304 1.9% Hispanic or LatinoMoved from different state 507 0.8% White / Caucasian43 0.5% Asian15 0.1% Two or more races499 1.0% White alone, not Hispanic / Latino120 0.2% Hispanic or LatinoMoved from abroad 47 0.1% White2 0.0% Asian11 0.1% Two or more races108 0.2% White alone, not Hispanic / Latino18 0.0% Hispanic or Latino
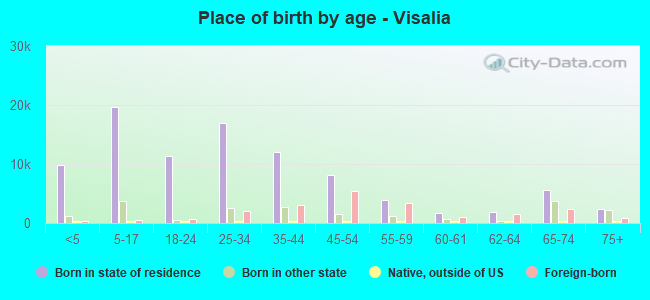
Children Nativity (place of birth) in Visalia
Children under 6 years - Living with two parents Both parents native 4,787 100.0% NativeBoth parents foreign-born 1,007 100.0% NativeOne native, one foreign-born parent 2,004 100.0% NativeChildren under 6 years - Living with one parent Native parent 4,069 100.0% NativeForeign-born parent 379 100.0% NativeChildren 6 to 17 years - Living with two parents Both parents native 9,261 100.0% NativeBoth parents foreign-born 1,353 82.5% Native287 17.5% Foreign-bornOne native, one foreign-born parent 1,941 100.0% NativeChildren 6 to 17 years - Living with one parent Native parent 6,961 100.0% NativeForeign-born parent 2,406 50.7% Native2,336 49.3% Foreign-born
Grandparents responsible for own grandchildren in Visalia
Grandparents (30 to 59 years) White / Caucasian 105 18.5% Responsible for grandchildren465 81.5% Not responsible for grandchildrenBlack or African American 33 34.8% Responsible for grandchildren62 65.2% Not responsible for grandchildrenAmerican Indian / Alaska Native 110 100.0% Not responsible for grandchildrenAsian 2 1.9% Responsible for grandchildren87 98.1% Not responsible for grandchildrenOther race 37 18.5% Responsible for grandchildren161 81.5% Not responsible for grandchildrenTwo or more races 823 100.0% Not responsible for grandchildrenWhite alone, not Hispanic / Latino 28 11.4% Responsible for grandchildren215 88.6% Not responsible for grandchildrenHispanic or Latino 123 14.8% Responsible for grandchildren707 85.2% Not responsible for grandchildrenGrandparents (60 years and over) White / Caucasian 357 48.8% Responsible for grandchildren374 51.2% Not responsible for grandchildrenAmerican Indian / Alaska Native 49 27.0% Responsible for grandchildren132 73.0% Not responsible for grandchildrenAsian 2 1.7% Responsible for grandchildren104 98.3% Not responsible for grandchildrenOther race 116 37.8% Responsible for grandchildren190 62.2% Not responsible for grandchildrenTwo or more races 67 42.2% Responsible for grandchildren92 57.8% Not responsible for grandchildrenWhite alone, not Hispanic / Latino 196 28.4% Responsible for grandchildren493 71.6% Not responsible for grandchildrenHispanic or Latino 491 100.0% Not responsible for grandchildren