Races in Waihee-Waiehu, Hawaii (HI) Detailed Stats
Data:
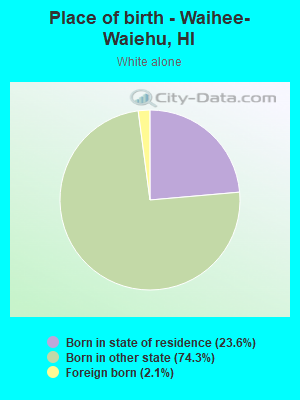
Races - White alone (%)
Races - White alone (% change since 2000)
Races - Black alone (%)
Races - Black alone (% change since 2000)
Races - American Indian alone (%)
Races - American Indian alone (% change since 2000)
Races - Asian alone (%)
Races - Asian alone (% change since 2000)
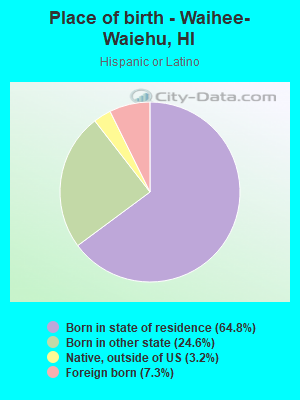
Races - Hispanic (%)
Races - Hispanic (% change since 2000)
Races - Native Hawaiian and Other Pacific Islander alone (%)
Races - Native Hawaiian and Other Pacific Islander alone (% change since 2000)
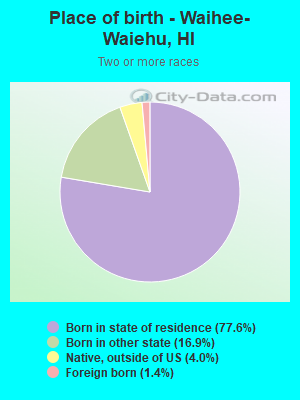
Races - Two or more races(%)
Races - Two or more races(% change since 2000)
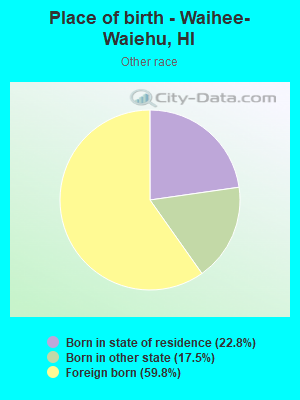
Races - Other race alone (%)
Races - Other race alone (% change since 2000)
Racial diversity
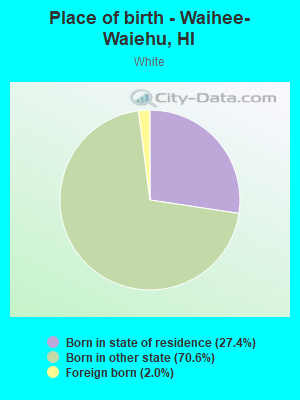
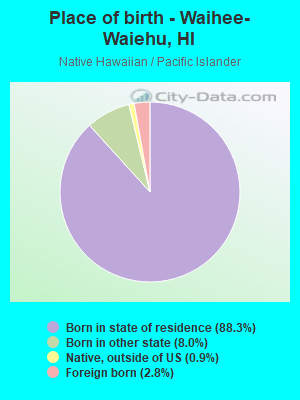
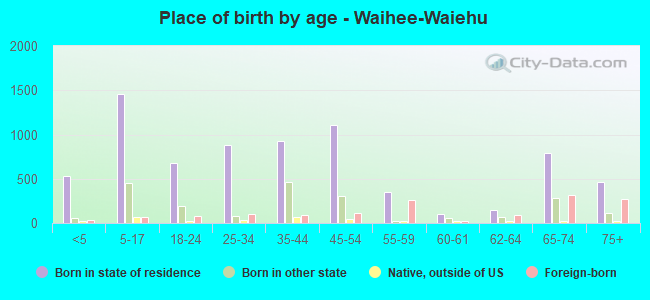
Place of birth - Born in state of residence (%)
Place of birth - Born in state of residence (%) - White
Place of birth - Born in state of residence (%) - Black or African American
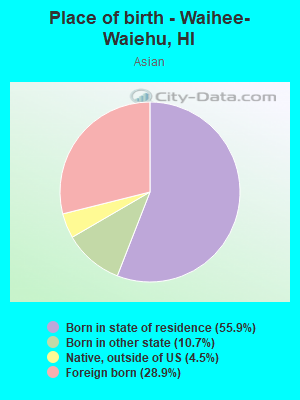
Place of birth - Born in state of residence (%) - Asian
Place of birth - Born in state of residence (%) - Hispanic or Latino
Place of birth - Born in state of residence (%) - American Indian and Alaska Native
Place of birth - Born in state of residence (%) - Multirace
Place of birth - Born in state of residence (%) - Other Race
Place of birth - Born in other state (%)
Place of birth - Born in other state (%) - White
Place of birth - Born in other state (%) - Black or African American
Place of birth - Born in other state (%) - Asian
Place of birth - Born in other state (%) - Hispanic or Latino
Place of birth - Born in other state (%) - American Indian and Alaska Native
Place of birth - Born in other state (%) - Multirace
Place of birth - Born in other state (%) - Other Race
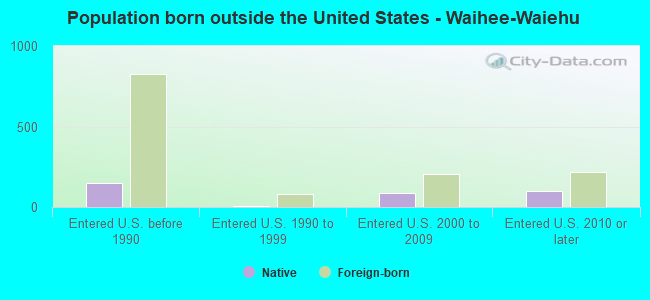
Place of birth - Native, outside of US (%)
Place of birth - Native, outside of US (%) - White
Place of birth - Native, outside of US (%) - Black or African American
Place of birth - Native, outside of US (%) - Asian
Place of birth - Native, outside of US (%) - Hispanic or Latino
Place of birth - Native, outside of US (%) - American Indian and Alaska Native
Place of birth - Native, outside of US (%) - Multirace
Place of birth - Native, outside of US (%) - Other Race
Place of birth - Foreign born (%)
Place of birth - Foreign born (%) - White
Place of birth - Foreign born (%) - Black or African American
Place of birth - Foreign born (%) - Asian
Place of birth - Foreign born (%) - Hispanic or Latino
Place of birth - Foreign born (%) - American Indian and Alaska Native
Place of birth - Foreign born (%) - Multirace
Place of birth - Foreign born (%) - Other Race
Residents speaking English at home (%)
Residents speaking English at home - Born in the United States (%)
Residents speaking English at home - Native, born elsewhere (%)
Residents speaking English at home - Foreign born (%)
Residents speaking Spanish at home (%)
Residents speaking Spanish at home - Born in the United States (%)
Residents speaking Spanish at home - Native, born elsewhere (%)
Residents speaking Spanish at home - Foreign born (%)
Residents speaking other language at home (%)
Residents speaking other language at home - Born in the United States (%)
Residents speaking other language at home - Native, born elsewhere (%)
Residents speaking other language at home - Foreign born (%)
Marital status - Never married (%)
Marital status - Now married (%)
Marital status - Separated (%)
Marital status - Widowed (%)
Marital status - Divorced (%)
Ancestries Reported - Arab (%)
Ancestries Reported - Czech (%)
Ancestries Reported - Danish (%)
Ancestries Reported - Dutch (%)
Ancestries Reported - English (%)
Ancestries Reported - French (%)
Ancestries Reported - French Canadian (%)
Ancestries Reported - German (%)
Ancestries Reported - Greek (%)
Ancestries Reported - Hungarian (%)
Ancestries Reported - Irish (%)
Ancestries Reported - Italian (%)
Ancestries Reported - Lithuanian (%)
Ancestries Reported - Norwegian (%)
Ancestries Reported - Polish (%)
Ancestries Reported - Portuguese (%)
Ancestries Reported - Russian (%)
Ancestries Reported - Scotch-Irish (%)
Ancestries Reported - Scottish (%)
Ancestries Reported - Slovak (%)
Ancestries Reported - Subsaharan African (%)
Ancestries Reported - Swedish (%)
Ancestries Reported - Swiss (%)
Ancestries Reported - Ukrainian (%)
Ancestries Reported - United States (%)
Ancestries Reported - Welsh (%)
Ancestries Reported - West Indian (%)
Ancestries Reported - Other (%)
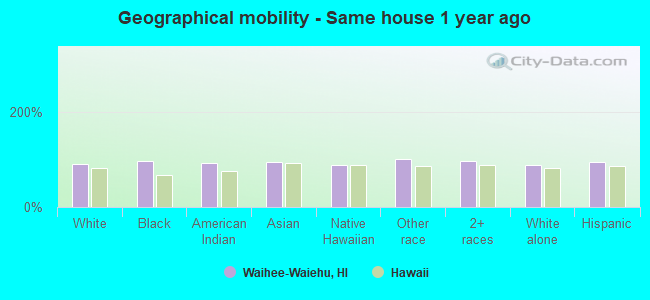
Geographical mobility - Same house 1 year ago (%)
Geographical mobility - Same house 1 year ago (%) - White
Geographical mobility - Same house 1 year ago (%) - Black or African American
Geographical mobility - Same house 1 year ago (%) - Asian
Geographical mobility - Same house 1 year ago (%) - Hispanic or Latino
Geographical mobility - Same house 1 year ago (%) - American Indian and Alaska Native
Geographical mobility - Same house 1 year ago (%) - Multirace
Geographical mobility - Same house 1 year ago (%) - Other Race
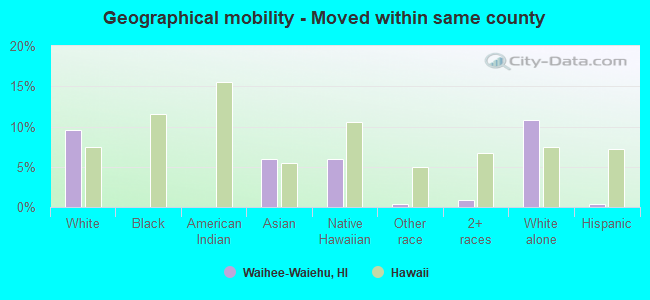
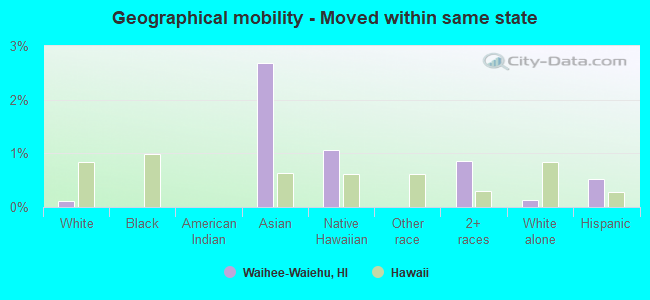
Geographical mobility - Moved within same county (%)
Geographical mobility - Moved within same county (%) - White
Geographical mobility - Moved within same county (%) - Black or African American
Geographical mobility - Moved within same county (%) - Asian
Geographical mobility - Moved within same county (%) - Hispanic or Latino
Geographical mobility - Moved within same county (%) - American Indian and Alaska Native
Geographical mobility - Moved within same county (%) - Multirace
Geographical mobility - Moved within same county (%) - Other Race
Geographical mobility - Moved from different county within same state (%)
Geographical mobility - Moved from different county within same state (%) - White
Geographical mobility - Moved from different county within same state (%) - Black or African American
Geographical mobility - Moved from different county within same state (%) - Asian
Geographical mobility - Moved from different county within same state (%) - Hispanic or Latino
Geographical mobility - Moved from different county within same state (%) - American Indian and Alaska Native
Geographical mobility - Moved from different county within same state (%) - Multirace
Geographical mobility - Moved from different county within same state (%) - Other Race
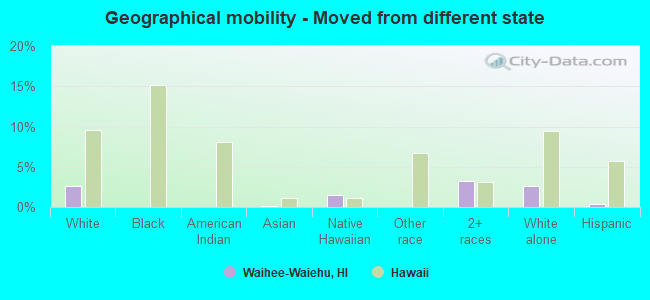
Geographical mobility - Moved from different state (%)
Geographical mobility - Moved from different state (%) - White
Geographical mobility - Moved from different state (%) - Black or African American
Geographical mobility - Moved from different state (%) - Asian
Geographical mobility - Moved from different state (%) - Hispanic or Latino
Geographical mobility - Moved from different state (%) - American Indian and Alaska Native
Geographical mobility - Moved from different state (%) - Multirace
Geographical mobility - Moved from different state (%) - Other Race
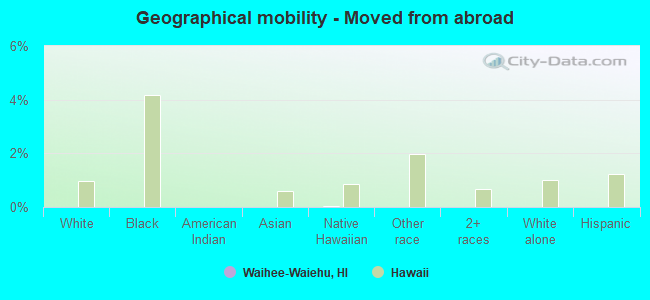
Geographical mobility - Moved from abroad (%)
Geographical mobility - Moved from abroad (%) - White
Geographical mobility - Moved from abroad (%) - Black or African American
Geographical mobility - Moved from abroad (%) - Asian
Geographical mobility - Moved from abroad (%) - Hispanic or Latino
Geographical mobility - Moved from abroad (%) - American Indian and Alaska Native
Geographical mobility - Moved from abroad (%) - Multirace
Geographical mobility - Moved from abroad (%) - Other Race
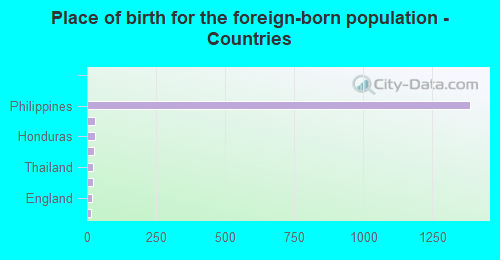
Place of birth for the foreign-born population - Ireland (%)
Place of birth for the foreign-born population - Denmark (%)
Place of birth for the foreign-born population - Norway (%)
Place of birth for the foreign-born population - Sweden (%)
Place of birth for the foreign-born population - United Kingdom (%)
Place of birth for the foreign-born population - England (%)
Place of birth for the foreign-born population - Scotland (%)
Place of birth for the foreign-born population - Other Northern Europe (%)
Place of birth for the foreign-born population - Austria (%)
Place of birth for the foreign-born population - Belgium (%)
Place of birth for the foreign-born population - France (%)
Place of birth for the foreign-born population - Germany (%)
Place of birth for the foreign-born population - Netherlands (%)
Place of birth for the foreign-born population - Switzerland (%)
Place of birth for the foreign-born population - Other Western Europe (%)
Place of birth for the foreign-born population - Greece (%)
Place of birth for the foreign-born population - Italy (%)
Place of birth for the foreign-born population - Portugal (%)
Place of birth for the foreign-born population - Spain (%)
Place of birth for the foreign-born population - Other Southern Europe (%)
Place of birth for the foreign-born population - Albania (%)
Place of birth for the foreign-born population - Belarus (%)
Place of birth for the foreign-born population - Bosnia and Herzegovina (%)
Place of birth for the foreign-born population - Bulgaria (%)
Place of birth for the foreign-born population - Croatia (%)
Place of birth for the foreign-born population - Czechoslovakia (%)
Place of birth for the foreign-born population - Hungary (%)
Place of birth for the foreign-born population - Latvia (%)
Place of birth for the foreign-born population - Lithuania (%)
Place of birth for the foreign-born population - North Macedonia (Macedonia) (%)
Place of birth for the foreign-born population - Moldova (%)
Place of birth for the foreign-born population - Poland (%)
Place of birth for the foreign-born population - Romania (%)
Place of birth for the foreign-born population - Russia (%)
Place of birth for the foreign-born population - Serbia (%)
Place of birth for the foreign-born population - Ukraine (%)
Place of birth for the foreign-born population - Other Eastern Europe (%)
Place of birth for the foreign-born population - China (%)
Place of birth for the foreign-born population - Hong Kong (%)
Place of birth for the foreign-born population - Taiwan (%)
Place of birth for the foreign-born population - Japan (%)
Place of birth for the foreign-born population - Korea (%)
Place of birth for the foreign-born population - Other Eastern Asia (%)
Place of birth for the foreign-born population - Afghanistan (%)
Place of birth for the foreign-born population - Bangladesh (%)
Place of birth for the foreign-born population - India (%)
Place of birth for the foreign-born population - Iran (%)
Place of birth for the foreign-born population - Kazakhstan (%)
Place of birth for the foreign-born population - Nepal (%)
Place of birth for the foreign-born population - Pakistan (%)
Place of birth for the foreign-born population - Sri Lanka (%)
Place of birth for the foreign-born population - Uzbekistan (%)
Place of birth for the foreign-born population - Other South Central Asia (%)
Place of birth for the foreign-born population - Burma (%)
Place of birth for the foreign-born population - Cambodia (%)
Place of birth for the foreign-born population - Indonesia (%)
Place of birth for the foreign-born population - Laos (%)
Place of birth for the foreign-born population - Malaysia (%)
Place of birth for the foreign-born population - Philippines (%)
Place of birth for the foreign-born population - Singapore (%)
Place of birth for the foreign-born population - Thailand (%)
Place of birth for the foreign-born population - Vietnam (%)
Place of birth for the foreign-born population - Other South Eastern Asia (%)
Place of birth for the foreign-born population - Armenia (%)
Place of birth for the foreign-born population - Iraq (%)
Place of birth for the foreign-born population - Israel (%)
Place of birth for the foreign-born population - Jordan (%)
Place of birth for the foreign-born population - Kuwait (%)
Place of birth for the foreign-born population - Lebanon (%)
Place of birth for the foreign-born population - Saudi Arabia (%)
Place of birth for the foreign-born population - Syria (%)
Place of birth for the foreign-born population - Turkey (%)
Place of birth for the foreign-born population - Yemen (%)
Place of birth for the foreign-born population - Other Western Asia (%)
Place of birth for the foreign-born population - Eritrea (%)
Place of birth for the foreign-born population - Ethiopia (%)
Place of birth for the foreign-born population - Kenya (%)
Place of birth for the foreign-born population - Somalia (%)
Place of birth for the foreign-born population - Uganda (%)
Place of birth for the foreign-born population - Zimbabwe (%)
Place of birth for the foreign-born population - Other Eastern Africa (%)
Place of birth for the foreign-born population - Cameroon (%)
Place of birth for the foreign-born population - Congo (%)
Place of birth for the foreign-born population - Democratic Republic of Congo (Zaire) (%)
Place of birth for the foreign-born population - Other Middle Africa (%)
Place of birth for the foreign-born population - Egypt (%)
Place of birth for the foreign-born population - Morocco (%)
Place of birth for the foreign-born population - Sudan (%)
Place of birth for the foreign-born population - Other Northern Africa (%)
Place of birth for the foreign-born population - South Africa (%)
Place of birth for the foreign-born population - Other Southern Africa (%)
Place of birth for the foreign-born population - Cabo Verde (%)
Place of birth for the foreign-born population - Ghana (%)
Place of birth for the foreign-born population - Liberia (%)
Place of birth for the foreign-born population - Nigeria (%)
Place of birth for the foreign-born population - Senegal (%)
Place of birth for the foreign-born population - Sierra Leone (%)
Place of birth for the foreign-born population - Other Western Africa (%)
Place of birth for the foreign-born population - Australia (%)
Place of birth for the foreign-born population - New Zealand (%)
Place of birth for the foreign-born population - Fiji (%)
Place of birth for the foreign-born population - Micronesia (%)
Place of birth for the foreign-born population - Bahamas (%)
Place of birth for the foreign-born population - Barbados (%)
Place of birth for the foreign-born population - Cuba (%)
Place of birth for the foreign-born population - Dominica (%)
Place of birth for the foreign-born population - Dominican Republic (%)
Place of birth for the foreign-born population - Grenada (%)
Place of birth for the foreign-born population - Haiti (%)
Place of birth for the foreign-born population - Jamaica (%)
Place of birth for the foreign-born population - St. Vincent and the Grenadines (%)
Place of birth for the foreign-born population - Trinidad and Tobago (%)
Place of birth for the foreign-born population - West Indies (%)
Place of birth for the foreign-born population - Other Caribbean (%)
Place of birth for the foreign-born population - Belize (%)
Place of birth for the foreign-born population - Costa Rica (%)
Place of birth for the foreign-born population - El Salvador (%)
Place of birth for the foreign-born population - Guatemala (%)
Place of birth for the foreign-born population - Honduras (%)
Place of birth for the foreign-born population - Mexico (%)
Place of birth for the foreign-born population - Nicaragua (%)
Place of birth for the foreign-born population - Panama (%)
Place of birth for the foreign-born population - Other Central America (%)
Place of birth for the foreign-born population - Argentina (%)
Place of birth for the foreign-born population - Bolivia (%)
Place of birth for the foreign-born population - Brazil (%)
Place of birth for the foreign-born population - Chile (%)
Place of birth for the foreign-born population - Colombia (%)
Place of birth for the foreign-born population - Ecuador (%)
Place of birth for the foreign-born population - Guyana (%)
Place of birth for the foreign-born population - Peru (%)
Place of birth for the foreign-born population - Uruguay (%)
Place of birth for the foreign-born population - Venezuela (%)
Place of birth for the foreign-born population - Other South America (%)
Place of birth for the foreign-born population - Canada (%)
Place of birth for the foreign-born population - Other Northern America (%)
Place of birth for the foreign-born population - Other (%)
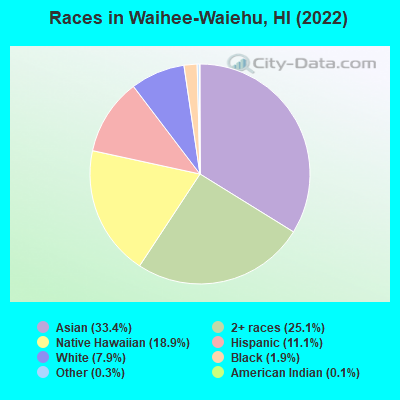
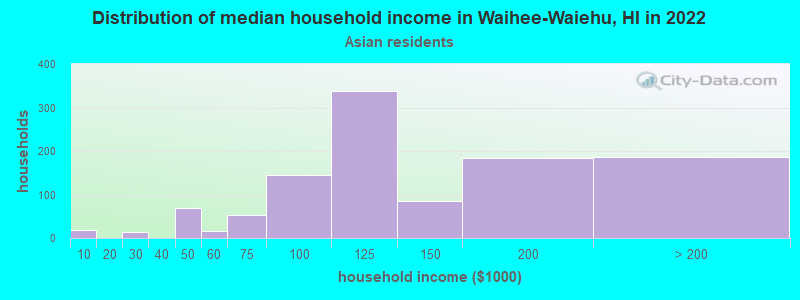
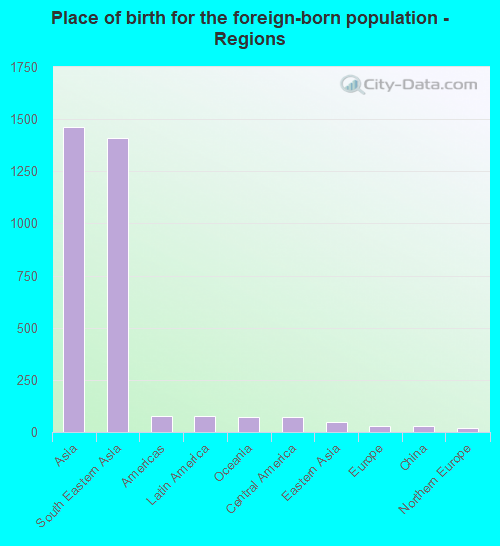
According to 2022 data, the most numerous races in Waihee-Waiehu, HI are Asian alone (3,675 residents), Two or more races (2,761 residents), and White alone (869 residents). 76.7% of Waihee-Waiehu residents speak English at home. 14.9% of Waihee-Waiehu, HI residents are foreign-born (13.0% born in Asia), which is 20.5% less than the foreign-born rate of 18.0% across the entire state of Hawaii.
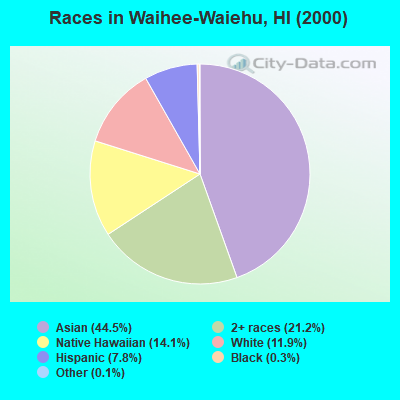
Race distribution in Waihee-Waiehu
2000 2022
494,149 40.8% Asian alone 277,091 22.9% White alone 218,700 18.1% Two or more races 108,441 9.0% Native Hawaiian and Other 87,699 7.2% Hispanic 20,829 1.7% Black alone 2,089 0.2% Other race alone 2,539 0.2% American Indian alone
498,125 34.6% Asian alone 318,574 22.1% Two or more races 297,937 20.7% White alone 160,103 11.1% Hispanic 134,567 9.3% Native Hawaiian and Other 23,682 1.6% Black alone 5,378 0.4% Other race alone 1,830 0.1% American Indian alone
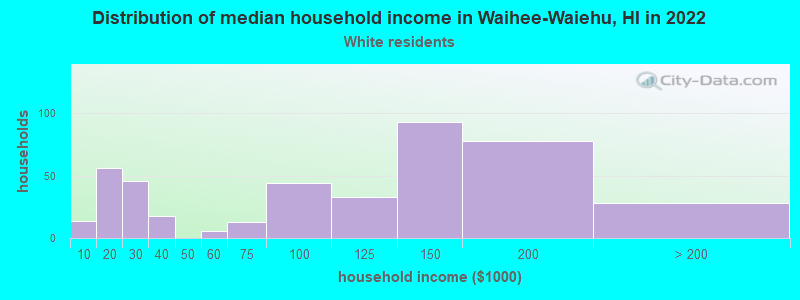
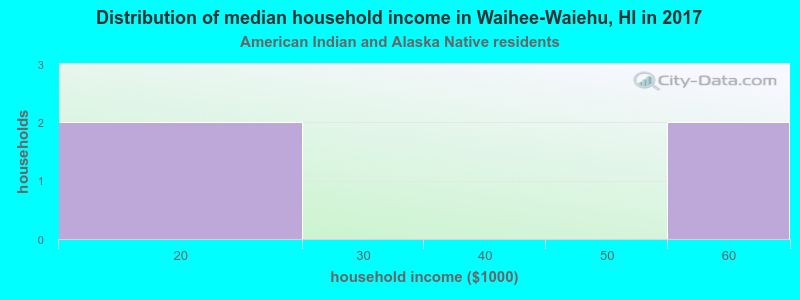
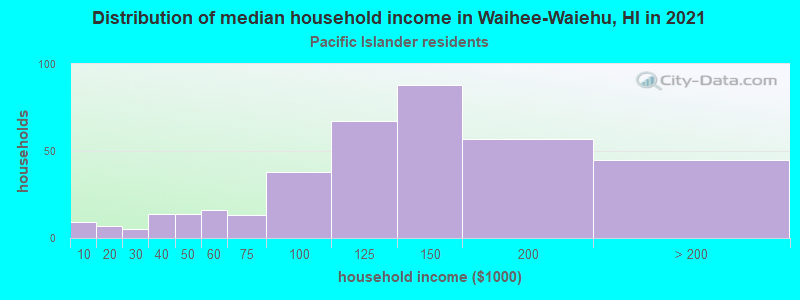
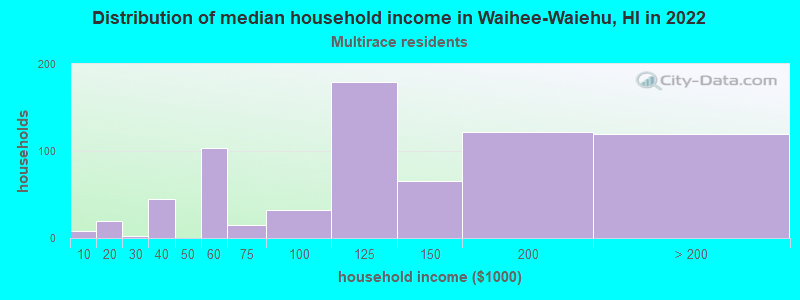
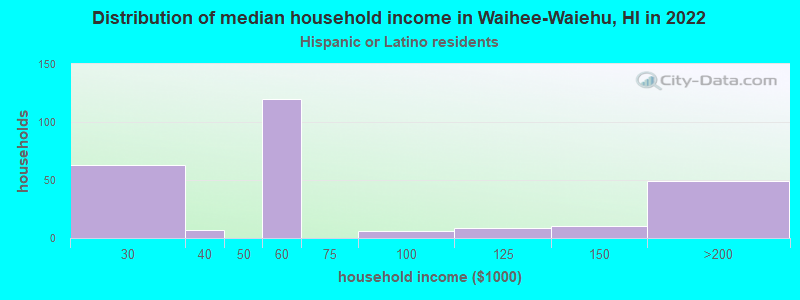
Income and house value in Waihee-Waiehu Median household income in 2022 $126,695 White non-Hispanic householders$127,228 Asian householders$126,383 Native Hawaiian and other Pacific Islander householders$128,706 Two or more races householdersMedian 2022 house value $902,408 White Non-Hispanic householdersover $1,000,000 American Indian or Alaska Native householders $834,608 Asian householders$619,784 Native Hawaiian and other Pacific Islander householders$829,081 Some other race householders$693,111 Two or more races householders$677,267 Hispanic or Latino householders
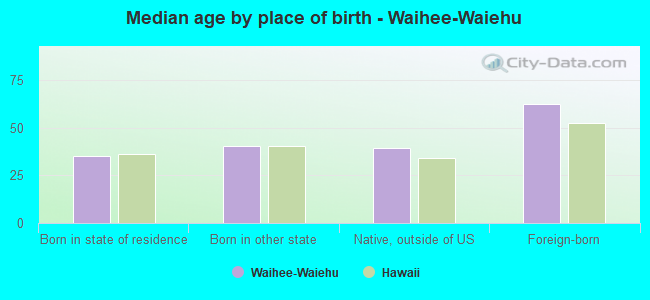
Median age by race in Waihee-Waiehu
50.9 Median age for White residents58.5 51.3 48.9 Median age for Black or African American residents27.1 -743,362,831.1 36.1 Median age for American Indian / Alaska Native residents-496,598,639.0 -904,439,427.2 53.0 Median age for Asian residents53.9 54.0 32.2 Median age for Native Hawaiian / Pacific Islander residents46.0 28.1 26.2 Median age for Other race residents30.2 20.8 25.7 Median age for Two or more races residents23.8 26.3 58.8 Median age for White alone residents70.4 45.1 20.7 Median age for Hispanic or Latino residents29.9 16.6
Owner/renter occupied households by race in Waihee-Waiehu
House owners and renters - White residents 312 70.6% Owner occupied130 29.4% Renter occupiedHouse owners and renters - Black or African American residents 101 100.0% Owner occupiedHouse owners and renters - American Indian / Alaska Native residents 4 100.0% Owner occupiedHouse owners and renters - Asian residents 1,137 97.2% Owner occupied32 2.8% Renter occupiedHouse owners and renters - Native Hawaiian / Pacific Islander residents 336 74.2% Owner occupied117 25.8% Renter occupiedHouse owners and renters - Other race residents 3 8.5% Owner occupied37 91.5% Renter occupiedHouse owners and renters - Two or more races residents 552 90.7% Owner occupied57 9.3% Renter occupiedHouse owners and renters - White alone residents 293 72.8% Owner occupied110 27.2% Renter occupiedHouse owners and renters - Hispanic or Latino residents 108 59.7% Owner occupied73 40.3% Renter occupied
Language usage in Waihee-Waiehu
English speakers - Total 76.7% of residents of Waihee-Waiehu speak English at home.
1.6% of residents speak Spanish at home 139 83.7% Speak English very well27 16.3% Speak English less than very well21.4% of residents speak other language at home 1,491 67.2% Speak English very well729 32.8% Speak English less than very well
English speakers - Born in the United States 84.5% of residents of Waihee-Waiehu speak English at home.
2.2% of residents speak Spanish at home 44 100.0% Speak English very well9.7% of residents speak other language at home 171 88.6% Speak English very well22 11.4% Speak English less than very well
All residents speak only English at home
English speakers - Foreign-born 23.1% of residents of Waihee-Waiehu speak English at home.
3.5% of residents speak Spanish at home 23 51.1% Speak English very well22 48.9% Speak English less than very well72.8% of residents speak other language at home 358 38.7% Speak English very well567 61.3% Speak English less than very well
White (Caucasian) - Speak only English Native:
91.3% (873)Foreign-born:
92.7% (18)
White (Caucasian) - Speak another language Native:
7.3% (70)Foreign-born:
4.4% (1)
Asian - Speak only English Native:
75.0% (2,018)Foreign-born:
16.9% (189)
Asian - Speak another language Native:
23.1% (620)Foreign-born:
81.1% (905)
Native Hawaiian / Pacific Islander - Speak only English Native:
73.1% (1,631)Foreign-born:
66.6% (45)
Native Hawaiian / Pacific Islander - Speak another language Native:
26.3% (586)Foreign-born:
21.7% (15)
Other race - Speak another language Native:
51.6% (26)Foreign-born:
72.0% (61)
Two or more races - Speak only English Native:
91.6% (2,822)Foreign-born:
9.3% (5)
Two or more races - Speak another language Native:
7.9% (243)Foreign-born:
70.2% (35)
White alone - Speak only English Native:
95.7% (823)Foreign-born:
91.4% (16)
White alone - Speak another language Native:
4.0% (34)Foreign-born:
4.9% (1)
Hispanic or Latino - Speak only English Native:
72.5% (693)Foreign-born:
14.8% (13)
Hispanic or Latino - Speak another language Native:
30.1% (288)Foreign-born:
68.7% (61)
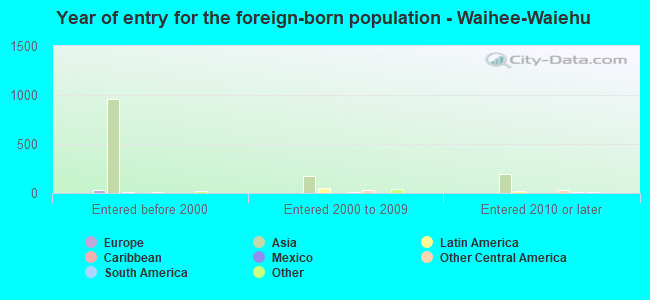
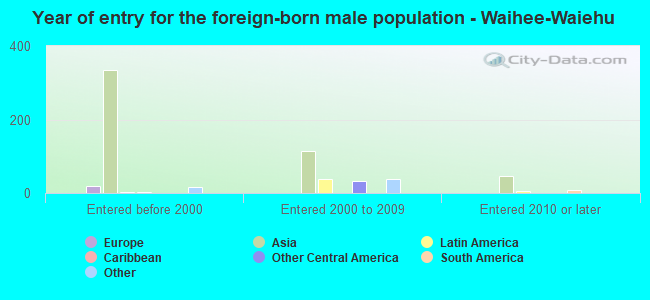
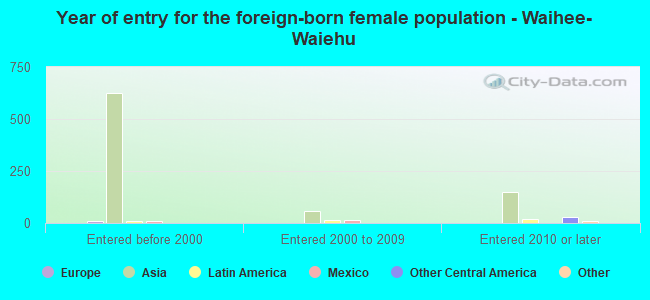
Foreign-born residents in Waihee-Waiehu 1,643 residents are foreign born (13.0% Asia ).
This city:
14.9%Hawaii:
18.0%
Marital status for residents in Waihee-Waiehu Marital status - White (Caucasian) population 15 years and over
Males 30.0% Never married57.6% Now married6.1% Separated0.9% Widowed5.4% DivorcedFemales 37.3% Never married45.0% Now married0.0% Separated0.5% Widowed17.2% DivorcedWomen who did not give birth in the past 12 months Now married:
24.5% (70)Unmarried:
75.5% (217)
Marital status - Black or African American population 15 years and over
Males 91.5% Never married0.0% Now married0.0% Separated0.0% Widowed8.5% DivorcedFemales 0.0% Never married100.0% Now married0.0% Separated0.0% Widowed0.0% DivorcedWomen who did not give birth in the past 12 months Now married:
100.0% (93)Unmarried:
0.0% (0)
Marital status - American Indian / Alaska Native population 15 years and over
Males 0.0% Never married0.0% Now married0.0% Separated0.0% Widowed100.0% DivorcedFemales 0.0% Never married100.0% Now married0.0% Separated0.0% Widowed0.0% DivorcedWomen who did not give birth in the past 12 months Now married:
100.0% (14)Unmarried:
0.0% (0)
Marital status - Asian population 15 years and over
Males 44.9% Never married46.2% Now married0.7% Separated6.6% Widowed1.6% DivorcedFemales 21.7% Never married51.8% Now married4.4% Separated18.5% Widowed3.6% DivorcedWomen who gave birth in the past 12 months Now married:
0.0% (0)Unmarried:
100.0% (37)
Women who did not give birth in the past 12 months Now married:
47.0% (236)Unmarried:
53.0% (266)
Marital status - Native Hawaiian / Pacific Islander population 15 years and over
Males 40.6% Never married50.4% Now married0.8% Separated0.3% Widowed7.9% DivorcedFemales 49.2% Never married39.7% Now married0.2% Separated3.2% Widowed7.7% DivorcedWomen who gave birth in the past 12 months Now married:
0.0% (0)Unmarried:
100.0% (8)
Women who did not give birth in the past 12 months Now married:
23.4% (106)Unmarried:
76.6% (349)
Marital status - Other race population 15 years and over
Males 61.4% Never married38.6% Now married0.0% Separated0.0% Widowed0.0% DivorcedFemales 91.4% Never married0.0% Now married0.0% Separated8.6% Widowed0.0% DivorcedWomen who did not give birth in the past 12 months Now married:
0.0% (0)Unmarried:
100.0% (37)
Marital status - Two or more races population 15 years and over
Males 64.1% Never married27.1% Now married1.6% Separated0.3% Widowed6.8% DivorcedFemales 48.4% Never married36.5% Now married0.2% Separated9.3% Widowed5.6% DivorcedWomen who gave birth in the past 12 months Now married:
36.7% (12)Unmarried:
63.3% (21)
Women who did not give birth in the past 12 months Now married:
19.0% (117)Unmarried:
81.0% (499)
Marital status - White alone, not Hispanic / Latino population 15 years and over
Males 18.7% Never married66.5% Now married7.9% Separated0.0% Widowed6.9% DivorcedFemales 34.4% Never married46.8% Now married0.0% Separated0.6% Widowed18.2% DivorcedWomen who did not give birth in the past 12 months Now married:
26.4% (72)Unmarried:
73.6% (201)
Marital status - Hispanic or Latino population 15 years and over
Males 63.7% Never married35.2% Now married0.0% Separated1.2% Widowed0.0% DivorcedFemales 61.9% Never married24.8% Now married0.0% Separated0.0% Widowed13.2% DivorcedWomen who gave birth in the past 12 months Now married:
42.9% (3)Unmarried:
57.1% (4)
Women who did not give birth in the past 12 months Now married:
17.1% (38)Unmarried:
82.9% (186)
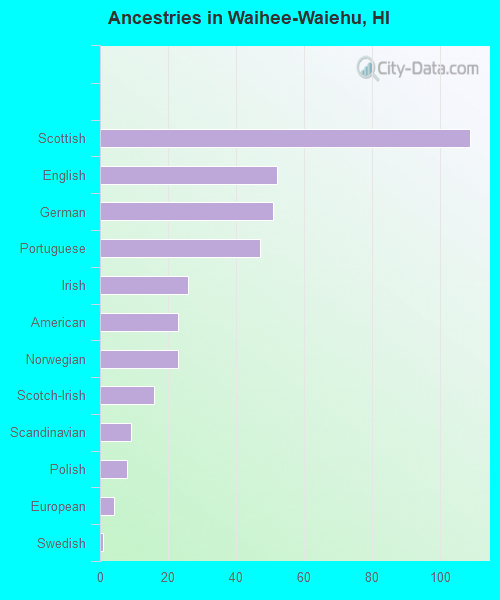
Ancestries in Waihee-Waiehu
109 2.1% Scottish52 1.0% English51 1.0% German47 0.9% Portuguese26 0.5% Irish23 0.4% American23 0.4% Norwegian16 0.3% Scotch-Irish9 0.2% Scandinavian8 0.2% Polish4 0.08% European1 0.02% Swedish
Children Nativity (place of birth) in Waihee-Waiehu
Children under 6 years - Living with two parents Both parents native 193 100.0% NativeOne native, one foreign-born parent 23 100.0% NativeChildren under 6 years - Living with one parent Native parent 496 100.0% NativeForeign-born parent 31 100.0% NativeChildren 6 to 17 years - Living with two parents Both parents native 507 100.0% NativeBoth parents foreign-born 16 45.2% Native19 54.8% Foreign-bornOne native, one foreign-born parent 131 100.0% NativeChildren 6 to 17 years - Living with one parent Native parent 825 100.0% NativeForeign-born parent 211 55.2% Native171 44.8% Foreign-born
Grandparents responsible for own grandchildren in Waihee-Waiehu
Grandparents (30 to 59 years) White / Caucasian 7 100.0% Not responsible for grandchildrenAsian 2 6.3% Responsible for grandchildren37 93.7% Not responsible for grandchildrenNative Hawaiian / Pacific Islander 6 14.0% Responsible for grandchildren38 86.0% Not responsible for grandchildrenTwo or more races 6 8.0% Responsible for grandchildren74 92.0% Not responsible for grandchildrenWhite alone, not Hispanic / Latino 7 100.0% Not responsible for grandchildrenHispanic or Latino 4 33.1% Responsible for grandchildren8 66.9% Not responsible for grandchildrenGrandparents (60 years and over) White / Caucasian 4 7.5% Responsible for grandchildren55 92.5% Not responsible for grandchildrenAsian 64 29.4% Responsible for grandchildren154 70.6% Not responsible for grandchildrenNative Hawaiian / Pacific Islander 29 38.5% Responsible for grandchildren47 61.5% Not responsible for grandchildrenTwo or more races 14 22.4% Responsible for grandchildren49 77.6% Not responsible for grandchildrenWhite alone, not Hispanic / Latino 2 4.0% Responsible for grandchildren55 96.0% Not responsible for grandchildrenHispanic or Latino 12 100.0% Not responsible for grandchildren