Races in Webster, Texas (TX) Detailed Stats
Data:
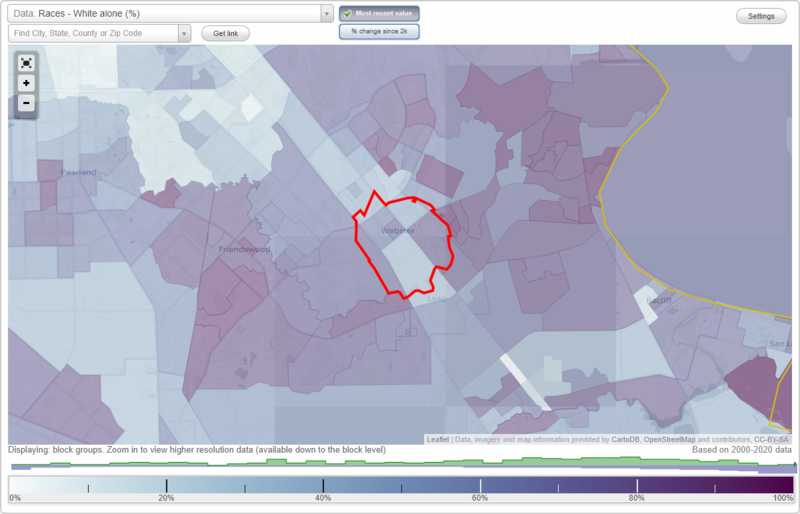
Races - White alone (%)
Races - White alone (% change since 2000)
Races - Black alone (%)
Races - Black alone (% change since 2000)
Races - American Indian alone (%)
Races - American Indian alone (% change since 2000)
Races - Asian alone (%)
Races - Asian alone (% change since 2000)
Races - Hispanic (%)
Races - Hispanic (% change since 2000)
Races - Native Hawaiian and Other Pacific Islander alone (%)
Races - Native Hawaiian and Other Pacific Islander alone (% change since 2000)
Races - Two or more races(%)
Races - Two or more races(% change since 2000)
Races - Other race alone (%)
Races - Other race alone (% change since 2000)
Racial diversity
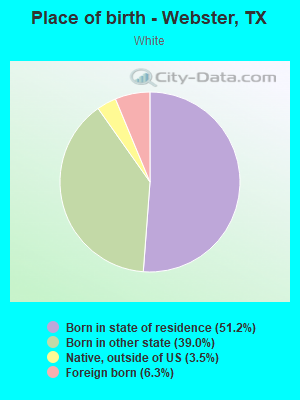
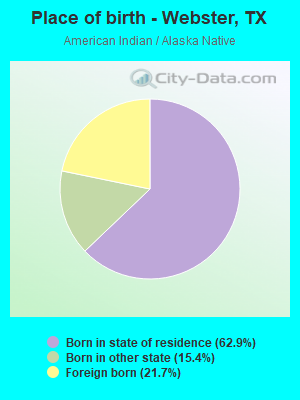
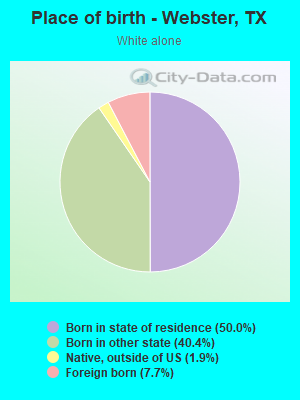
Place of birth - Born in state of residence (%)
Place of birth - Born in state of residence (%) - White
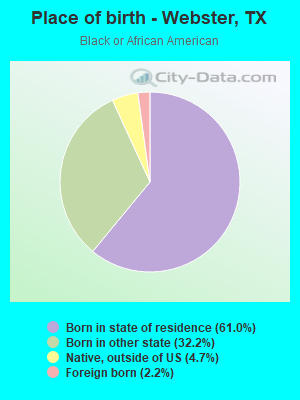
Place of birth - Born in state of residence (%) - Black or African American
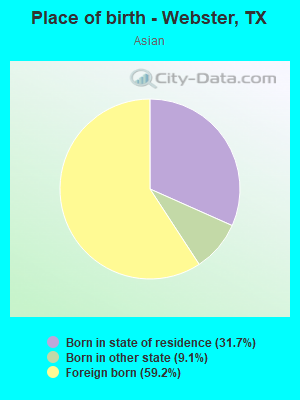
Place of birth - Born in state of residence (%) - Asian
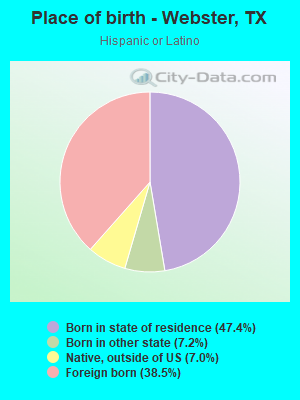
Place of birth - Born in state of residence (%) - Hispanic or Latino
Place of birth - Born in state of residence (%) - American Indian and Alaska Native
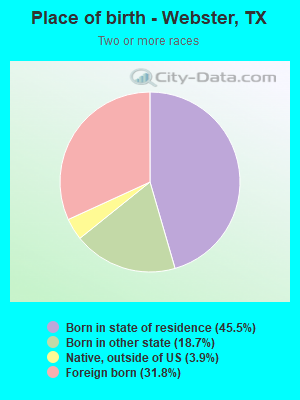
Place of birth - Born in state of residence (%) - Multirace
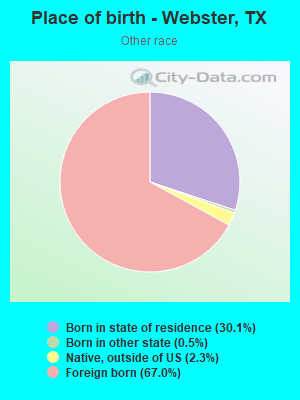
Place of birth - Born in state of residence (%) - Other Race
Place of birth - Born in other state (%)
Place of birth - Born in other state (%) - White
Place of birth - Born in other state (%) - Black or African American
Place of birth - Born in other state (%) - Asian
Place of birth - Born in other state (%) - Hispanic or Latino
Place of birth - Born in other state (%) - American Indian and Alaska Native
Place of birth - Born in other state (%) - Multirace
Place of birth - Born in other state (%) - Other Race
Place of birth - Native, outside of US (%)
Place of birth - Native, outside of US (%) - White
Place of birth - Native, outside of US (%) - Black or African American
Place of birth - Native, outside of US (%) - Asian
Place of birth - Native, outside of US (%) - Hispanic or Latino
Place of birth - Native, outside of US (%) - American Indian and Alaska Native
Place of birth - Native, outside of US (%) - Multirace
Place of birth - Native, outside of US (%) - Other Race
Place of birth - Foreign born (%)
Place of birth - Foreign born (%) - White
Place of birth - Foreign born (%) - Black or African American
Place of birth - Foreign born (%) - Asian
Place of birth - Foreign born (%) - Hispanic or Latino
Place of birth - Foreign born (%) - American Indian and Alaska Native
Place of birth - Foreign born (%) - Multirace
Place of birth - Foreign born (%) - Other Race
Residents speaking English at home (%)
Residents speaking English at home - Born in the United States (%)
Residents speaking English at home - Native, born elsewhere (%)
Residents speaking English at home - Foreign born (%)
Residents speaking Spanish at home (%)
Residents speaking Spanish at home - Born in the United States (%)
Residents speaking Spanish at home - Native, born elsewhere (%)
Residents speaking Spanish at home - Foreign born (%)
Residents speaking other language at home (%)
Residents speaking other language at home - Born in the United States (%)
Residents speaking other language at home - Native, born elsewhere (%)
Residents speaking other language at home - Foreign born (%)
Marital status - Never married (%)
Marital status - Now married (%)
Marital status - Separated (%)
Marital status - Widowed (%)
Marital status - Divorced (%)
Ancestries Reported - Arab (%)
Ancestries Reported - Czech (%)
Ancestries Reported - Danish (%)
Ancestries Reported - Dutch (%)
Ancestries Reported - English (%)
Ancestries Reported - French (%)
Ancestries Reported - French Canadian (%)
Ancestries Reported - German (%)
Ancestries Reported - Greek (%)
Ancestries Reported - Hungarian (%)
Ancestries Reported - Irish (%)
Ancestries Reported - Italian (%)
Ancestries Reported - Lithuanian (%)
Ancestries Reported - Norwegian (%)
Ancestries Reported - Polish (%)
Ancestries Reported - Portuguese (%)
Ancestries Reported - Russian (%)
Ancestries Reported - Scotch-Irish (%)
Ancestries Reported - Scottish (%)
Ancestries Reported - Slovak (%)
Ancestries Reported - Subsaharan African (%)
Ancestries Reported - Swedish (%)
Ancestries Reported - Swiss (%)
Ancestries Reported - Ukrainian (%)
Ancestries Reported - United States (%)
Ancestries Reported - Welsh (%)
Ancestries Reported - West Indian (%)
Ancestries Reported - Other (%)
Geographical mobility - Same house 1 year ago (%)
Geographical mobility - Same house 1 year ago (%) - White
Geographical mobility - Same house 1 year ago (%) - Black or African American
Geographical mobility - Same house 1 year ago (%) - Asian
Geographical mobility - Same house 1 year ago (%) - Hispanic or Latino
Geographical mobility - Same house 1 year ago (%) - American Indian and Alaska Native
Geographical mobility - Same house 1 year ago (%) - Multirace
Geographical mobility - Same house 1 year ago (%) - Other Race
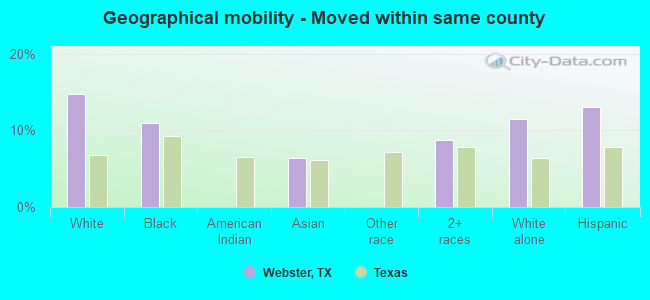
Geographical mobility - Moved within same county (%)
Geographical mobility - Moved within same county (%) - White
Geographical mobility - Moved within same county (%) - Black or African American
Geographical mobility - Moved within same county (%) - Asian
Geographical mobility - Moved within same county (%) - Hispanic or Latino
Geographical mobility - Moved within same county (%) - American Indian and Alaska Native
Geographical mobility - Moved within same county (%) - Multirace
Geographical mobility - Moved within same county (%) - Other Race
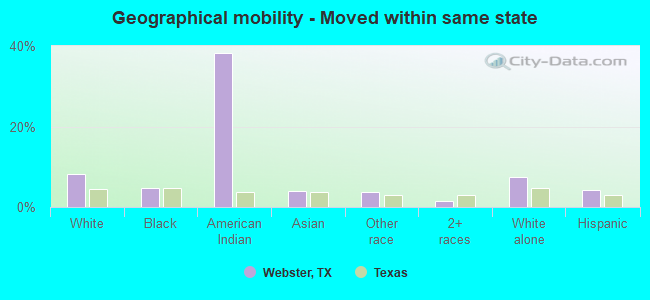
Geographical mobility - Moved from different county within same state (%)
Geographical mobility - Moved from different county within same state (%) - White
Geographical mobility - Moved from different county within same state (%) - Black or African American
Geographical mobility - Moved from different county within same state (%) - Asian
Geographical mobility - Moved from different county within same state (%) - Hispanic or Latino
Geographical mobility - Moved from different county within same state (%) - American Indian and Alaska Native
Geographical mobility - Moved from different county within same state (%) - Multirace
Geographical mobility - Moved from different county within same state (%) - Other Race
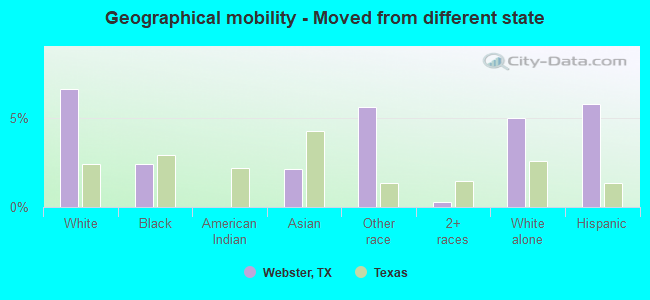
Geographical mobility - Moved from different state (%)
Geographical mobility - Moved from different state (%) - White
Geographical mobility - Moved from different state (%) - Black or African American
Geographical mobility - Moved from different state (%) - Asian
Geographical mobility - Moved from different state (%) - Hispanic or Latino
Geographical mobility - Moved from different state (%) - American Indian and Alaska Native
Geographical mobility - Moved from different state (%) - Multirace
Geographical mobility - Moved from different state (%) - Other Race
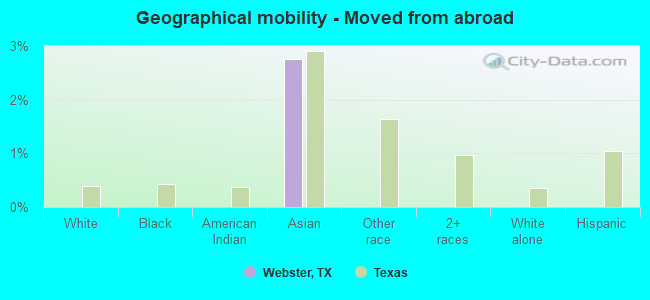
Geographical mobility - Moved from abroad (%)
Geographical mobility - Moved from abroad (%) - White
Geographical mobility - Moved from abroad (%) - Black or African American
Geographical mobility - Moved from abroad (%) - Asian
Geographical mobility - Moved from abroad (%) - Hispanic or Latino
Geographical mobility - Moved from abroad (%) - American Indian and Alaska Native
Geographical mobility - Moved from abroad (%) - Multirace
Geographical mobility - Moved from abroad (%) - Other Race
Place of birth for the foreign-born population - Ireland (%)
Place of birth for the foreign-born population - Denmark (%)
Place of birth for the foreign-born population - Norway (%)
Place of birth for the foreign-born population - Sweden (%)
Place of birth for the foreign-born population - United Kingdom (%)
Place of birth for the foreign-born population - England (%)
Place of birth for the foreign-born population - Scotland (%)
Place of birth for the foreign-born population - Other Northern Europe (%)
Place of birth for the foreign-born population - Austria (%)
Place of birth for the foreign-born population - Belgium (%)
Place of birth for the foreign-born population - France (%)
Place of birth for the foreign-born population - Germany (%)
Place of birth for the foreign-born population - Netherlands (%)
Place of birth for the foreign-born population - Switzerland (%)
Place of birth for the foreign-born population - Other Western Europe (%)
Place of birth for the foreign-born population - Greece (%)
Place of birth for the foreign-born population - Italy (%)
Place of birth for the foreign-born population - Portugal (%)
Place of birth for the foreign-born population - Spain (%)
Place of birth for the foreign-born population - Other Southern Europe (%)
Place of birth for the foreign-born population - Albania (%)
Place of birth for the foreign-born population - Belarus (%)
Place of birth for the foreign-born population - Bosnia and Herzegovina (%)
Place of birth for the foreign-born population - Bulgaria (%)
Place of birth for the foreign-born population - Croatia (%)
Place of birth for the foreign-born population - Czechoslovakia (%)
Place of birth for the foreign-born population - Hungary (%)
Place of birth for the foreign-born population - Latvia (%)
Place of birth for the foreign-born population - Lithuania (%)
Place of birth for the foreign-born population - North Macedonia (Macedonia) (%)
Place of birth for the foreign-born population - Moldova (%)
Place of birth for the foreign-born population - Poland (%)
Place of birth for the foreign-born population - Romania (%)
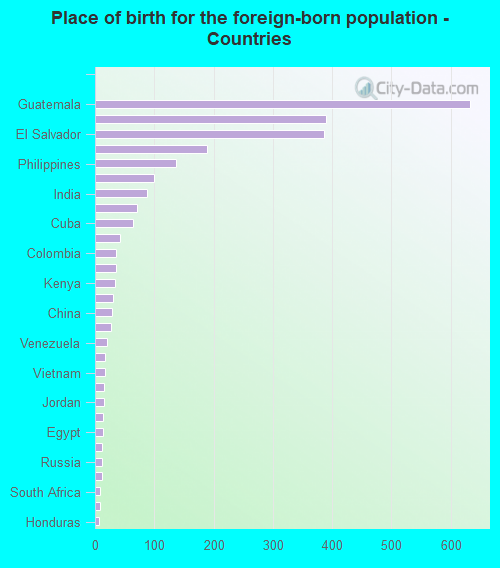
Place of birth for the foreign-born population - Russia (%)
Place of birth for the foreign-born population - Serbia (%)
Place of birth for the foreign-born population - Ukraine (%)
Place of birth for the foreign-born population - Other Eastern Europe (%)
Place of birth for the foreign-born population - China (%)
Place of birth for the foreign-born population - Hong Kong (%)
Place of birth for the foreign-born population - Taiwan (%)
Place of birth for the foreign-born population - Japan (%)
Place of birth for the foreign-born population - Korea (%)
Place of birth for the foreign-born population - Other Eastern Asia (%)
Place of birth for the foreign-born population - Afghanistan (%)
Place of birth for the foreign-born population - Bangladesh (%)
Place of birth for the foreign-born population - India (%)
Place of birth for the foreign-born population - Iran (%)
Place of birth for the foreign-born population - Kazakhstan (%)
Place of birth for the foreign-born population - Nepal (%)
Place of birth for the foreign-born population - Pakistan (%)
Place of birth for the foreign-born population - Sri Lanka (%)
Place of birth for the foreign-born population - Uzbekistan (%)
Place of birth for the foreign-born population - Other South Central Asia (%)
Place of birth for the foreign-born population - Burma (%)
Place of birth for the foreign-born population - Cambodia (%)
Place of birth for the foreign-born population - Indonesia (%)
Place of birth for the foreign-born population - Laos (%)
Place of birth for the foreign-born population - Malaysia (%)
Place of birth for the foreign-born population - Philippines (%)
Place of birth for the foreign-born population - Singapore (%)
Place of birth for the foreign-born population - Thailand (%)
Place of birth for the foreign-born population - Vietnam (%)
Place of birth for the foreign-born population - Other South Eastern Asia (%)
Place of birth for the foreign-born population - Armenia (%)
Place of birth for the foreign-born population - Iraq (%)
Place of birth for the foreign-born population - Israel (%)
Place of birth for the foreign-born population - Jordan (%)
Place of birth for the foreign-born population - Kuwait (%)
Place of birth for the foreign-born population - Lebanon (%)
Place of birth for the foreign-born population - Saudi Arabia (%)
Place of birth for the foreign-born population - Syria (%)
Place of birth for the foreign-born population - Turkey (%)
Place of birth for the foreign-born population - Yemen (%)
Place of birth for the foreign-born population - Other Western Asia (%)
Place of birth for the foreign-born population - Eritrea (%)
Place of birth for the foreign-born population - Ethiopia (%)
Place of birth for the foreign-born population - Kenya (%)
Place of birth for the foreign-born population - Somalia (%)
Place of birth for the foreign-born population - Uganda (%)
Place of birth for the foreign-born population - Zimbabwe (%)
Place of birth for the foreign-born population - Other Eastern Africa (%)
Place of birth for the foreign-born population - Cameroon (%)
Place of birth for the foreign-born population - Congo (%)
Place of birth for the foreign-born population - Democratic Republic of Congo (Zaire) (%)
Place of birth for the foreign-born population - Other Middle Africa (%)
Place of birth for the foreign-born population - Egypt (%)
Place of birth for the foreign-born population - Morocco (%)
Place of birth for the foreign-born population - Sudan (%)
Place of birth for the foreign-born population - Other Northern Africa (%)
Place of birth for the foreign-born population - South Africa (%)
Place of birth for the foreign-born population - Other Southern Africa (%)
Place of birth for the foreign-born population - Cabo Verde (%)
Place of birth for the foreign-born population - Ghana (%)
Place of birth for the foreign-born population - Liberia (%)
Place of birth for the foreign-born population - Nigeria (%)
Place of birth for the foreign-born population - Senegal (%)
Place of birth for the foreign-born population - Sierra Leone (%)
Place of birth for the foreign-born population - Other Western Africa (%)
Place of birth for the foreign-born population - Australia (%)
Place of birth for the foreign-born population - New Zealand (%)
Place of birth for the foreign-born population - Fiji (%)
Place of birth for the foreign-born population - Micronesia (%)
Place of birth for the foreign-born population - Bahamas (%)
Place of birth for the foreign-born population - Barbados (%)
Place of birth for the foreign-born population - Cuba (%)
Place of birth for the foreign-born population - Dominica (%)
Place of birth for the foreign-born population - Dominican Republic (%)
Place of birth for the foreign-born population - Grenada (%)
Place of birth for the foreign-born population - Haiti (%)
Place of birth for the foreign-born population - Jamaica (%)
Place of birth for the foreign-born population - St. Vincent and the Grenadines (%)
Place of birth for the foreign-born population - Trinidad and Tobago (%)
Place of birth for the foreign-born population - West Indies (%)
Place of birth for the foreign-born population - Other Caribbean (%)
Place of birth for the foreign-born population - Belize (%)
Place of birth for the foreign-born population - Costa Rica (%)
Place of birth for the foreign-born population - El Salvador (%)
Place of birth for the foreign-born population - Guatemala (%)
Place of birth for the foreign-born population - Honduras (%)
Place of birth for the foreign-born population - Mexico (%)
Place of birth for the foreign-born population - Nicaragua (%)
Place of birth for the foreign-born population - Panama (%)
Place of birth for the foreign-born population - Other Central America (%)
Place of birth for the foreign-born population - Argentina (%)
Place of birth for the foreign-born population - Bolivia (%)
Place of birth for the foreign-born population - Brazil (%)
Place of birth for the foreign-born population - Chile (%)
Place of birth for the foreign-born population - Colombia (%)
Place of birth for the foreign-born population - Ecuador (%)
Place of birth for the foreign-born population - Guyana (%)
Place of birth for the foreign-born population - Peru (%)
Place of birth for the foreign-born population - Uruguay (%)
Place of birth for the foreign-born population - Venezuela (%)
Place of birth for the foreign-born population - Other South America (%)
Place of birth for the foreign-born population - Canada (%)
Place of birth for the foreign-born population - Other Northern America (%)
Place of birth for the foreign-born population - Other (%)
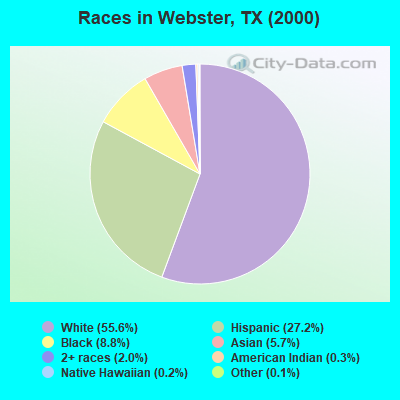
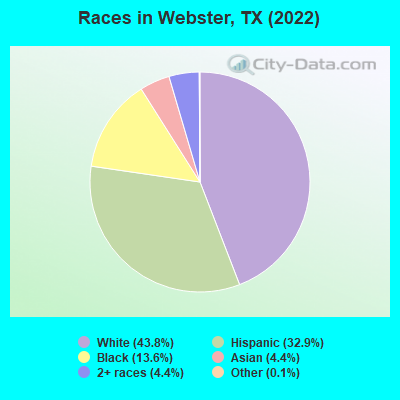
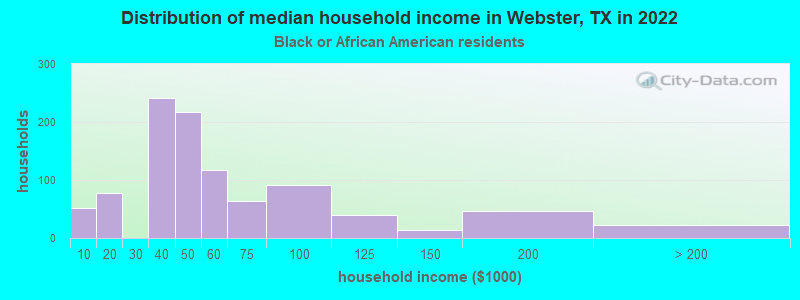
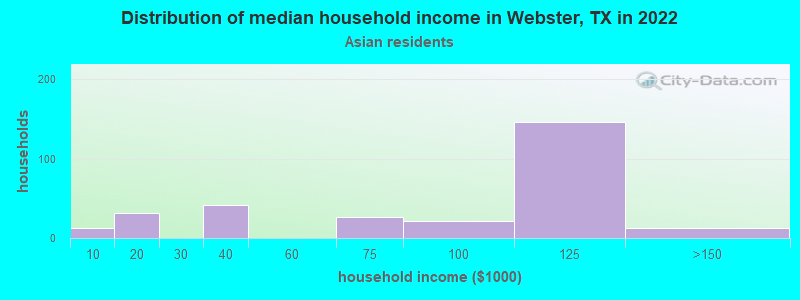
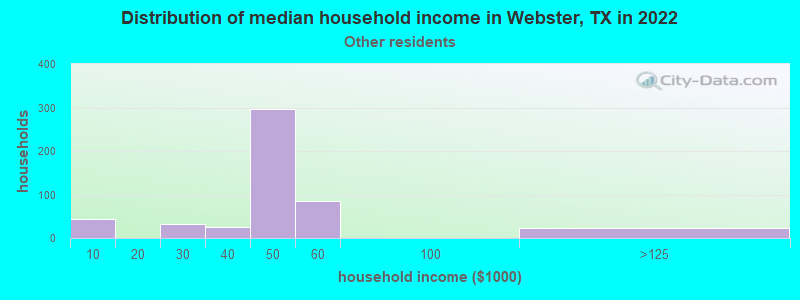
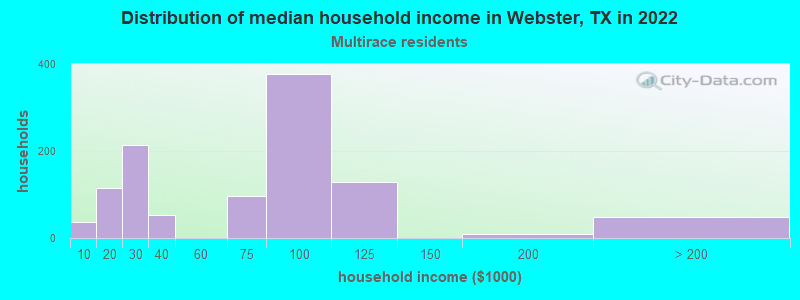
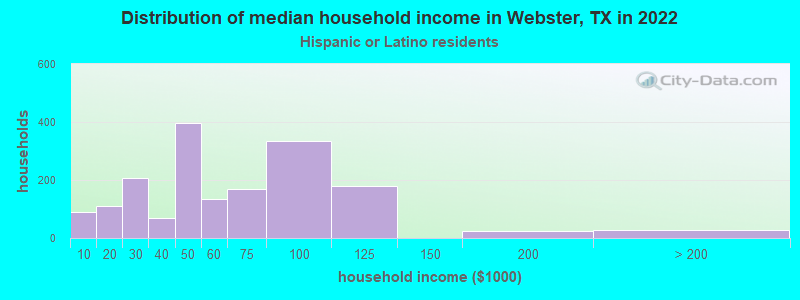
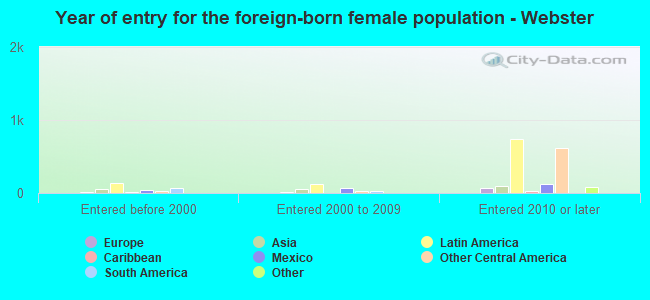
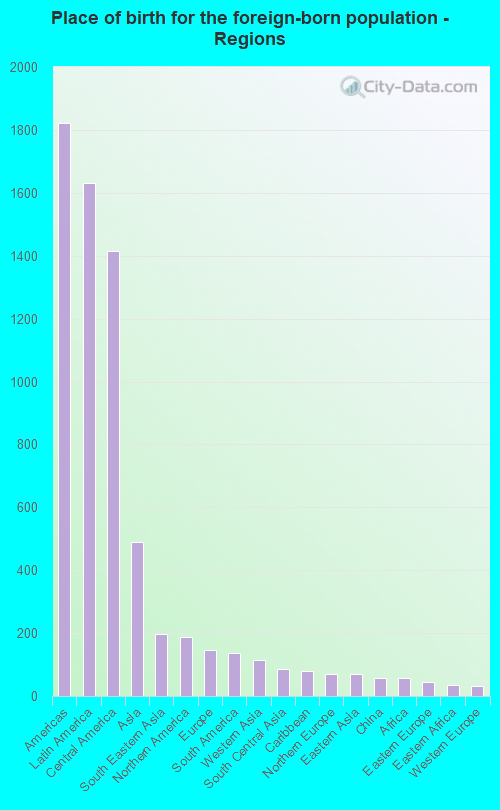
According to 2022 data, the most numerous races in Webster, TX are Hispanic (4,093 residents), White alone (5,443 residents), and Black alone (1,688 residents). 68.3% of Webster residents speak English at home. 20.2% of Webster, TX residents are foreign-born (12.9% born in Latin America, 3.9% born in Asia), which is 16.0% greater than the foreign-born rate of 17.0% across the entire state of Texas.
Race distribution in Webster
2000 2022
10,933,313 52.4% White alone 6,669,666 32.0% Hispanic 2,364,255 11.3% Black alone 554,445 2.7% Asian alone 230,567 1.1% Two or more races 68,859 0.3% American Indian alone 19,958 0.10% Other race alone 10,757 0.05% Native Hawaiian and Other
12,070,642 40.2% Hispanic 11,683,430 38.9% White alone 3,508,706 11.7% Black alone 1,608,173 5.4% Asian alone 956,560 3.2% Two or more races 125,763 0.4% Other race alone 47,023 0.2% American Indian alone 29,275 0.10% Native Hawaiian and Other
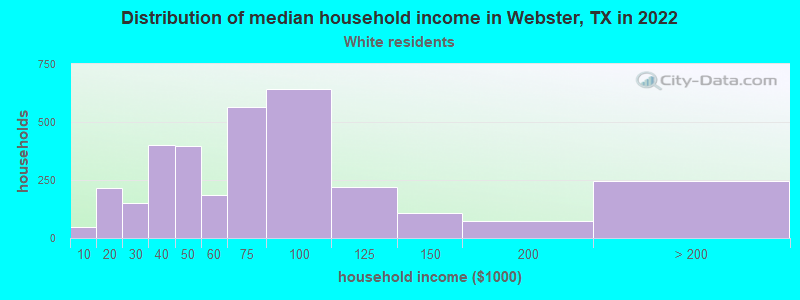
Income and house value in Webster Median household income in 2022 $60,783 White non-Hispanic householders$48,738 Black householders$99,375 Asian householders$43,583 Some other race householders$73,356 Two or more races householders$50,374 Hispanic or Latino race householdersMedian 2022 house value $334,007 White Non-Hispanic householdersover $1,000,000 Black or African American householders $420,099 Asian householders$364,107 Two or more races householders
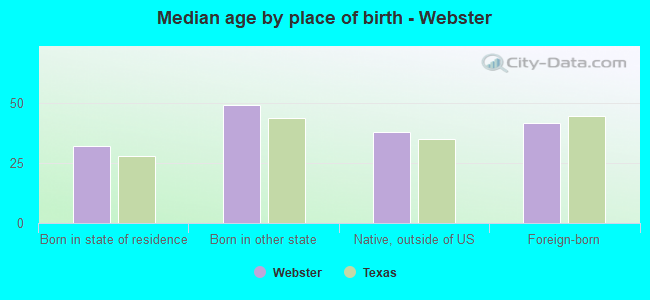
Median age by race in Webster
41.7 Median age for White residents37.4 48.5 32.4 Median age for Black or African American residents40.2 31.8 25.8 Median age for American Indian / Alaska Native residents-598,187,310.6 27.2 36.3 Median age for Asian residents26.6 36.1 -782,795,698.1 Median age for Native Hawaiian / Pacific Islander residents-633,771,929.2 -816,367,264.7 33.5 Median age for Other race residents38.4 33.5 39.6 Median age for Two or more races residents36.2 40.6 44.2 Median age for White alone residents35.2 46.8 35.0 Median age for Hispanic or Latino residents34.8 35.1
Owner/renter occupied households by race in Webster
House owners and renters - White residents 615 19.1% Owner occupied2,602 80.9% Renter occupiedHouse owners and renters - Black or African American residents 27 2.7% Owner occupied951 97.3% Renter occupiedHouse owners and renters - American Indian / Alaska Native residents 26 100.0% Renter occupiedHouse owners and renters - Asian residents 54 19.9% Owner occupied216 80.1% Renter occupiedHouse owners and renters - Other race residents 520 100.0% Renter occupiedHouse owners and renters - Two or more races residents 335 29.2% Owner occupied812 70.8% Renter occupiedHouse owners and renters - White alone residents 650 19.1% Owner occupied2,748 80.9% Renter occupiedHouse owners and renters - Hispanic or Latino residents 251 14.3% Owner occupied1,505 85.7% Renter occupied
Language usage in Webster
English speakers - Total 68.3% of residents of Webster speak English at home.
24.5% of residents speak Spanish at home 1,281 44.1% Speak English very well1,624 55.9% Speak English less than very well6.9% of residents speak other language at home 549 66.7% Speak English very well274 33.3% Speak English less than very well
English speakers - Born in the United States 91.5% of residents of Webster speak English at home.
6.5% of residents speak Spanish at home 94 43.7% Speak English very well121 56.3% Speak English less than very well2.0% of residents speak other language at home 66 100.0% Speak English very well
English speakers - Native, born elsewhere 33.7% of residents of Webster speak English at home.
53.7% of residents speak Spanish at home 168 76.4% Speak English very well52 23.6% Speak English less than very well9.5% of residents speak other language at home 39 100.0% Speak English very well
English speakers - Foreign-born 19.7% of residents of Webster speak English at home.
54.9% of residents speak Spanish at home 317 24.0% Speak English very well1,004 76.0% Speak English less than very well24.6% of residents speak other language at home 326 55.2% Speak English very well265 44.8% Speak English less than very well
White (Caucasian) - Speak only English Native:
94.0% (4,705)Foreign-born:
59.0% (206)
White (Caucasian) - Speak another language Native:
9.5% (478)Foreign-born:
56.8% (199)
Black or African American - Speak another language Native:
8.5% (155)Foreign-born:
100.0% (40)
American Indian / Alaska Native - Speak another language Native:
92.7% (35)Foreign-born:
98.9% (11)
Asian - Speak another language Native:
41.8% (64)Foreign-born:
100.0% (329)
Other race - Speak only English Native:
45.8% (275)Foreign-born:
17.8% (201)
Other race - Speak another language Native:
55.8% (335)Foreign-born:
81.0% (914)
Two or more races - Speak only English Native:
57.3% (736)Foreign-born:
14.3% (95)
Two or more races - Speak another language Native:
40.6% (521)Foreign-born:
85.6% (568)
White alone - Speak only English Native:
95.6% (4,699)Foreign-born:
58.3% (245)
White alone - Speak another language Native:
4.4% (215)Foreign-born:
43.0% (181)
Hispanic or Latino - Speak only English Native:
37.1% (840)Foreign-born:
16.0% (234)
Hispanic or Latino - Speak another language Native:
62.8% (1,423)Foreign-born:
84.5% (1,237)
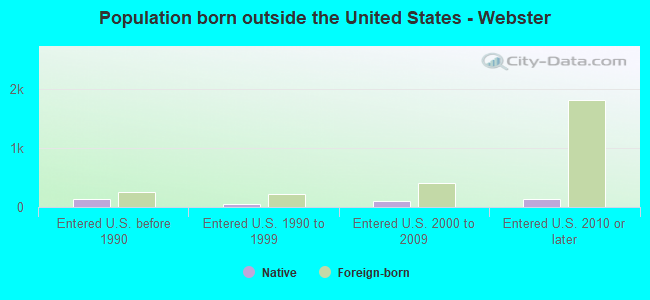
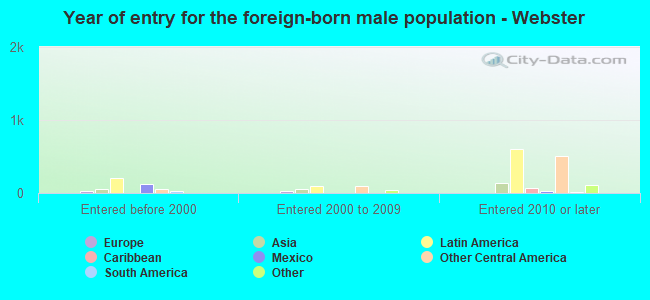
Foreign-born residents in Webster 2,516 residents are foreign born (12.9% Latin America , 3.9% Asia ).
This city:
20.2%Texas:
17.1%
Marital status for residents in Webster Marital status - White (Caucasian) population 15 years and over
Males 52.0% Never married34.0% Now married1.3% Separated2.6% Widowed10.1% DivorcedFemales 29.5% Never married37.0% Now married4.8% Separated9.2% Widowed19.5% DivorcedWomen who gave birth in the past 12 months Now married:
75.0% (30)Unmarried:
25.0% (10)
Women who did not give birth in the past 12 months Now married:
30.3% (355)Unmarried:
69.7% (816)
Marital status - Black or African American population 15 years and over
Males 74.0% Never married7.7% Now married4.9% Separated8.6% Widowed4.9% DivorcedFemales 66.9% Never married10.5% Now married1.6% Separated4.8% Widowed16.1% DivorcedWomen who gave birth in the past 12 months Now married:
0.0% (0)Unmarried:
100.0% (4)
Women who did not give birth in the past 12 months Now married:
2.5% (16)Unmarried:
97.5% (631)
Marital status - Asian population 15 years and over
Males 57.8% Never married32.5% Now married0.0% Separated0.0% Widowed9.7% DivorcedFemales 13.9% Never married43.5% Now married9.4% Separated3.6% Widowed29.6% DivorcedWomen who gave birth in the past 12 months Now married:
100.0% (28)Unmarried:
0.0% (0)
Women who did not give birth in the past 12 months Now married:
52.9% (91)Unmarried:
47.1% (81)
Marital status - Other race population 15 years and over
Males 16.3% Never married47.2% Now married7.9% Separated24.4% Widowed4.3% DivorcedFemales 36.4% Never married36.2% Now married4.4% Separated19.3% Widowed3.7% DivorcedWomen who did not give birth in the past 12 months Now married:
28.7% (167)Unmarried:
71.3% (414)
Marital status - Two or more races population 15 years and over
Males 43.2% Never married56.3% Now married0.0% Separated0.0% Widowed0.5% DivorcedFemales 27.2% Never married50.7% Now married0.0% Separated3.3% Widowed18.8% DivorcedWomen who gave birth in the past 12 months Now married:
58.8% (30)Unmarried:
41.2% (21)
Women who did not give birth in the past 12 months Now married:
57.9% (223)Unmarried:
42.1% (162)
Marital status - White alone, not Hispanic / Latino population 15 years and over
Males 50.7% Never married34.9% Now married1.7% Separated3.2% Widowed9.5% DivorcedFemales 28.8% Never married36.2% Now married5.2% Separated8.6% Widowed21.2% DivorcedWomen who gave birth in the past 12 months Now married:
69.6% (31)Unmarried:
30.4% (13)
Women who did not give birth in the past 12 months Now married:
28.5% (375)Unmarried:
71.5% (941)
Marital status - Hispanic or Latino population 15 years and over
Males 45.6% Never married40.2% Now married2.0% Separated6.0% Widowed6.1% DivorcedFemales 32.3% Never married42.1% Now married2.4% Separated13.1% Widowed10.1% DivorcedWomen who gave birth in the past 12 months Now married:
67.4% (30)Unmarried:
32.6% (14)
Women who did not give birth in the past 12 months Now married:
39.9% (373)Unmarried:
60.1% (561)
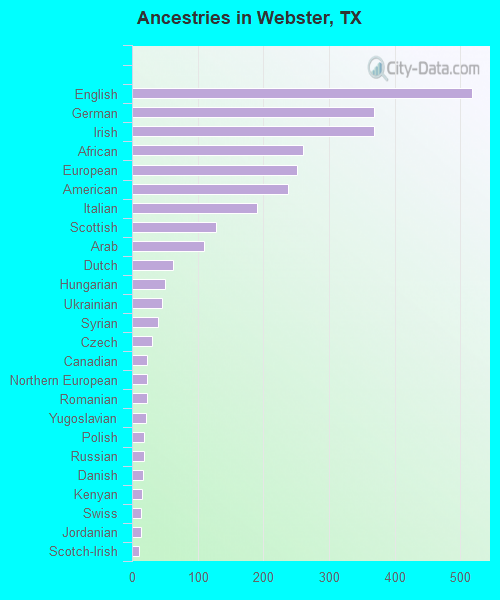
Ancestries in Webster
518 6.7% English368 4.7% German368 4.7% Irish261 3.4% African251 3.2% European237 3.1% American190 2.4% Italian128 1.6% Scottish110 1.4% Arab62 0.8% Dutch51 0.7% Hungarian45 0.6% Ukrainian40 0.5% Syrian30 0.4% Czech23 0.3% Canadian23 0.3% Northern European23 0.3% Romanian22 0.3% Yugoslavian19 0.2% Polish18 0.2% Russian16 0.2% Danish15 0.2% Kenyan14 0.2% Swiss13 0.2% Jordanian11 0.1% Scotch-Irish7 0.09% Haitian3 0.04% Croatian
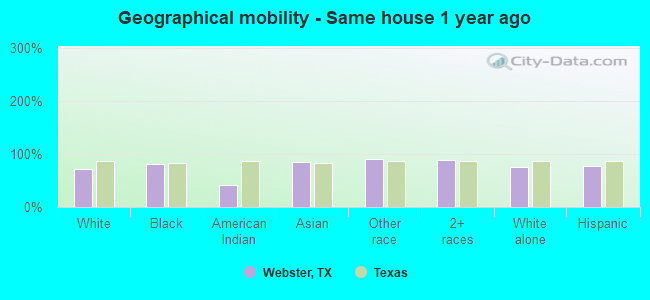
Geographical mobility in Webster Same house 1 year ago 3,713 72.0% White (Caucasian)1,501 81.3% Black or African American24 41.5% American Indian / Alaska Native467 84.2% Asian1,708 90.1% Other race1,859 88.9% Two or more races4,101 75.8% White alone, not Hispanic / Latino3,091 77.2% Hispanic or LatinoMoved within same county 760 14.7% White / Caucasian201 10.9% Black or African American36 6.4% Asian184 8.8% Two or more races624 11.5% White alone, not Hispanic / Latino525 13.1% Hispanic or LatinoMoved within same state 426 8.3% White / Caucasian88 4.8% Black or African American22 38.4% American Indian / Alaska Native22 4.0% Asian70 3.7% Other race31 1.5% Two or more races408 7.5% White alone, not Hispanic / Latino172 4.3% Hispanic or LatinoMoved from different state 340 6.6% White / Caucasian44 2.4% Black or African American12 2.1% Asian106 5.6% Other race6 0.3% Two or more races269 5.0% White alone, not Hispanic / Latino231 5.8% Hispanic or LatinoMoved from abroad 15 2.8% Asian
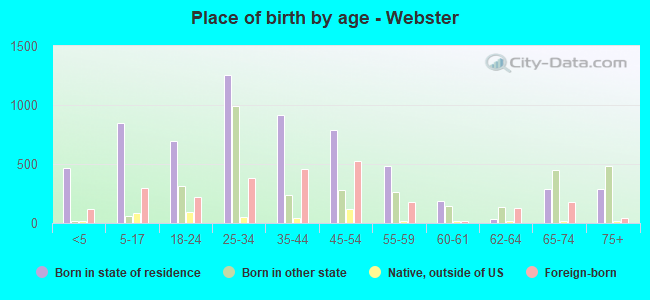
Children Nativity (place of birth) in Webster
Children under 6 years - Living with two parents Both parents native 113 100.0% NativeBoth parents foreign-born 41 100.0% NativeOne native, one foreign-born parent 154 100.0% NativeChildren under 6 years - Living with one parent Native parent 77 95.9% Native3 4.1% Foreign-bornForeign-born parent 107 100.0% Foreign-bornChildren 6 to 17 years - Living with two parents Both parents native 104 100.0% NativeBoth parents foreign-born 40 67.1% Native20 32.9% Foreign-bornOne native, one foreign-born parent 39 79.8% Native10 20.2% Foreign-bornChildren 6 to 17 years - Living with one parent Native parent 419 80.0% Native105 20.0% Foreign-bornForeign-born parent 349 72.6% Native131 27.4% Foreign-born