Races in Wenham, Massachusetts (MA) Detailed Stats
Ancestries, Foreign-born residents, place of birth

Recent posts about races in Wenham, Massachusetts on our local forum with over 2,400,000 registered users:
 | towns that offer the most jobs per dollar of house (58 replies) |
| Post homes in MA that people like (55 replies) |
| Towns within 495 with nice walkable downtowns and good schools (205 replies) |
| Wow, $206K over list! (236 replies) |
| Pick a New England place for us (62 replies) |
| Moving to MA from out of state - figuring out how to pick the "right" suburb for me and my family (81 replies) |
Latest news about races in Wenham, MA collected exclusively by city-data.com from local newspapers, TV, and radio stations
4.0% of Wenham, MA residents are foreign-born (2.3% born in Europe, 1.4% born in North America), which is 351.5% less than the foreign-born rate of 18.0% across the entire state of Massachusetts.
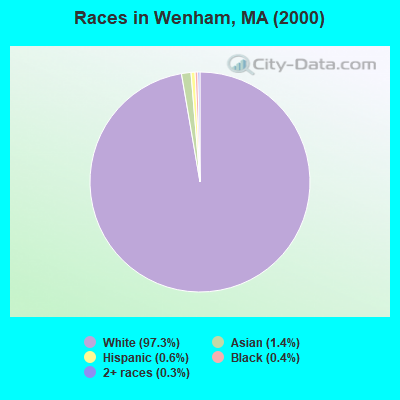
Race distribution in Wenham

- 4,32297.3%White alone
- 601.4%Asian alone
- 260.6%Hispanic
- 190.4%Black alone
- 120.3%Two or more races
- 10.02%American Indian alone
2000
2022
-
- 5,198,35981.9%White alone
- 428,7296.8%Hispanic
- 318,3295.0%Black alone
- 236,7863.7%Asian alone
- 110,3381.7%Two or more races
- 43,5860.7%Other race alone
- 11,2640.2%American Indian alone
- 1,7060.03%Native Hawaiian and Other
Pacific Islander alone

-
- 4,676,62767.0%White alone
- 911,03813.0%Hispanic
- 501,4637.2%Asian alone
- 459,7406.6%Black alone
- 341,8894.9%Two or more races
- 84,4031.2%Other race alone
- 5,8380.08%American Indian alone
- 9760.01%Native Hawaiian and Other
Pacific Islander alone

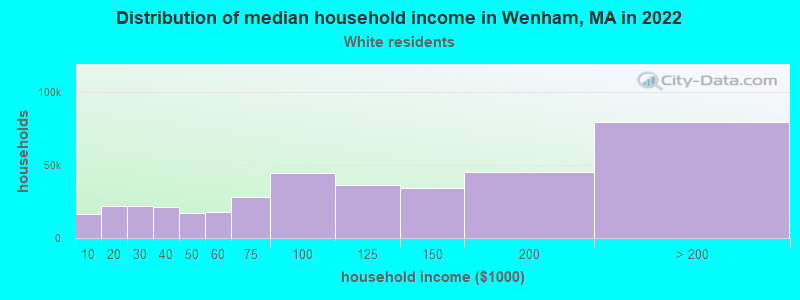
Income and house value in Wenham
- Median household income in 2022
- $169,283White non-Hispanic householders
- Median 2022 house value
- over $1,000,000White Non-Hispanic householders
Household income for White non-Hispanic householders
Foreign-born residents in Wenham
177 residents are foreign born (2.3% Europe, 1.4% North America).
| This city: | 4.0% |
| Massachusetts: | 12.2% |
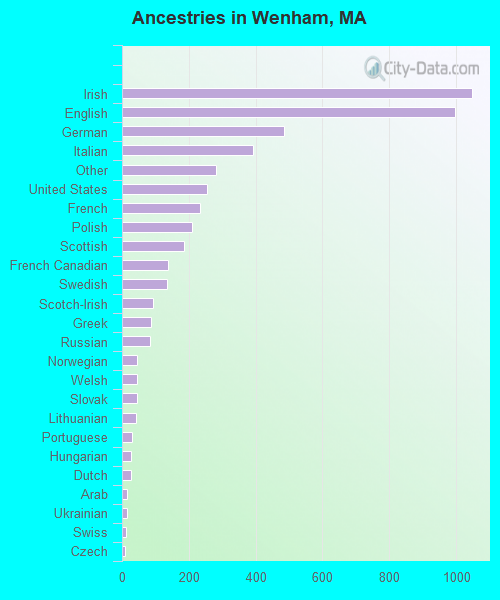
Ancestries in Wenham

- 1,04621.2%Irish
- 99820.2%English
- 4849.8%German
- 3927.9%Italian
- 2805.7%Other
- 2535.1%United States
- 2334.7%French
- 2104.3%Polish
- 1853.8%Scottish
- 1382.8%French Canadian
- 1342.7%Swedish
- 941.9%Scotch-Irish
- 881.8%Greek
- 841.7%Russian
- 460.9%Norwegian
- 450.9%Welsh
- 440.9%Slovak
- 410.8%Lithuanian
- 310.6%Portuguese
- 280.6%Hungarian
- 260.5%Dutch
- 160.3%Arab
- 150.3%Ukrainian
- 110.2%Swiss
- 100.2%Czech
Zip codes: 01984.