Races in West Bend, Wisconsin (WI) Detailed Stats
Data:
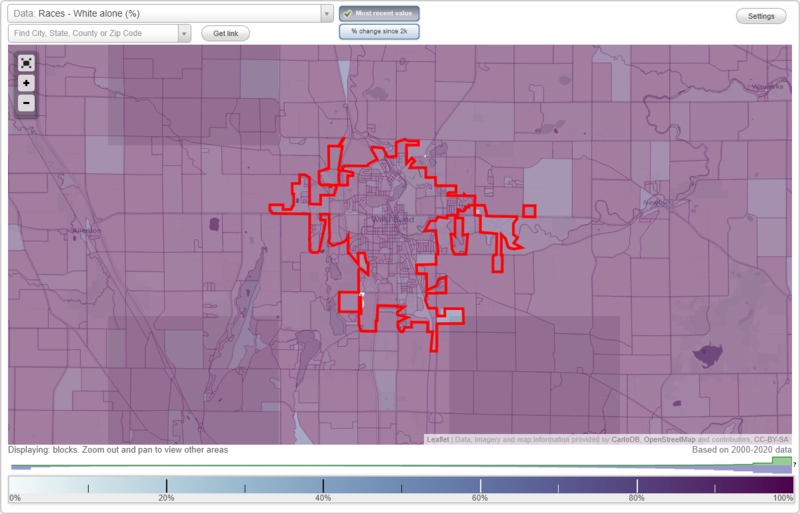
Races - White alone (%)
Races - White alone (% change since 2000)
Races - Black alone (%)
Races - Black alone (% change since 2000)
Races - American Indian alone (%)
Races - American Indian alone (% change since 2000)
Races - Asian alone (%)
Races - Asian alone (% change since 2000)
Races - Hispanic (%)
Races - Hispanic (% change since 2000)
Races - Native Hawaiian and Other Pacific Islander alone (%)
Races - Native Hawaiian and Other Pacific Islander alone (% change since 2000)
Races - Two or more races(%)
Races - Two or more races(% change since 2000)
Races - Other race alone (%)
Races - Other race alone (% change since 2000)
Racial diversity
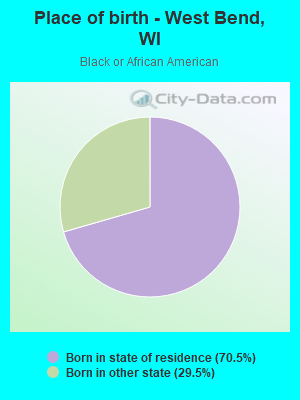
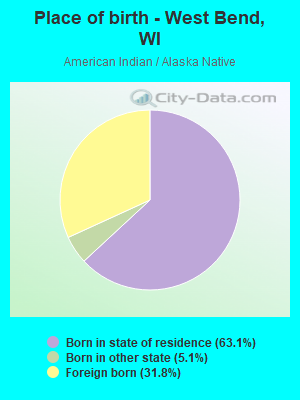
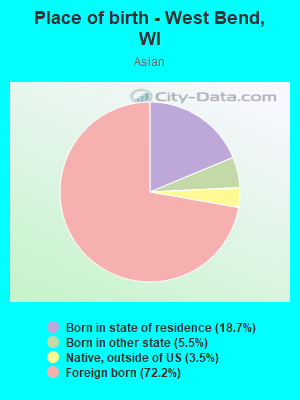
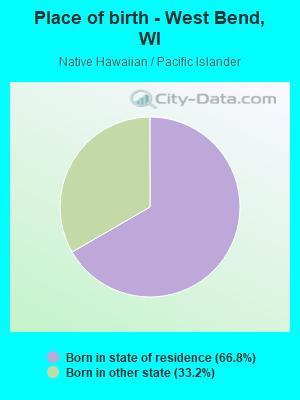
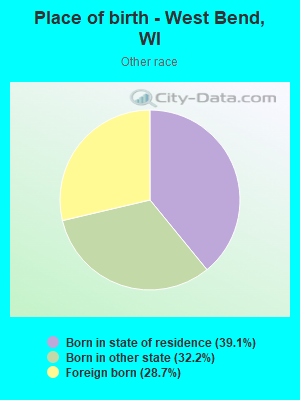
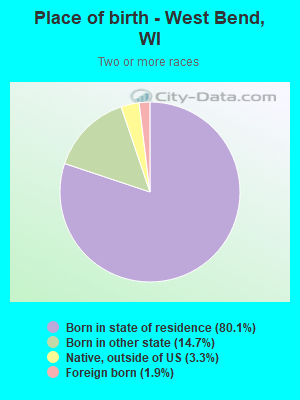
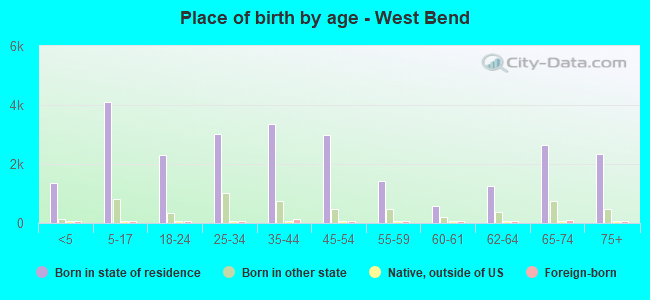
Place of birth - Born in state of residence (%)
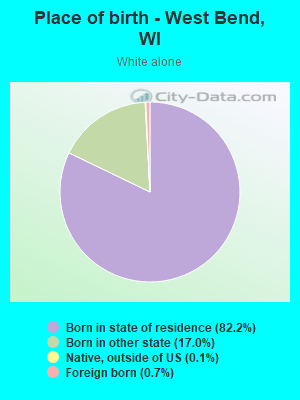
Place of birth - Born in state of residence (%) - White
Place of birth - Born in state of residence (%) - Black or African American
Place of birth - Born in state of residence (%) - Asian
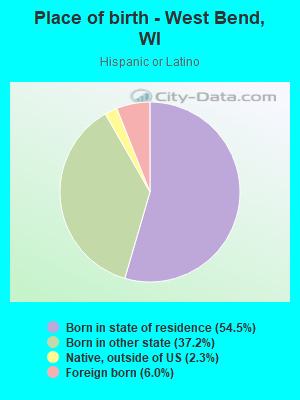
Place of birth - Born in state of residence (%) - Hispanic or Latino
Place of birth - Born in state of residence (%) - American Indian and Alaska Native
Place of birth - Born in state of residence (%) - Multirace
Place of birth - Born in state of residence (%) - Other Race
Place of birth - Born in other state (%)
Place of birth - Born in other state (%) - White
Place of birth - Born in other state (%) - Black or African American
Place of birth - Born in other state (%) - Asian
Place of birth - Born in other state (%) - Hispanic or Latino
Place of birth - Born in other state (%) - American Indian and Alaska Native
Place of birth - Born in other state (%) - Multirace
Place of birth - Born in other state (%) - Other Race
Place of birth - Native, outside of US (%)
Place of birth - Native, outside of US (%) - White
Place of birth - Native, outside of US (%) - Black or African American
Place of birth - Native, outside of US (%) - Asian
Place of birth - Native, outside of US (%) - Hispanic or Latino
Place of birth - Native, outside of US (%) - American Indian and Alaska Native
Place of birth - Native, outside of US (%) - Multirace
Place of birth - Native, outside of US (%) - Other Race
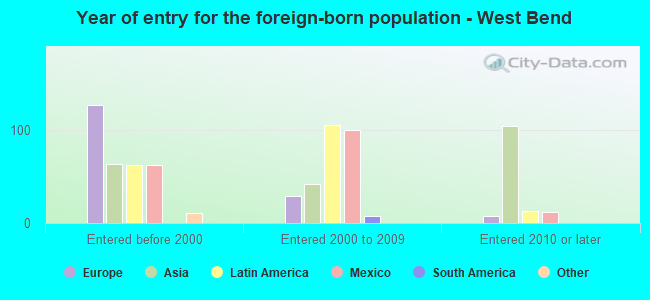
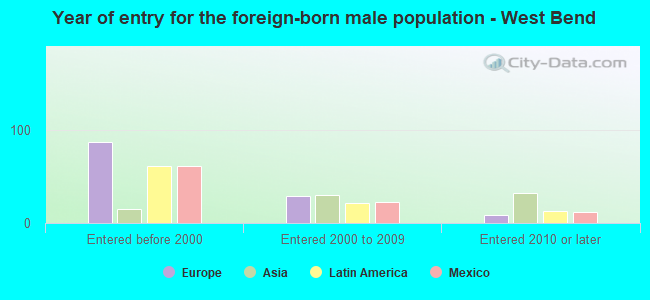
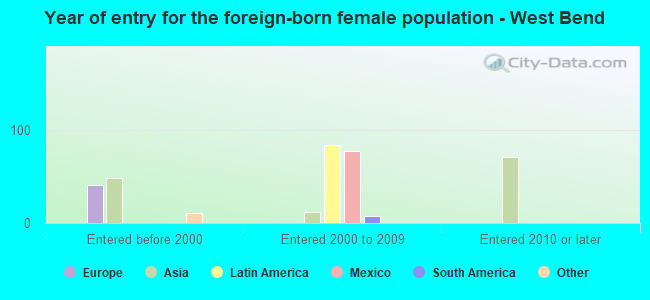
Place of birth - Foreign born (%)
Place of birth - Foreign born (%) - White
Place of birth - Foreign born (%) - Black or African American
Place of birth - Foreign born (%) - Asian
Place of birth - Foreign born (%) - Hispanic or Latino
Place of birth - Foreign born (%) - American Indian and Alaska Native
Place of birth - Foreign born (%) - Multirace
Place of birth - Foreign born (%) - Other Race
Residents speaking English at home (%)
Residents speaking English at home - Born in the United States (%)
Residents speaking English at home - Native, born elsewhere (%)
Residents speaking English at home - Foreign born (%)
Residents speaking Spanish at home (%)
Residents speaking Spanish at home - Born in the United States (%)
Residents speaking Spanish at home - Native, born elsewhere (%)
Residents speaking Spanish at home - Foreign born (%)
Residents speaking other language at home (%)
Residents speaking other language at home - Born in the United States (%)
Residents speaking other language at home - Native, born elsewhere (%)
Residents speaking other language at home - Foreign born (%)
Marital status - Never married (%)
Marital status - Now married (%)
Marital status - Separated (%)
Marital status - Widowed (%)
Marital status - Divorced (%)
Ancestries Reported - Arab (%)
Ancestries Reported - Czech (%)
Ancestries Reported - Danish (%)
Ancestries Reported - Dutch (%)
Ancestries Reported - English (%)
Ancestries Reported - French (%)
Ancestries Reported - French Canadian (%)
Ancestries Reported - German (%)
Ancestries Reported - Greek (%)
Ancestries Reported - Hungarian (%)
Ancestries Reported - Irish (%)
Ancestries Reported - Italian (%)
Ancestries Reported - Lithuanian (%)
Ancestries Reported - Norwegian (%)
Ancestries Reported - Polish (%)
Ancestries Reported - Portuguese (%)
Ancestries Reported - Russian (%)
Ancestries Reported - Scotch-Irish (%)
Ancestries Reported - Scottish (%)
Ancestries Reported - Slovak (%)
Ancestries Reported - Subsaharan African (%)
Ancestries Reported - Swedish (%)
Ancestries Reported - Swiss (%)
Ancestries Reported - Ukrainian (%)
Ancestries Reported - United States (%)
Ancestries Reported - Welsh (%)
Ancestries Reported - West Indian (%)
Ancestries Reported - Other (%)
Geographical mobility - Same house 1 year ago (%)
Geographical mobility - Same house 1 year ago (%) - White
Geographical mobility - Same house 1 year ago (%) - Black or African American
Geographical mobility - Same house 1 year ago (%) - Asian
Geographical mobility - Same house 1 year ago (%) - Hispanic or Latino
Geographical mobility - Same house 1 year ago (%) - American Indian and Alaska Native
Geographical mobility - Same house 1 year ago (%) - Multirace
Geographical mobility - Same house 1 year ago (%) - Other Race
Geographical mobility - Moved within same county (%)
Geographical mobility - Moved within same county (%) - White
Geographical mobility - Moved within same county (%) - Black or African American
Geographical mobility - Moved within same county (%) - Asian
Geographical mobility - Moved within same county (%) - Hispanic or Latino
Geographical mobility - Moved within same county (%) - American Indian and Alaska Native
Geographical mobility - Moved within same county (%) - Multirace
Geographical mobility - Moved within same county (%) - Other Race
Geographical mobility - Moved from different county within same state (%)
Geographical mobility - Moved from different county within same state (%) - White
Geographical mobility - Moved from different county within same state (%) - Black or African American
Geographical mobility - Moved from different county within same state (%) - Asian
Geographical mobility - Moved from different county within same state (%) - Hispanic or Latino
Geographical mobility - Moved from different county within same state (%) - American Indian and Alaska Native
Geographical mobility - Moved from different county within same state (%) - Multirace
Geographical mobility - Moved from different county within same state (%) - Other Race
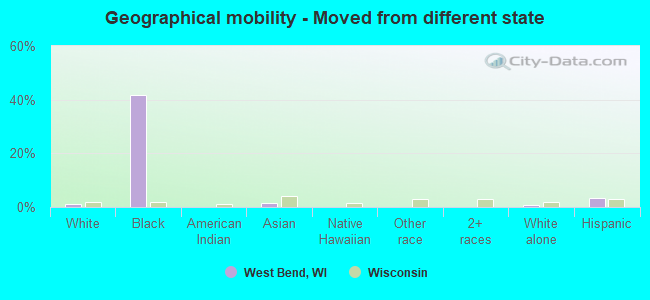
Geographical mobility - Moved from different state (%)
Geographical mobility - Moved from different state (%) - White
Geographical mobility - Moved from different state (%) - Black or African American
Geographical mobility - Moved from different state (%) - Asian
Geographical mobility - Moved from different state (%) - Hispanic or Latino
Geographical mobility - Moved from different state (%) - American Indian and Alaska Native
Geographical mobility - Moved from different state (%) - Multirace
Geographical mobility - Moved from different state (%) - Other Race
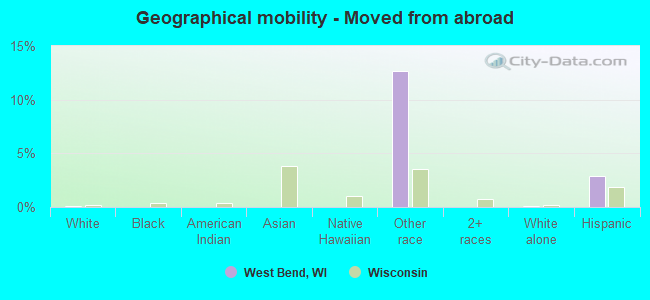
Geographical mobility - Moved from abroad (%)
Geographical mobility - Moved from abroad (%) - White
Geographical mobility - Moved from abroad (%) - Black or African American
Geographical mobility - Moved from abroad (%) - Asian
Geographical mobility - Moved from abroad (%) - Hispanic or Latino
Geographical mobility - Moved from abroad (%) - American Indian and Alaska Native
Geographical mobility - Moved from abroad (%) - Multirace
Geographical mobility - Moved from abroad (%) - Other Race
Place of birth for the foreign-born population - Ireland (%)
Place of birth for the foreign-born population - Denmark (%)
Place of birth for the foreign-born population - Norway (%)
Place of birth for the foreign-born population - Sweden (%)
Place of birth for the foreign-born population - United Kingdom (%)
Place of birth for the foreign-born population - England (%)
Place of birth for the foreign-born population - Scotland (%)
Place of birth for the foreign-born population - Other Northern Europe (%)
Place of birth for the foreign-born population - Austria (%)
Place of birth for the foreign-born population - Belgium (%)
Place of birth for the foreign-born population - France (%)
Place of birth for the foreign-born population - Germany (%)
Place of birth for the foreign-born population - Netherlands (%)
Place of birth for the foreign-born population - Switzerland (%)
Place of birth for the foreign-born population - Other Western Europe (%)
Place of birth for the foreign-born population - Greece (%)
Place of birth for the foreign-born population - Italy (%)
Place of birth for the foreign-born population - Portugal (%)
Place of birth for the foreign-born population - Spain (%)
Place of birth for the foreign-born population - Other Southern Europe (%)
Place of birth for the foreign-born population - Albania (%)
Place of birth for the foreign-born population - Belarus (%)
Place of birth for the foreign-born population - Bosnia and Herzegovina (%)
Place of birth for the foreign-born population - Bulgaria (%)
Place of birth for the foreign-born population - Croatia (%)
Place of birth for the foreign-born population - Czechoslovakia (%)
Place of birth for the foreign-born population - Hungary (%)
Place of birth for the foreign-born population - Latvia (%)
Place of birth for the foreign-born population - Lithuania (%)
Place of birth for the foreign-born population - North Macedonia (Macedonia) (%)
Place of birth for the foreign-born population - Moldova (%)
Place of birth for the foreign-born population - Poland (%)
Place of birth for the foreign-born population - Romania (%)
Place of birth for the foreign-born population - Russia (%)
Place of birth for the foreign-born population - Serbia (%)
Place of birth for the foreign-born population - Ukraine (%)
Place of birth for the foreign-born population - Other Eastern Europe (%)
Place of birth for the foreign-born population - China (%)
Place of birth for the foreign-born population - Hong Kong (%)
Place of birth for the foreign-born population - Taiwan (%)
Place of birth for the foreign-born population - Japan (%)
Place of birth for the foreign-born population - Korea (%)
Place of birth for the foreign-born population - Other Eastern Asia (%)
Place of birth for the foreign-born population - Afghanistan (%)
Place of birth for the foreign-born population - Bangladesh (%)
Place of birth for the foreign-born population - India (%)
Place of birth for the foreign-born population - Iran (%)
Place of birth for the foreign-born population - Kazakhstan (%)
Place of birth for the foreign-born population - Nepal (%)
Place of birth for the foreign-born population - Pakistan (%)
Place of birth for the foreign-born population - Sri Lanka (%)
Place of birth for the foreign-born population - Uzbekistan (%)
Place of birth for the foreign-born population - Other South Central Asia (%)
Place of birth for the foreign-born population - Burma (%)
Place of birth for the foreign-born population - Cambodia (%)
Place of birth for the foreign-born population - Indonesia (%)
Place of birth for the foreign-born population - Laos (%)
Place of birth for the foreign-born population - Malaysia (%)
Place of birth for the foreign-born population - Philippines (%)
Place of birth for the foreign-born population - Singapore (%)
Place of birth for the foreign-born population - Thailand (%)
Place of birth for the foreign-born population - Vietnam (%)
Place of birth for the foreign-born population - Other South Eastern Asia (%)
Place of birth for the foreign-born population - Armenia (%)
Place of birth for the foreign-born population - Iraq (%)
Place of birth for the foreign-born population - Israel (%)
Place of birth for the foreign-born population - Jordan (%)
Place of birth for the foreign-born population - Kuwait (%)
Place of birth for the foreign-born population - Lebanon (%)
Place of birth for the foreign-born population - Saudi Arabia (%)
Place of birth for the foreign-born population - Syria (%)
Place of birth for the foreign-born population - Turkey (%)
Place of birth for the foreign-born population - Yemen (%)
Place of birth for the foreign-born population - Other Western Asia (%)
Place of birth for the foreign-born population - Eritrea (%)
Place of birth for the foreign-born population - Ethiopia (%)
Place of birth for the foreign-born population - Kenya (%)
Place of birth for the foreign-born population - Somalia (%)
Place of birth for the foreign-born population - Uganda (%)
Place of birth for the foreign-born population - Zimbabwe (%)
Place of birth for the foreign-born population - Other Eastern Africa (%)
Place of birth for the foreign-born population - Cameroon (%)
Place of birth for the foreign-born population - Congo (%)
Place of birth for the foreign-born population - Democratic Republic of Congo (Zaire) (%)
Place of birth for the foreign-born population - Other Middle Africa (%)
Place of birth for the foreign-born population - Egypt (%)
Place of birth for the foreign-born population - Morocco (%)
Place of birth for the foreign-born population - Sudan (%)
Place of birth for the foreign-born population - Other Northern Africa (%)
Place of birth for the foreign-born population - South Africa (%)
Place of birth for the foreign-born population - Other Southern Africa (%)
Place of birth for the foreign-born population - Cabo Verde (%)
Place of birth for the foreign-born population - Ghana (%)
Place of birth for the foreign-born population - Liberia (%)
Place of birth for the foreign-born population - Nigeria (%)
Place of birth for the foreign-born population - Senegal (%)
Place of birth for the foreign-born population - Sierra Leone (%)
Place of birth for the foreign-born population - Other Western Africa (%)
Place of birth for the foreign-born population - Australia (%)
Place of birth for the foreign-born population - New Zealand (%)
Place of birth for the foreign-born population - Fiji (%)
Place of birth for the foreign-born population - Micronesia (%)
Place of birth for the foreign-born population - Bahamas (%)
Place of birth for the foreign-born population - Barbados (%)
Place of birth for the foreign-born population - Cuba (%)
Place of birth for the foreign-born population - Dominica (%)
Place of birth for the foreign-born population - Dominican Republic (%)
Place of birth for the foreign-born population - Grenada (%)
Place of birth for the foreign-born population - Haiti (%)
Place of birth for the foreign-born population - Jamaica (%)
Place of birth for the foreign-born population - St. Vincent and the Grenadines (%)
Place of birth for the foreign-born population - Trinidad and Tobago (%)
Place of birth for the foreign-born population - West Indies (%)
Place of birth for the foreign-born population - Other Caribbean (%)
Place of birth for the foreign-born population - Belize (%)
Place of birth for the foreign-born population - Costa Rica (%)
Place of birth for the foreign-born population - El Salvador (%)
Place of birth for the foreign-born population - Guatemala (%)
Place of birth for the foreign-born population - Honduras (%)
Place of birth for the foreign-born population - Mexico (%)
Place of birth for the foreign-born population - Nicaragua (%)
Place of birth for the foreign-born population - Panama (%)
Place of birth for the foreign-born population - Other Central America (%)
Place of birth for the foreign-born population - Argentina (%)
Place of birth for the foreign-born population - Bolivia (%)
Place of birth for the foreign-born population - Brazil (%)
Place of birth for the foreign-born population - Chile (%)
Place of birth for the foreign-born population - Colombia (%)
Place of birth for the foreign-born population - Ecuador (%)
Place of birth for the foreign-born population - Guyana (%)
Place of birth for the foreign-born population - Peru (%)
Place of birth for the foreign-born population - Uruguay (%)
Place of birth for the foreign-born population - Venezuela (%)
Place of birth for the foreign-born population - Other South America (%)
Place of birth for the foreign-born population - Canada (%)
Place of birth for the foreign-born population - Other Northern America (%)
Place of birth for the foreign-born population - Other (%)
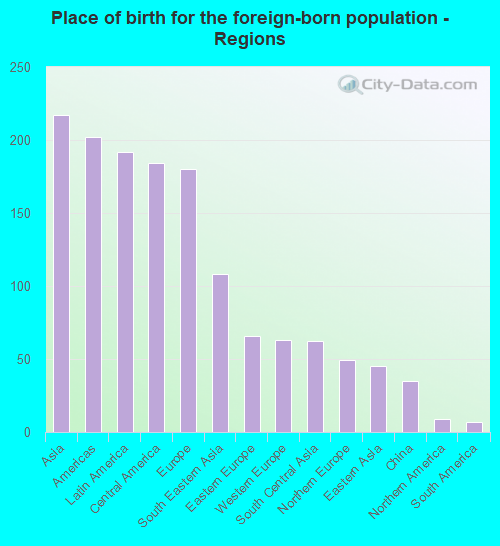
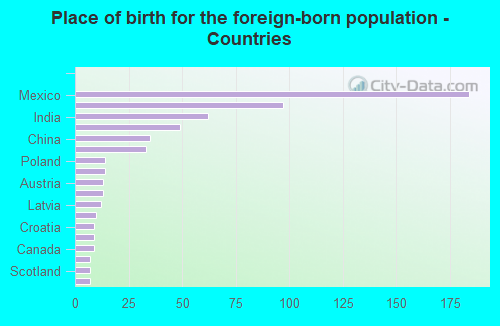
According to 2022 data, the most numerous races in West Bend, WI are White alone (28,252 residents), Hispanic (1,399 residents), and Black alone (401 residents). 96.7% of West Bend residents speak English at home. 1.9% of West Bend, WI residents are foreign-born , which is 165.6% less than the foreign-born rate of 5.0% across the entire state of Wisconsin.
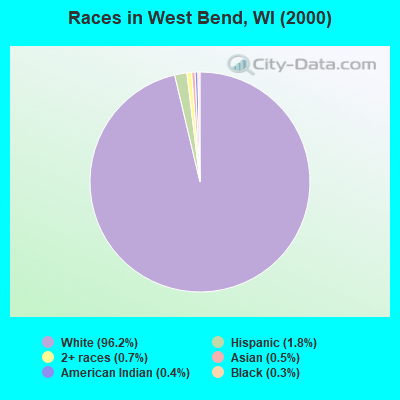
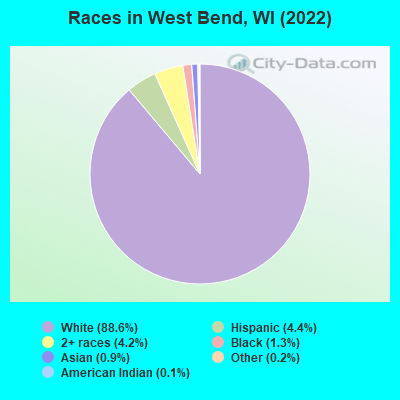
Race distribution in West Bend
2000 2022
4,681,630 87.3% White alone 300,245 5.6% Black alone 192,921 3.6% Hispanic 87,995 1.6% Asian alone 51,921 1.0% Two or more races 43,980 0.8% American Indian alone 3,637 0.07% Other race alone 1,346 0.03% Native Hawaiian and Other
4,654,031 79.0% White alone 447,022 7.6% Hispanic 345,678 5.9% Black alone 217,532 3.7% Two or more races 172,242 2.9% Asian alone 33,762 0.6% American Indian alone 19,680 0.3% Other race alone 2,592 0.04% Native Hawaiian and Other
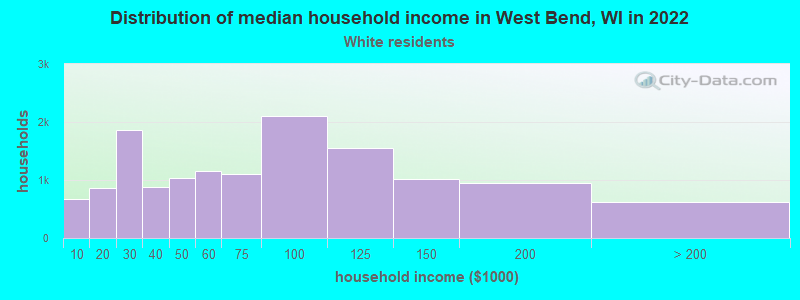
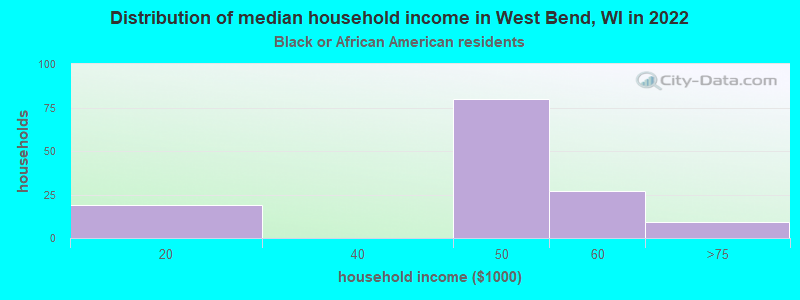
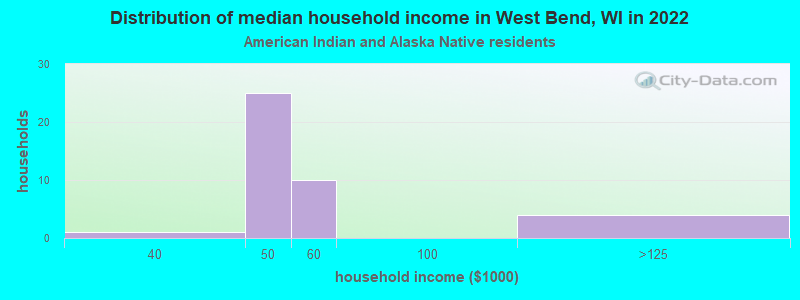
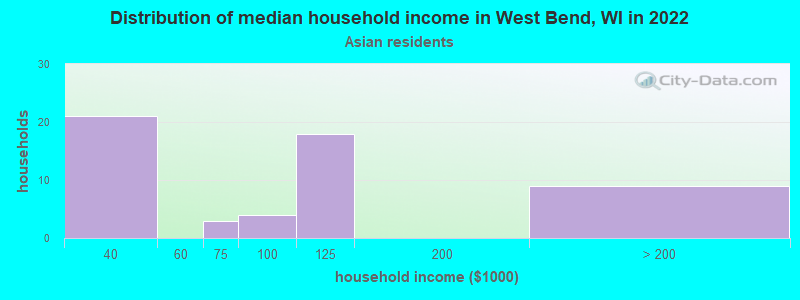
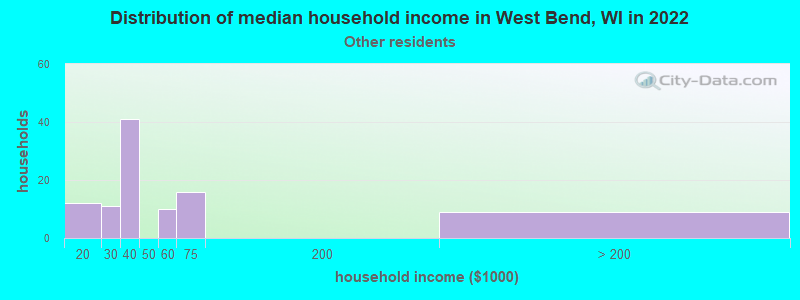
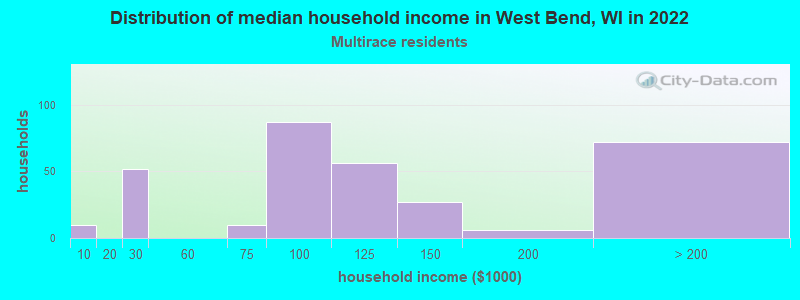
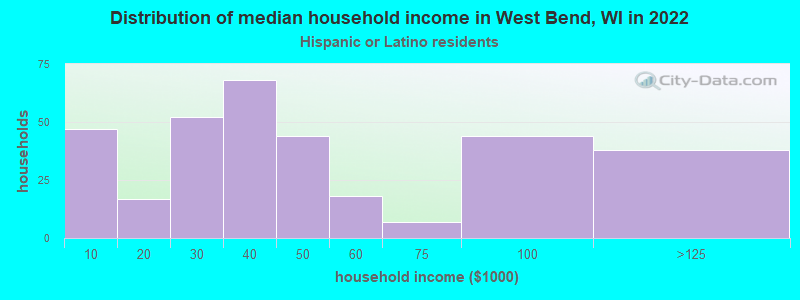
Income and house value in West Bend Median household income in 2022 $70,720 White non-Hispanic householders$45,925 Black householders$45,356 American Indian and Alaska Native householders$106,064 Asian householders$42,985 Some other race householders$88,464 Two or more races householders$49,846 Hispanic or Latino race householdersMedian 2022 house value $247,170 White Non-Hispanic householders$303,591 Black or African American householders$166,088 American Indian or Alaska Native householders $303,591 Asian householders$303,591 Some other race householders$264,732 Hispanic or Latino householders
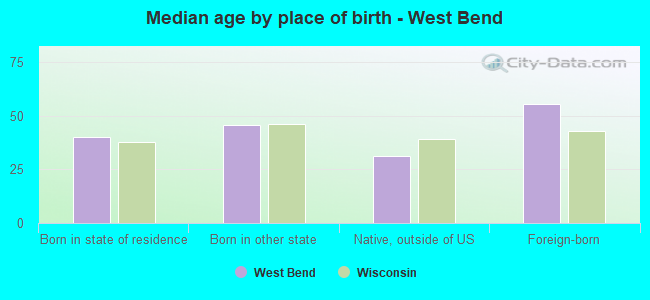
Median age by race in West Bend
42.8 Median age for White residents40.2 45.3 46.8 Median age for Black or African American residents53.0 38.5 40.3 Median age for American Indian / Alaska Native residents16.7 32.5 51.8 Median age for Asian residents52.9 49.3 -825,688,072.6 Median age for Native Hawaiian / Pacific Islander residents-862,745,097.2 -666,666,666.0 29.1 Median age for Other race residents45.0 20.3 21.7 Median age for Two or more races residents20.2 24.7 43.4 Median age for White alone residents40.8 45.8 20.5 Median age for Hispanic or Latino residents19.5 19.7
Owner/renter occupied households by race in West Bend
House owners and renters - White residents 9,067 68.3% Owner occupied4,200 31.7% Renter occupiedHouse owners and renters - Black or African American residents 92 60.7% Owner occupied59 39.3% Renter occupiedHouse owners and renters - American Indian / Alaska Native residents 6 15.0% Owner occupied32 85.0% Renter occupiedHouse owners and renters - Asian residents 47 85.7% Owner occupied8 14.3% Renter occupiedHouse owners and renters - Native Hawaiian / Pacific Islander residents 12 100.0% Owner occupiedHouse owners and renters - Other race residents 40 39.8% Owner occupied60 60.2% Renter occupiedHouse owners and renters - Two or more races residents 286 68.8% Owner occupied130 31.2% Renter occupiedHouse owners and renters - White alone residents 8,951 68.3% Owner occupied4,153 31.7% Renter occupiedHouse owners and renters - Hispanic or Latino residents 268 72.6% Owner occupied101 27.4% Renter occupied
Language usage in West Bend
English speakers - Total 96.7% of residents of West Bend speak English at home.
1.3% of residents speak Spanish at home 276 68.8% Speak English very well125 31.2% Speak English less than very well1.9% of residents speak other language at home 463 79.1% Speak English very well122 20.9% Speak English less than very well
English speakers - Born in the United States 98.8% of residents of West Bend speak English at home.
0.9% of residents speak Spanish at home 46 95.8% Speak English very well2 4.2% Speak English less than very well0.1% of residents speak other language at home 7 100.0% Speak English very well
English speakers - Native, born elsewhere 60.2% of residents of West Bend speak English at home.
43.2% of residents speak Spanish at home 38 100.0% Speak English very well
English speakers - Foreign-born 30.3% of residents of West Bend speak English at home.
26.8% of residents speak Spanish at home 77 47.8% Speak English very well84 52.2% Speak English less than very well40.1% of residents speak other language at home 146 60.6% Speak English very well95 39.4% Speak English less than very well
White (Caucasian) - Speak only English Native:
98.8% (27,022)Foreign-born:
36.5% (81)
White (Caucasian) - Speak another language Native:
1.2% (332)Foreign-born:
62.7% (140)
American Indian / Alaska Native - Speak only English Native:
85.3% (68)Foreign-born:
95.6% (35)
Asian - Speak only English Native:
41.3% (25)Foreign-born:
28.4% (62)
Asian - Speak another language Native:
66.6% (40)Foreign-born:
72.3% (159)
Other race - Speak another language Native:
5.3% (11)Foreign-born:
98.8% (97)
Two or more races - Speak only English Native:
80.7% (1,263)Foreign-born:
35.4% (45)
Two or more races - Speak another language Native:
16.9% (265)Foreign-born:
54.0% (69)
White alone - Speak only English Native:
98.8% (26,506)Foreign-born:
35.9% (75)
White alone - Speak another language Native:
1.2% (334)Foreign-born:
63.6% (132)
Hispanic or Latino - Speak only English Native:
84.5% (922)Foreign-born:
16.3% (32)
Hispanic or Latino - Speak another language Native:
17.4% (190)Foreign-born:
82.4% (162)
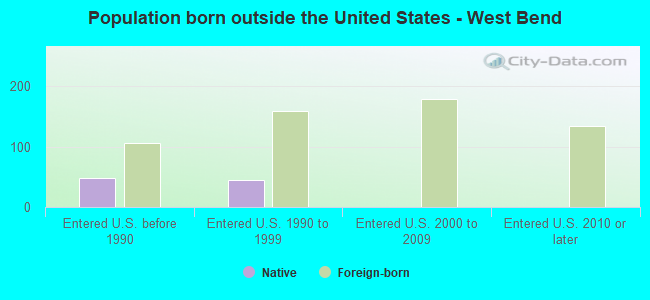
Foreign-born residents in West Bend 600 residents are foreign born
This city:
1.9%Wisconsin:
5.0%
Marital status for residents in West Bend Marital status - White (Caucasian) population 15 years and over
Males 33.3% Never married51.4% Now married0.3% Separated2.9% Widowed12.1% DivorcedFemales 24.4% Never married48.7% Now married0.7% Separated10.9% Widowed15.2% DivorcedWomen who gave birth in the past 12 months Now married:
87.5% (218)Unmarried:
12.5% (31)
Women who did not give birth in the past 12 months Now married:
47.9% (2,769)Unmarried:
52.1% (3,016)
Marital status - Black or African American population 15 years and over
Males 30.7% Never married48.7% Now married0.0% Separated0.0% Widowed20.7% DivorcedFemales 39.4% Never married43.4% Now married9.1% Separated4.0% Widowed4.0% DivorcedWomen who did not give birth in the past 12 months Now married:
68.2% (139)Unmarried:
31.8% (65)
Marital status - American Indian / Alaska Native population 15 years and over
Males 32.5% Never married0.0% Now married0.0% Separated0.0% Widowed67.5% DivorcedFemales 48.1% Never married18.5% Now married0.0% Separated3.7% Widowed29.6% DivorcedWomen who did not give birth in the past 12 months Now married:
100.0% (5)Unmarried:
0.0% (0)
Marital status - Asian population 15 years and over
Males 10.2% Never married85.2% Now married0.0% Separated0.0% Widowed4.5% DivorcedFemales 26.5% Never married50.4% Now married8.8% Separated7.1% Widowed7.1% DivorcedWomen who did not give birth in the past 12 months Now married:
54.1% (33)Unmarried:
45.9% (28)
Marital status - Other race population 15 years and over
Males 30.3% Never married30.9% Now married0.0% Separated0.0% Widowed38.8% DivorcedFemales 21.6% Never married48.6% Now married20.7% Separated0.0% Widowed9.0% DivorcedWomen who did not give birth in the past 12 months Now married:
71.4% (54)Unmarried:
28.6% (22)
Marital status - Two or more races population 15 years and over
Males 56.1% Never married36.8% Now married0.0% Separated0.0% Widowed7.1% DivorcedFemales 59.7% Never married32.1% Now married4.0% Separated0.0% Widowed4.3% DivorcedWomen who did not give birth in the past 12 months Now married:
29.9% (143)Unmarried:
70.1% (335)
Marital status - White alone, not Hispanic / Latino population 15 years and over
Males 33.4% Never married51.2% Now married0.3% Separated3.0% Widowed12.2% DivorcedFemales 23.9% Never married49.0% Now married0.7% Separated11.1% Widowed15.4% DivorcedWomen who gave birth in the past 12 months Now married:
87.5% (216)Unmarried:
12.5% (31)
Women who did not give birth in the past 12 months Now married:
48.3% (2,726)Unmarried:
51.7% (2,917)
Marital status - Hispanic or Latino population 15 years and over
Males 54.4% Never married23.3% Now married0.0% Separated1.5% Widowed20.8% DivorcedFemales 67.3% Never married22.7% Now married10.0% Separated0.0% Widowed0.0% DivorcedWomen who did not give birth in the past 12 months Now married:
31.4% (108)Unmarried:
68.6% (236)
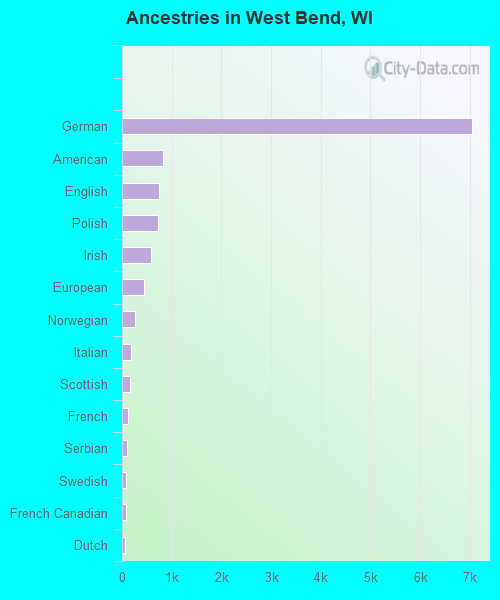
Ancestries in West Bend
7,033 51.2% German826 6.0% American753 5.5% English724 5.3% Polish583 4.2% Irish436 3.2% European262 1.9% Norwegian173 1.3% Italian164 1.2% Scottish125 0.9% French98 0.7% Serbian77 0.6% Swedish71 0.5% French Canadian67 0.5% Dutch62 0.5% Czech43 0.3% Finnish42 0.3% Danish41 0.3% Greek37 0.3% Ukrainian34 0.2% Czechoslovakian33 0.2% Northern European27 0.2% Scandinavian24 0.2% Luxembourger21 0.2% Albanian21 0.2% Welsh18 0.1% Slovak16 0.1% British14 0.1% Hungarian12 0.09% Canadian12 0.09% Swiss10 0.07% Croatian10 0.07% Austrian10 0.07% Eastern European9 0.07% Russian5 0.04% Portuguese5 0.04% Slovene
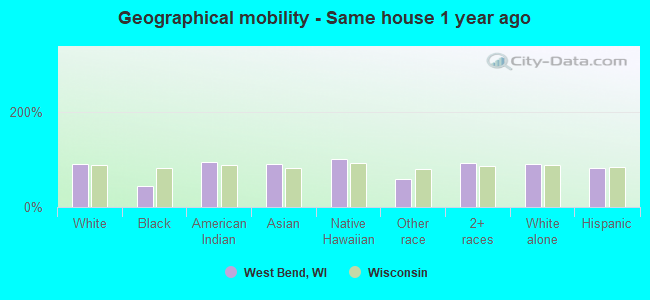
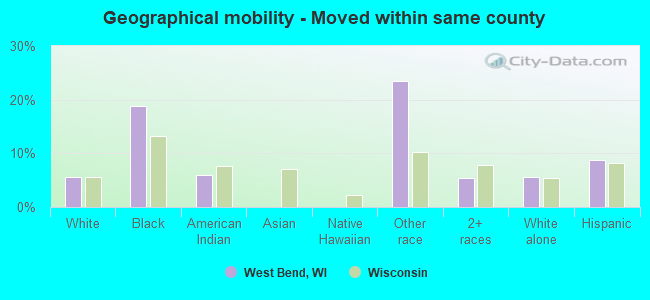
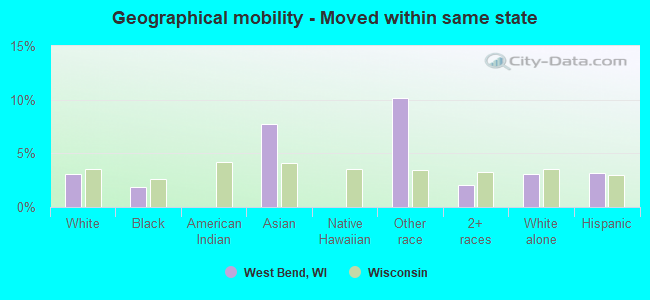
Geographical mobility in West Bend Same house 1 year ago 25,705 89.7% White (Caucasian)236 44.4% Black or African American104 95.3% American Indian / Alaska Native235 90.9% Asian14 100.0% Native Hawaiian / Pacific Islander194 58.7% Other race1,907 92.9% Two or more races25,236 89.9% White alone, not Hispanic / Latino1,122 82.2% Hispanic or LatinoMoved within same county 1,612 5.6% White / Caucasian100 18.8% Black or African American7 6.0% American Indian / Alaska Native78 23.6% Other race109 5.3% Two or more races1,577 5.6% White alone, not Hispanic / Latino119 8.7% Hispanic or LatinoMoved within same state 874 3.1% White / Caucasian10 1.9% Black or African American20 7.7% Asian33 10.1% Other race42 2.1% Two or more races876 3.1% White alone, not Hispanic / Latino43 3.2% Hispanic or LatinoMoved from different state 285 1.0% White / Caucasian222 41.7% Black or African American4 1.7% Asian215 0.8% White alone, not Hispanic / Latino48 3.5% Hispanic or LatinoMoved from abroad 15 0.1% White42 12.7% Other race16 0.1% White alone, not Hispanic / Latino39 2.9% Hispanic or Latino
Children Nativity (place of birth) in West Bend
Children under 6 years - Living with two parents Both parents native 1,416 100.0% NativeBoth parents foreign-born 8 100.0% NativeOne native, one foreign-born parent 74 100.0% NativeChildren under 6 years - Living with one parent Native parent 431 100.0% NativeChildren 6 to 17 years - Living with two parents Both parents native 2,694 100.0% NativeBoth parents foreign-born 12 44.1% Native15 55.9% Foreign-bornOne native, one foreign-born parent 60 100.0% NativeChildren 6 to 17 years - Living with one parent Native parent 1,626 100.0% NativeForeign-born parent 120 48.4% Native128 51.6% Foreign-born
Grandparents responsible for own grandchildren in West Bend
Grandparents (30 to 59 years) White / Caucasian 69 100.0% Not responsible for grandchildrenOther race 12 100.0% Responsible for grandchildrenWhite alone, not Hispanic / Latino 56 100.0% Not responsible for grandchildrenHispanic or Latino 8 27.0% Responsible for grandchildren22 73.0% Not responsible for grandchildrenGrandparents (60 years and over) White / Caucasian 31 23.9% Responsible for grandchildren98 76.1% Not responsible for grandchildrenWhite alone, not Hispanic / Latino 31 23.4% Responsible for grandchildren102 76.6% Not responsible for grandchildren