Races in West Haven, Utah (UT) Detailed Stats
Data:
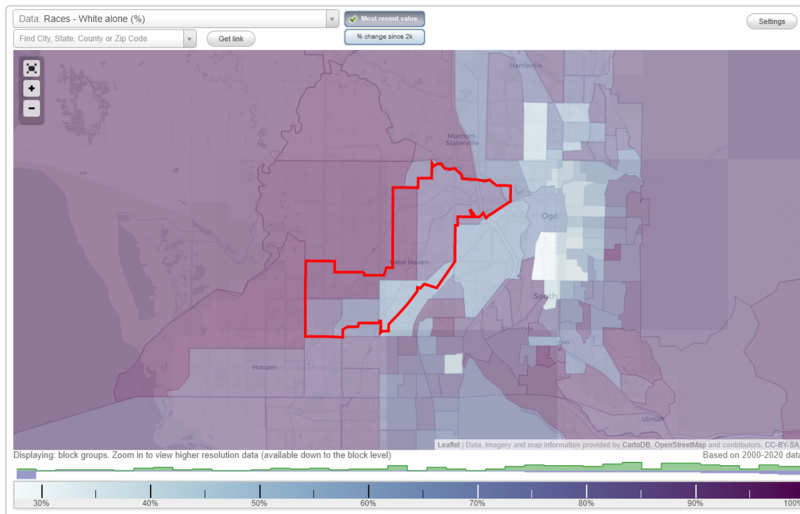
Races - White alone (%)
Races - White alone (% change since 2000)
Races - Black alone (%)
Races - Black alone (% change since 2000)
Races - American Indian alone (%)
Races - American Indian alone (% change since 2000)
Races - Asian alone (%)
Races - Asian alone (% change since 2000)
Races - Hispanic (%)
Races - Hispanic (% change since 2000)
Races - Native Hawaiian and Other Pacific Islander alone (%)
Races - Native Hawaiian and Other Pacific Islander alone (% change since 2000)
Races - Two or more races(%)
Races - Two or more races(% change since 2000)
Races - Other race alone (%)
Races - Other race alone (% change since 2000)
Racial diversity
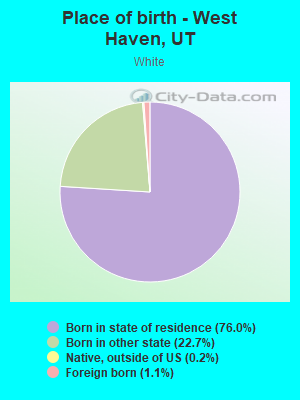
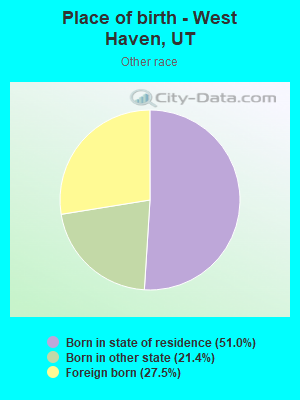
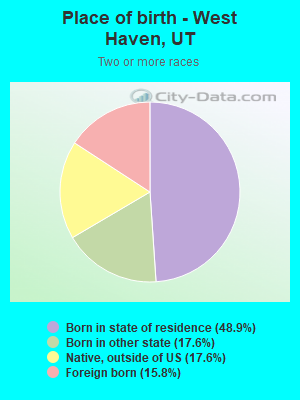
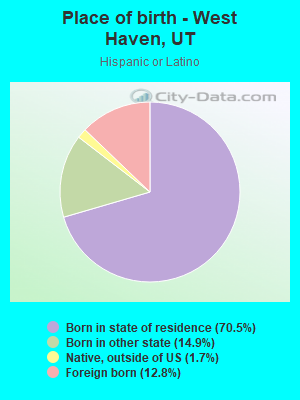
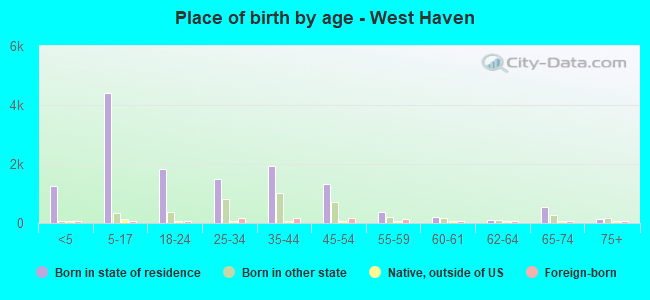
Place of birth - Born in state of residence (%)
Place of birth - Born in state of residence (%) - White
Place of birth - Born in state of residence (%) - Black or African American
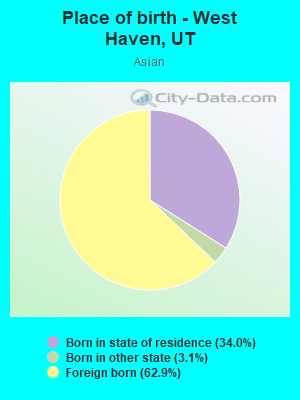
Place of birth - Born in state of residence (%) - Asian
Place of birth - Born in state of residence (%) - Hispanic or Latino
Place of birth - Born in state of residence (%) - American Indian and Alaska Native
Place of birth - Born in state of residence (%) - Multirace
Place of birth - Born in state of residence (%) - Other Race
Place of birth - Born in other state (%)
Place of birth - Born in other state (%) - White
Place of birth - Born in other state (%) - Black or African American
Place of birth - Born in other state (%) - Asian
Place of birth - Born in other state (%) - Hispanic or Latino
Place of birth - Born in other state (%) - American Indian and Alaska Native
Place of birth - Born in other state (%) - Multirace
Place of birth - Born in other state (%) - Other Race
Place of birth - Native, outside of US (%)
Place of birth - Native, outside of US (%) - White
Place of birth - Native, outside of US (%) - Black or African American
Place of birth - Native, outside of US (%) - Asian
Place of birth - Native, outside of US (%) - Hispanic or Latino
Place of birth - Native, outside of US (%) - American Indian and Alaska Native
Place of birth - Native, outside of US (%) - Multirace
Place of birth - Native, outside of US (%) - Other Race
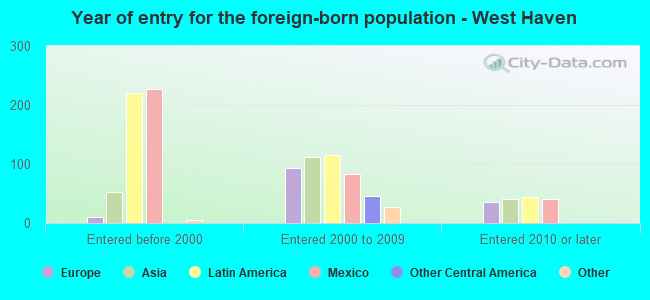
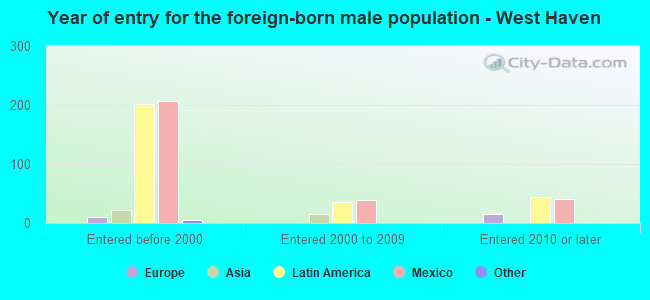
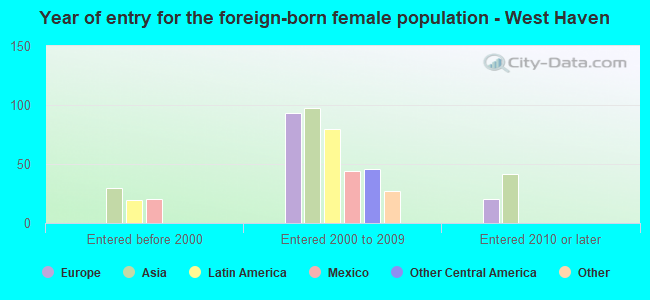
Place of birth - Foreign born (%)
Place of birth - Foreign born (%) - White
Place of birth - Foreign born (%) - Black or African American
Place of birth - Foreign born (%) - Asian
Place of birth - Foreign born (%) - Hispanic or Latino
Place of birth - Foreign born (%) - American Indian and Alaska Native
Place of birth - Foreign born (%) - Multirace
Place of birth - Foreign born (%) - Other Race
Residents speaking English at home (%)
Residents speaking English at home - Born in the United States (%)
Residents speaking English at home - Native, born elsewhere (%)
Residents speaking English at home - Foreign born (%)
Residents speaking Spanish at home (%)
Residents speaking Spanish at home - Born in the United States (%)
Residents speaking Spanish at home - Native, born elsewhere (%)
Residents speaking Spanish at home - Foreign born (%)
Residents speaking other language at home (%)
Residents speaking other language at home - Born in the United States (%)
Residents speaking other language at home - Native, born elsewhere (%)
Residents speaking other language at home - Foreign born (%)
Marital status - Never married (%)
Marital status - Now married (%)
Marital status - Separated (%)
Marital status - Widowed (%)
Marital status - Divorced (%)
Ancestries Reported - Arab (%)
Ancestries Reported - Czech (%)
Ancestries Reported - Danish (%)
Ancestries Reported - Dutch (%)
Ancestries Reported - English (%)
Ancestries Reported - French (%)
Ancestries Reported - French Canadian (%)
Ancestries Reported - German (%)
Ancestries Reported - Greek (%)
Ancestries Reported - Hungarian (%)
Ancestries Reported - Irish (%)
Ancestries Reported - Italian (%)
Ancestries Reported - Lithuanian (%)
Ancestries Reported - Norwegian (%)
Ancestries Reported - Polish (%)
Ancestries Reported - Portuguese (%)
Ancestries Reported - Russian (%)
Ancestries Reported - Scotch-Irish (%)
Ancestries Reported - Scottish (%)
Ancestries Reported - Slovak (%)
Ancestries Reported - Subsaharan African (%)
Ancestries Reported - Swedish (%)
Ancestries Reported - Swiss (%)
Ancestries Reported - Ukrainian (%)
Ancestries Reported - United States (%)
Ancestries Reported - Welsh (%)
Ancestries Reported - West Indian (%)
Ancestries Reported - Other (%)
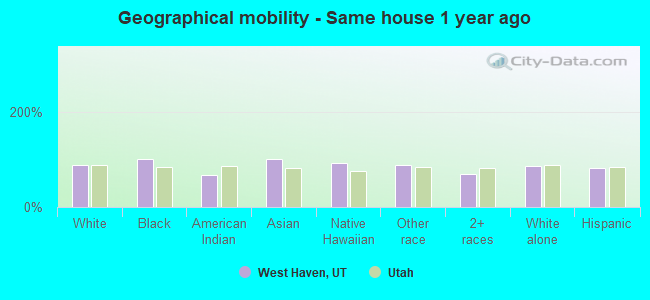
Geographical mobility - Same house 1 year ago (%)
Geographical mobility - Same house 1 year ago (%) - White
Geographical mobility - Same house 1 year ago (%) - Black or African American
Geographical mobility - Same house 1 year ago (%) - Asian
Geographical mobility - Same house 1 year ago (%) - Hispanic or Latino
Geographical mobility - Same house 1 year ago (%) - American Indian and Alaska Native
Geographical mobility - Same house 1 year ago (%) - Multirace
Geographical mobility - Same house 1 year ago (%) - Other Race
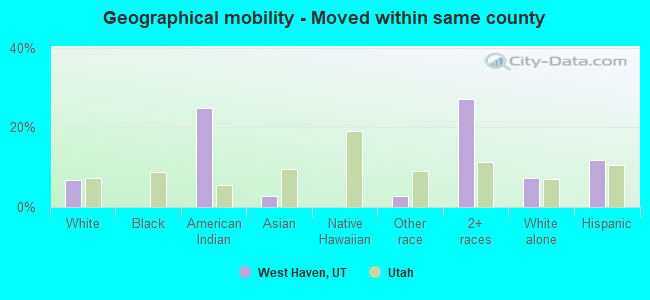
Geographical mobility - Moved within same county (%)
Geographical mobility - Moved within same county (%) - White
Geographical mobility - Moved within same county (%) - Black or African American
Geographical mobility - Moved within same county (%) - Asian
Geographical mobility - Moved within same county (%) - Hispanic or Latino
Geographical mobility - Moved within same county (%) - American Indian and Alaska Native
Geographical mobility - Moved within same county (%) - Multirace
Geographical mobility - Moved within same county (%) - Other Race
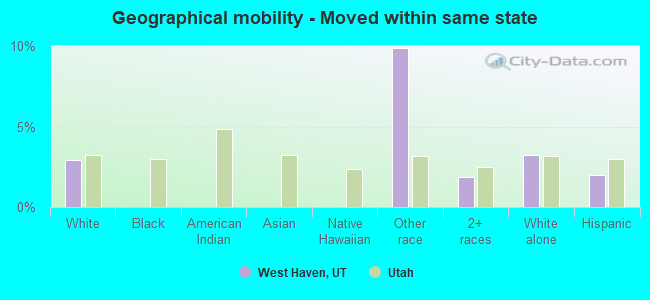
Geographical mobility - Moved from different county within same state (%)
Geographical mobility - Moved from different county within same state (%) - White
Geographical mobility - Moved from different county within same state (%) - Black or African American
Geographical mobility - Moved from different county within same state (%) - Asian
Geographical mobility - Moved from different county within same state (%) - Hispanic or Latino
Geographical mobility - Moved from different county within same state (%) - American Indian and Alaska Native
Geographical mobility - Moved from different county within same state (%) - Multirace
Geographical mobility - Moved from different county within same state (%) - Other Race
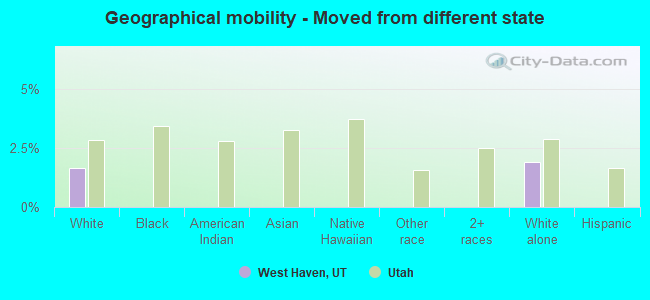
Geographical mobility - Moved from different state (%)
Geographical mobility - Moved from different state (%) - White
Geographical mobility - Moved from different state (%) - Black or African American
Geographical mobility - Moved from different state (%) - Asian
Geographical mobility - Moved from different state (%) - Hispanic or Latino
Geographical mobility - Moved from different state (%) - American Indian and Alaska Native
Geographical mobility - Moved from different state (%) - Multirace
Geographical mobility - Moved from different state (%) - Other Race
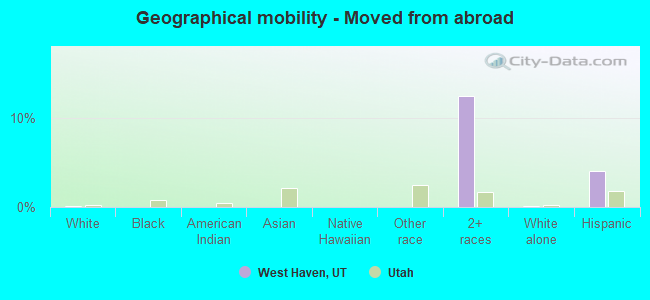
Geographical mobility - Moved from abroad (%)
Geographical mobility - Moved from abroad (%) - White
Geographical mobility - Moved from abroad (%) - Black or African American
Geographical mobility - Moved from abroad (%) - Asian
Geographical mobility - Moved from abroad (%) - Hispanic or Latino
Geographical mobility - Moved from abroad (%) - American Indian and Alaska Native
Geographical mobility - Moved from abroad (%) - Multirace
Geographical mobility - Moved from abroad (%) - Other Race
Place of birth for the foreign-born population - Ireland (%)
Place of birth for the foreign-born population - Denmark (%)
Place of birth for the foreign-born population - Norway (%)
Place of birth for the foreign-born population - Sweden (%)
Place of birth for the foreign-born population - United Kingdom (%)
Place of birth for the foreign-born population - England (%)
Place of birth for the foreign-born population - Scotland (%)
Place of birth for the foreign-born population - Other Northern Europe (%)
Place of birth for the foreign-born population - Austria (%)
Place of birth for the foreign-born population - Belgium (%)
Place of birth for the foreign-born population - France (%)
Place of birth for the foreign-born population - Germany (%)
Place of birth for the foreign-born population - Netherlands (%)
Place of birth for the foreign-born population - Switzerland (%)
Place of birth for the foreign-born population - Other Western Europe (%)
Place of birth for the foreign-born population - Greece (%)
Place of birth for the foreign-born population - Italy (%)
Place of birth for the foreign-born population - Portugal (%)
Place of birth for the foreign-born population - Spain (%)
Place of birth for the foreign-born population - Other Southern Europe (%)
Place of birth for the foreign-born population - Albania (%)
Place of birth for the foreign-born population - Belarus (%)
Place of birth for the foreign-born population - Bosnia and Herzegovina (%)
Place of birth for the foreign-born population - Bulgaria (%)
Place of birth for the foreign-born population - Croatia (%)
Place of birth for the foreign-born population - Czechoslovakia (%)
Place of birth for the foreign-born population - Hungary (%)
Place of birth for the foreign-born population - Latvia (%)
Place of birth for the foreign-born population - Lithuania (%)
Place of birth for the foreign-born population - North Macedonia (Macedonia) (%)
Place of birth for the foreign-born population - Moldova (%)
Place of birth for the foreign-born population - Poland (%)
Place of birth for the foreign-born population - Romania (%)
Place of birth for the foreign-born population - Russia (%)
Place of birth for the foreign-born population - Serbia (%)
Place of birth for the foreign-born population - Ukraine (%)
Place of birth for the foreign-born population - Other Eastern Europe (%)
Place of birth for the foreign-born population - China (%)
Place of birth for the foreign-born population - Hong Kong (%)
Place of birth for the foreign-born population - Taiwan (%)
Place of birth for the foreign-born population - Japan (%)
Place of birth for the foreign-born population - Korea (%)
Place of birth for the foreign-born population - Other Eastern Asia (%)
Place of birth for the foreign-born population - Afghanistan (%)
Place of birth for the foreign-born population - Bangladesh (%)
Place of birth for the foreign-born population - India (%)
Place of birth for the foreign-born population - Iran (%)
Place of birth for the foreign-born population - Kazakhstan (%)
Place of birth for the foreign-born population - Nepal (%)
Place of birth for the foreign-born population - Pakistan (%)
Place of birth for the foreign-born population - Sri Lanka (%)
Place of birth for the foreign-born population - Uzbekistan (%)
Place of birth for the foreign-born population - Other South Central Asia (%)
Place of birth for the foreign-born population - Burma (%)
Place of birth for the foreign-born population - Cambodia (%)
Place of birth for the foreign-born population - Indonesia (%)
Place of birth for the foreign-born population - Laos (%)
Place of birth for the foreign-born population - Malaysia (%)
Place of birth for the foreign-born population - Philippines (%)
Place of birth for the foreign-born population - Singapore (%)
Place of birth for the foreign-born population - Thailand (%)
Place of birth for the foreign-born population - Vietnam (%)
Place of birth for the foreign-born population - Other South Eastern Asia (%)
Place of birth for the foreign-born population - Armenia (%)
Place of birth for the foreign-born population - Iraq (%)
Place of birth for the foreign-born population - Israel (%)
Place of birth for the foreign-born population - Jordan (%)
Place of birth for the foreign-born population - Kuwait (%)
Place of birth for the foreign-born population - Lebanon (%)
Place of birth for the foreign-born population - Saudi Arabia (%)
Place of birth for the foreign-born population - Syria (%)
Place of birth for the foreign-born population - Turkey (%)
Place of birth for the foreign-born population - Yemen (%)
Place of birth for the foreign-born population - Other Western Asia (%)
Place of birth for the foreign-born population - Eritrea (%)
Place of birth for the foreign-born population - Ethiopia (%)
Place of birth for the foreign-born population - Kenya (%)
Place of birth for the foreign-born population - Somalia (%)
Place of birth for the foreign-born population - Uganda (%)
Place of birth for the foreign-born population - Zimbabwe (%)
Place of birth for the foreign-born population - Other Eastern Africa (%)
Place of birth for the foreign-born population - Cameroon (%)
Place of birth for the foreign-born population - Congo (%)
Place of birth for the foreign-born population - Democratic Republic of Congo (Zaire) (%)
Place of birth for the foreign-born population - Other Middle Africa (%)
Place of birth for the foreign-born population - Egypt (%)
Place of birth for the foreign-born population - Morocco (%)
Place of birth for the foreign-born population - Sudan (%)
Place of birth for the foreign-born population - Other Northern Africa (%)
Place of birth for the foreign-born population - South Africa (%)
Place of birth for the foreign-born population - Other Southern Africa (%)
Place of birth for the foreign-born population - Cabo Verde (%)
Place of birth for the foreign-born population - Ghana (%)
Place of birth for the foreign-born population - Liberia (%)
Place of birth for the foreign-born population - Nigeria (%)
Place of birth for the foreign-born population - Senegal (%)
Place of birth for the foreign-born population - Sierra Leone (%)
Place of birth for the foreign-born population - Other Western Africa (%)
Place of birth for the foreign-born population - Australia (%)
Place of birth for the foreign-born population - New Zealand (%)
Place of birth for the foreign-born population - Fiji (%)
Place of birth for the foreign-born population - Micronesia (%)
Place of birth for the foreign-born population - Bahamas (%)
Place of birth for the foreign-born population - Barbados (%)
Place of birth for the foreign-born population - Cuba (%)
Place of birth for the foreign-born population - Dominica (%)
Place of birth for the foreign-born population - Dominican Republic (%)
Place of birth for the foreign-born population - Grenada (%)
Place of birth for the foreign-born population - Haiti (%)
Place of birth for the foreign-born population - Jamaica (%)
Place of birth for the foreign-born population - St. Vincent and the Grenadines (%)
Place of birth for the foreign-born population - Trinidad and Tobago (%)
Place of birth for the foreign-born population - West Indies (%)
Place of birth for the foreign-born population - Other Caribbean (%)
Place of birth for the foreign-born population - Belize (%)
Place of birth for the foreign-born population - Costa Rica (%)
Place of birth for the foreign-born population - El Salvador (%)
Place of birth for the foreign-born population - Guatemala (%)
Place of birth for the foreign-born population - Honduras (%)
Place of birth for the foreign-born population - Mexico (%)
Place of birth for the foreign-born population - Nicaragua (%)
Place of birth for the foreign-born population - Panama (%)
Place of birth for the foreign-born population - Other Central America (%)
Place of birth for the foreign-born population - Argentina (%)
Place of birth for the foreign-born population - Bolivia (%)
Place of birth for the foreign-born population - Brazil (%)
Place of birth for the foreign-born population - Chile (%)
Place of birth for the foreign-born population - Colombia (%)
Place of birth for the foreign-born population - Ecuador (%)
Place of birth for the foreign-born population - Guyana (%)
Place of birth for the foreign-born population - Peru (%)
Place of birth for the foreign-born population - Uruguay (%)
Place of birth for the foreign-born population - Venezuela (%)
Place of birth for the foreign-born population - Other South America (%)
Place of birth for the foreign-born population - Canada (%)
Place of birth for the foreign-born population - Other Northern America (%)
Place of birth for the foreign-born population - Other (%)
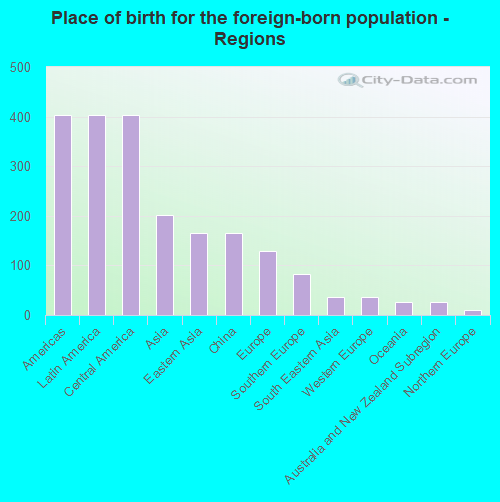
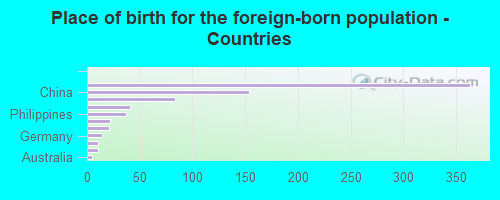
According to 2022 data, the most numerous races in West Haven, UT are White alone (13,848 residents), Hispanic (3,599 residents), and Two or more races (775 residents). 88.3% of West Haven residents speak English at home. 4.1% of West Haven, UT residents are foreign-born (2.1% born in Latin America, 1.0% born in Asia, 0.7% born in Europe), which is 96.8% less than the foreign-born rate of 8.0% across the entire state of Utah.
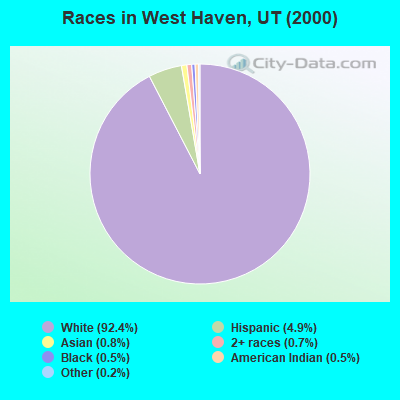
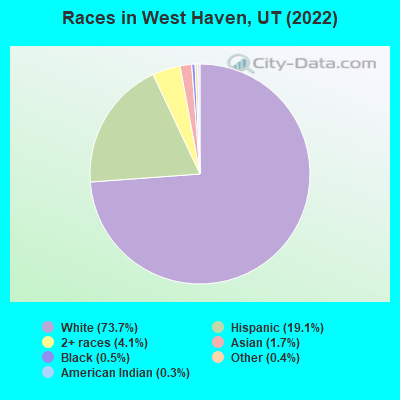
Race distribution in West Haven
2000 2022
1,904,265 85.3% White alone 201,559 9.0% Hispanic 36,483 1.6% Asian alone 31,308 1.4% Two or more races 26,663 1.2% American Indian alone 14,806 0.7% Native Hawaiian and Other 16,137 0.7% Black alone 1,948 0.09% Other race alone
2,557,466 75.6% White alone 512,086 15.1% Hispanic 119,308 3.5% Two or more races 82,388 2.4% Asian alone 36,978 1.1% Native Hawaiian and Other 34,873 1.0% Black alone 22,803 0.7% American Indian alone 14,898 0.4% Other race alone
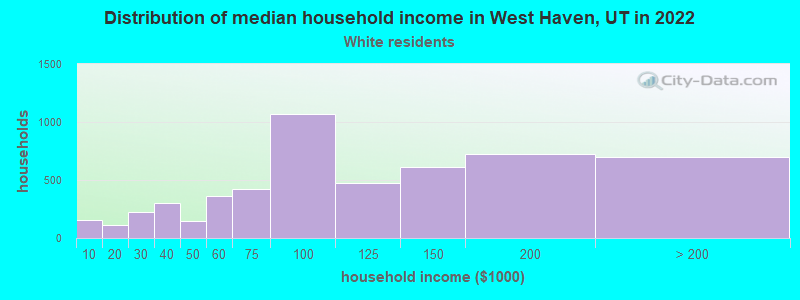
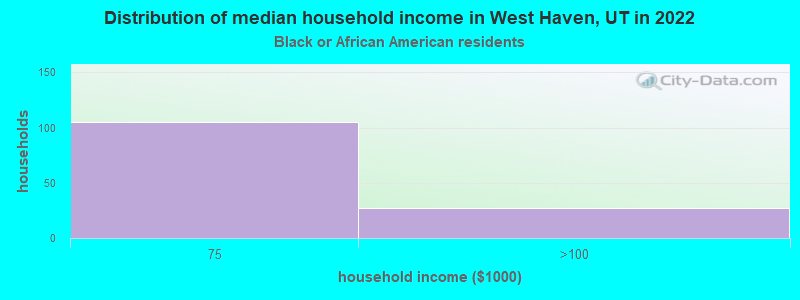
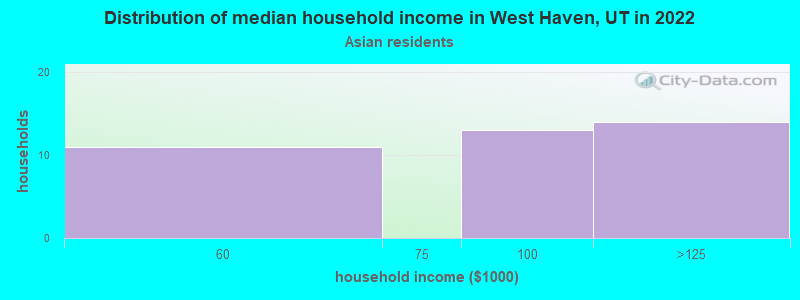
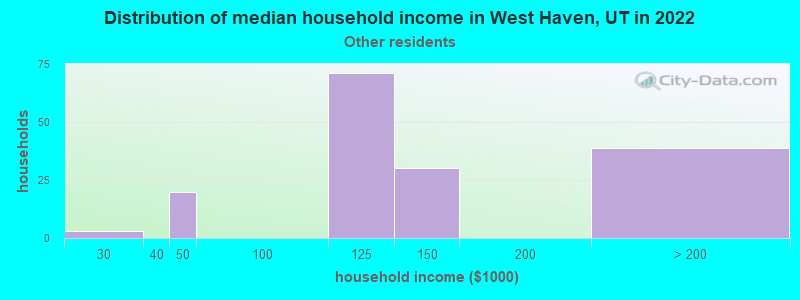
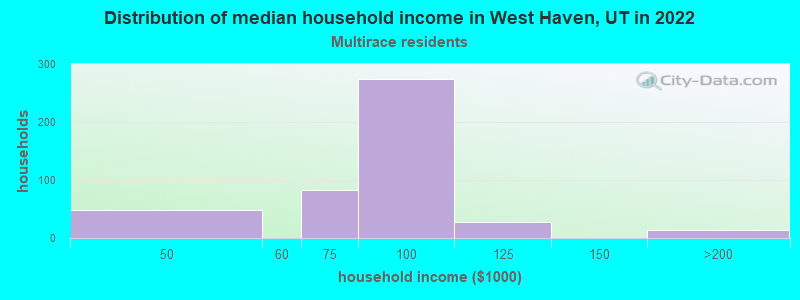
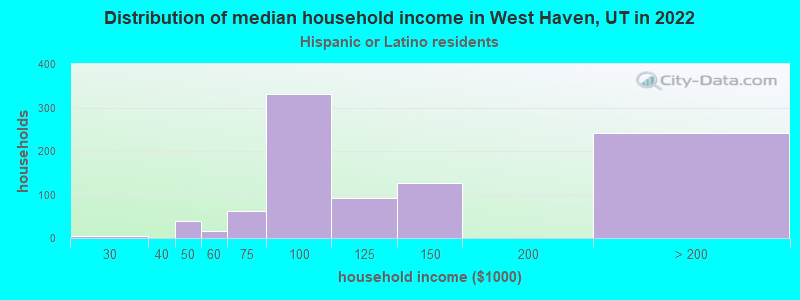
Income and house value in West Haven Median household income in 2022 $92,906 White non-Hispanic householders$51,844 Asian householders$96,499 Some other race householders$92,779 Two or more races householders$116,931 Hispanic or Latino race householdersMedian 2022 house value $594,163 White Non-Hispanic householders$321,810 Black or African American householders $762,182 Asian householders$410,900 Some other race householders$671,397 Two or more races householders$402,432 Hispanic or Latino householders
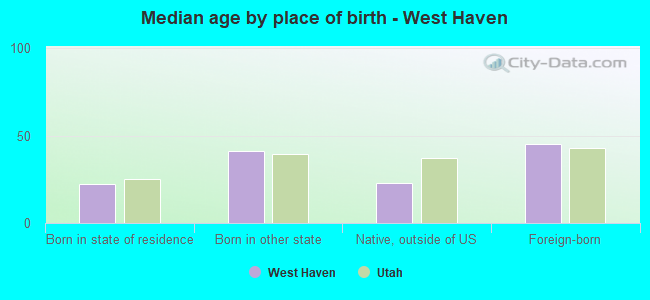
Median age by race in West Haven
29.6 Median age for White residents29.6 29.7 21.1 Median age for Black or African American residents21.2 -745,098,038.5 8.8 Median age for American Indian / Alaska Native residents-673,245,613.4 -688,311,687.6 22.9 Median age for Asian residents14.6 24.9 -1,217,647,057.6 Median age for Native Hawaiian / Pacific Islander residents-1,563,046,190.7 -664,285,713.6 29.4 Median age for Other race residents39.6 20.1 19.3 Median age for Two or more races residents23.9 18.9 30.7 Median age for White alone residents31.5 30.3 24.2 Median age for Hispanic or Latino residents25.6 18.6
Owner/renter occupied households by race in West Haven
House owners and renters - White residents 3,784 71.6% Owner occupied1,500 28.4% Renter occupiedHouse owners and renters - Black or African American residents 36 37.9% Owner occupied59 62.1% Renter occupiedHouse owners and renters - American Indian / Alaska Native residents 8 100.0% Renter occupiedHouse owners and renters - Asian residents 20 68.2% Owner occupied9 31.8% Renter occupiedHouse owners and renters - Native Hawaiian / Pacific Islander residents 21 100.0% Owner occupiedHouse owners and renters - Other race residents 115 71.2% Owner occupied47 28.8% Renter occupiedHouse owners and renters - Two or more races residents 95 24.1% Owner occupied299 75.9% Renter occupiedHouse owners and renters - White alone residents 3,442 71.2% Owner occupied1,391 28.8% Renter occupiedHouse owners and renters - Hispanic or Latino residents 545 58.2% Owner occupied392 41.8% Renter occupied
Language usage in West Haven
English speakers - Total 88.3% of residents of West Haven speak English at home.
9.5% of residents speak Spanish at home 1,136 68.4% Speak English very well525 31.6% Speak English less than very well2.4% of residents speak other language at home 193 46.5% Speak English very well222 53.5% Speak English less than very well
English speakers - Born in the United States 95.0% of residents of West Haven speak English at home.
4.0% of residents speak Spanish at home 168 100.0% Speak English very well0.9% of residents speak other language at home 15 38.5% Speak English very well24 61.5% Speak English less than very well
English speakers - Native, born elsewhere 46.1% of residents of West Haven speak English at home.
45.2% of residents speak Spanish at home 99 100.0% Speak English less than very well24.7% of residents speak other language at home 27 50.0% Speak English very well27 50.0% Speak English less than very well
English speakers - Foreign-born 9.0% of residents of West Haven speak English at home.
63.7% of residents speak Spanish at home 139 29.0% Speak English very well341 71.0% Speak English less than very well26.5% of residents speak other language at home 97 48.5% Speak English very well103 51.5% Speak English less than very well
White (Caucasian) - Speak only English Native:
95.1% (14,065)Foreign-born:
24.3% (42)
White (Caucasian) - Speak another language Native:
5.0% (744)Foreign-born:
75.1% (129)
Asian - Speak only English Native:
11.6% (13)Foreign-born:
17.4% (32)
Asian - Speak another language Native:
85.7% (96)Foreign-born:
81.7% (151)
Other race - Speak another language Native:
61.6% (324)Foreign-born:
99.0% (208)
Two or more races - Speak another language Native:
15.4% (160)Foreign-born:
100.0% (264)
White alone - Speak only English Native:
98.6% (12,690)Foreign-born:
43.6% (49)
White alone - Speak another language Native:
1.5% (197)Foreign-born:
44.7% (50)
Hispanic or Latino - Speak another language Native:
35.3% (1,002)Foreign-born:
100.0% (468)
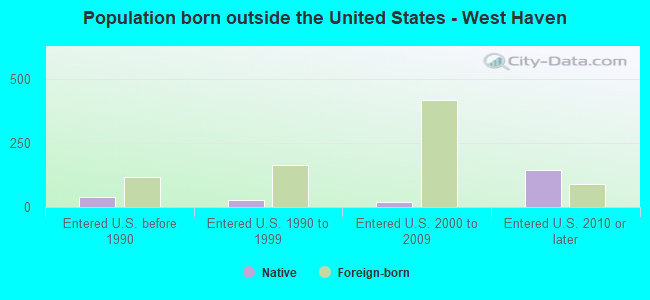
Foreign-born residents in West Haven 764 residents are foreign born (2.1% Latin America , 1.0% Asia , 0.7% Europe ).
Marital status for residents in West Haven Marital status - White (Caucasian) population 15 years and over
Males 32.7% Never married53.8% Now married0.3% Separated1.5% Widowed11.7% DivorcedFemales 31.7% Never married51.3% Now married1.5% Separated2.4% Widowed13.1% DivorcedWomen who gave birth in the past 12 months Now married:
63.5% (200)Unmarried:
36.5% (115)
Women who did not give birth in the past 12 months Now married:
46.4% (2,107)Unmarried:
53.6% (2,430)
Marital status - Asian population 15 years and over
Males 31.6% Never married68.4% Now married0.0% Separated0.0% Widowed0.0% DivorcedFemales 57.8% Never married30.9% Now married0.0% Separated11.2% Widowed0.0% DivorcedWomen who did not give birth in the past 12 months Now married:
21.3% (39)Unmarried:
78.7% (143)
Marital status - Other race population 15 years and over
Males 23.4% Never married58.2% Now married0.0% Separated0.0% Widowed18.4% DivorcedFemales 42.6% Never married41.7% Now married0.0% Separated0.0% Widowed15.7% DivorcedWomen who gave birth in the past 12 months Now married:
100.0% (15)Unmarried:
0.0% (0)
Women who did not give birth in the past 12 months Now married:
28.7% (58)Unmarried:
71.3% (145)
Marital status - Two or more races population 15 years and over
Males 37.7% Never married50.4% Now married0.0% Separated0.0% Widowed11.9% DivorcedFemales 54.6% Never married45.4% Now married0.0% Separated0.0% Widowed0.0% DivorcedWomen who gave birth in the past 12 months Now married:
100.0% (95)Unmarried:
0.0% (0)
Women who did not give birth in the past 12 months Now married:
25.7% (77)Unmarried:
74.3% (222)
Marital status - White alone, not Hispanic / Latino population 15 years and over
Males 30.5% Never married58.6% Now married0.3% Separated1.7% Widowed8.8% DivorcedFemales 29.3% Never married56.1% Now married1.2% Separated2.8% Widowed10.6% DivorcedWomen who gave birth in the past 12 months Now married:
69.3% (173)Unmarried:
30.7% (77)
Women who did not give birth in the past 12 months Now married:
51.6% (1,945)Unmarried:
48.4% (1,823)
Marital status - Hispanic or Latino population 15 years and over
Males 38.2% Never married32.7% Now married0.0% Separated0.0% Widowed29.1% DivorcedFemales 44.2% Never married31.2% Now married2.3% Separated0.0% Widowed22.3% DivorcedWomen who gave birth in the past 12 months Now married:
75.8% (127)Unmarried:
24.2% (41)
Women who did not give birth in the past 12 months Now married:
23.5% (262)Unmarried:
76.5% (850)
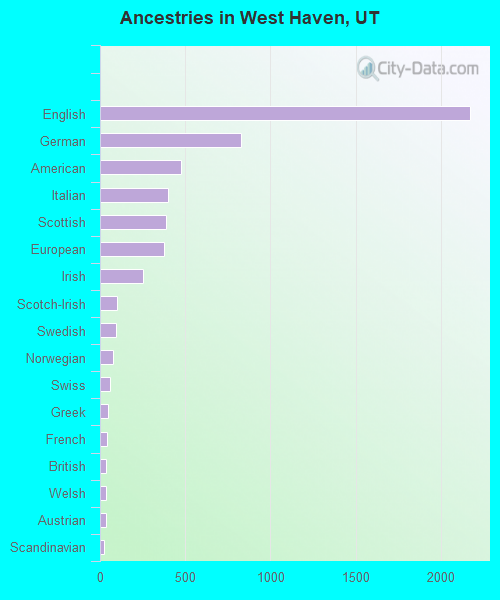
Ancestries in West Haven
2,173 26.2% English827 10.0% German473 5.7% American396 4.8% Italian387 4.7% Scottish376 4.5% European251 3.0% Irish100 1.2% Scotch-Irish95 1.1% Swedish74 0.9% Norwegian58 0.7% Swiss48 0.6% Greek39 0.5% French38 0.5% British38 0.5% Welsh35 0.4% Austrian22 0.3% Scandinavian15 0.2% Danish12 0.1% Polish11 0.1% Canadian7 0.08% Northern European6 0.07% Portuguese
Geographical mobility in West Haven Same house 1 year ago 13,727 87.5% White (Caucasian)123 100.0% Black or African American36 66.8% American Indian / Alaska Native355 99.6% Asian17 92.6% Native Hawaiian / Pacific Islander675 88.4% Other race984 69.0% Two or more races11,838 86.5% White alone, not Hispanic / Latino2,813 82.4% Hispanic or LatinoMoved within same county 1,065 6.8% White / Caucasian13 25.0% American Indian / Alaska Native10 2.7% Asian21 2.8% Other race389 27.3% Two or more races1,000 7.3% White alone, not Hispanic / Latino400 11.7% Hispanic or LatinoMoved within same state 460 2.9% White / Caucasian75 9.9% Other race27 1.9% Two or more races442 3.2% White alone, not Hispanic / Latino67 2.0% Hispanic or LatinoMoved from different state 256 1.6% White / Caucasian261 1.9% White alone, not Hispanic / LatinoMoved from abroad 10 0.1% White176 12.4% Two or more races11 0.1% White alone, not Hispanic / Latino136 4.0% Hispanic or Latino
Children Nativity (place of birth) in West Haven
Children under 6 years - Living with two parents Both parents native 1,175 100.0% NativeBoth parents foreign-born 133 100.0% NativeChildren under 6 years - Living with one parent Native parent 294 100.0% NativeChildren 6 to 17 years - Living with two parents Both parents native 3,073 100.0% NativeBoth parents foreign-born 148 100.0% NativeOne native, one foreign-born parent 322 100.0% NativeChildren 6 to 17 years - Living with one parent Native parent 881 100.0% NativeForeign-born parent 32 47.3% Native35 52.7% Foreign-born
Grandparents responsible for own grandchildren in West Haven
Grandparents (30 to 59 years) White / Caucasian 63 81.5% Responsible for grandchildren14 18.5% Not responsible for grandchildrenWhite alone, not Hispanic / Latino 35 72.6% Responsible for grandchildren13 27.4% Not responsible for grandchildrenHispanic or Latino 18 100.0% Responsible for grandchildren
Grandparents (60 years and over) White / Caucasian 109 100.0% Not responsible for grandchildrenWhite alone, not Hispanic / Latino 122 100.0% Not responsible for grandchildren