Races in West Hollywood, California (CA) Detailed Stats
Data:
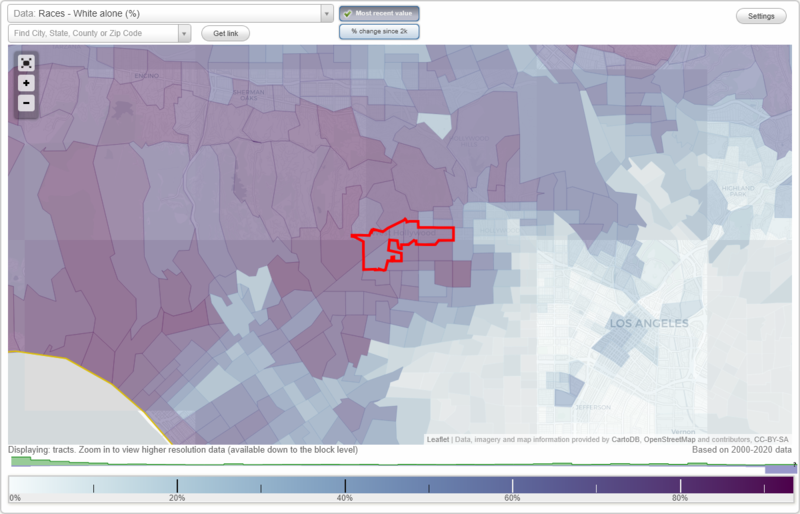
Races - White alone (%)
Races - White alone (% change since 2000)
Races - Black alone (%)
Races - Black alone (% change since 2000)
Races - American Indian alone (%)
Races - American Indian alone (% change since 2000)
Races - Asian alone (%)
Races - Asian alone (% change since 2000)
Races - Hispanic (%)
Races - Hispanic (% change since 2000)
Races - Native Hawaiian and Other Pacific Islander alone (%)
Races - Native Hawaiian and Other Pacific Islander alone (% change since 2000)
Races - Two or more races(%)
Races - Two or more races(% change since 2000)
Races - Other race alone (%)
Races - Other race alone (% change since 2000)
Racial diversity
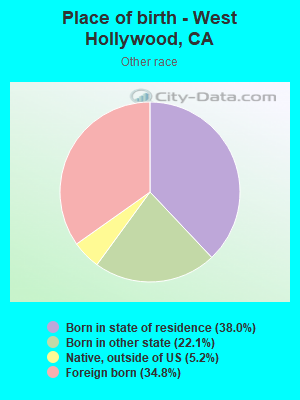
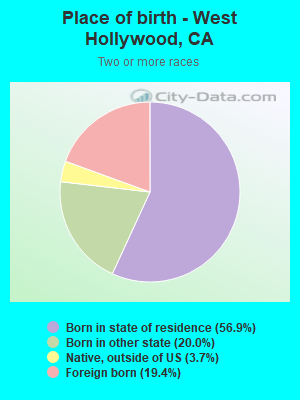
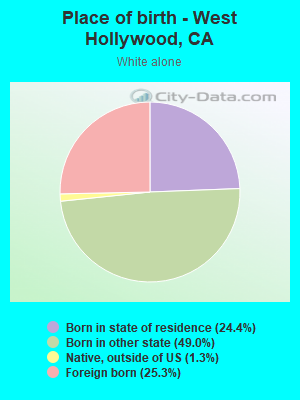
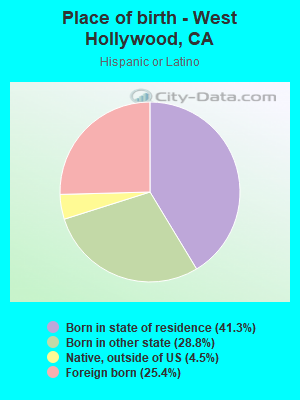
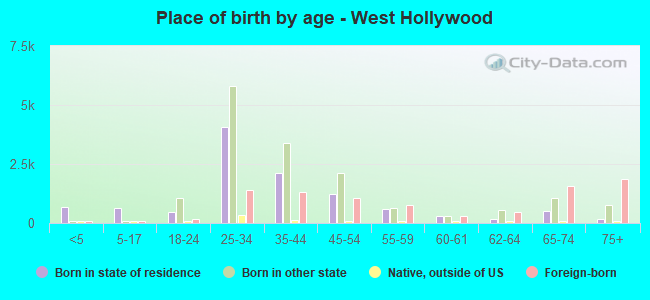
Place of birth - Born in state of residence (%)
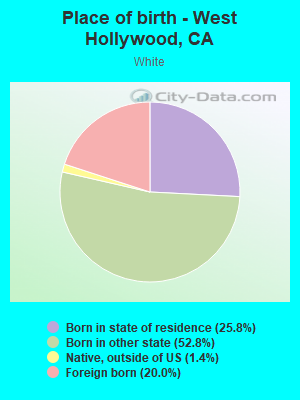
Place of birth - Born in state of residence (%) - White
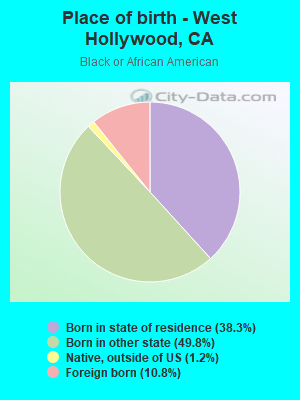
Place of birth - Born in state of residence (%) - Black or African American
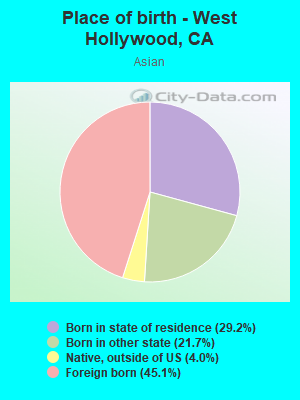
Place of birth - Born in state of residence (%) - Asian
Place of birth - Born in state of residence (%) - Hispanic or Latino
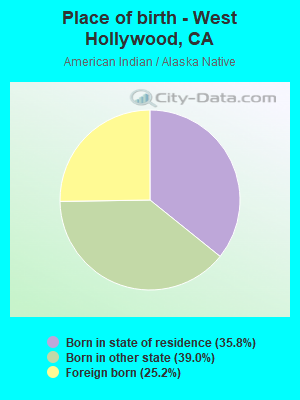
Place of birth - Born in state of residence (%) - American Indian and Alaska Native
Place of birth - Born in state of residence (%) - Multirace
Place of birth - Born in state of residence (%) - Other Race
Place of birth - Born in other state (%)
Place of birth - Born in other state (%) - White
Place of birth - Born in other state (%) - Black or African American
Place of birth - Born in other state (%) - Asian
Place of birth - Born in other state (%) - Hispanic or Latino
Place of birth - Born in other state (%) - American Indian and Alaska Native
Place of birth - Born in other state (%) - Multirace
Place of birth - Born in other state (%) - Other Race
Place of birth - Native, outside of US (%)
Place of birth - Native, outside of US (%) - White
Place of birth - Native, outside of US (%) - Black or African American
Place of birth - Native, outside of US (%) - Asian
Place of birth - Native, outside of US (%) - Hispanic or Latino
Place of birth - Native, outside of US (%) - American Indian and Alaska Native
Place of birth - Native, outside of US (%) - Multirace
Place of birth - Native, outside of US (%) - Other Race
Place of birth - Foreign born (%)
Place of birth - Foreign born (%) - White
Place of birth - Foreign born (%) - Black or African American
Place of birth - Foreign born (%) - Asian
Place of birth - Foreign born (%) - Hispanic or Latino
Place of birth - Foreign born (%) - American Indian and Alaska Native
Place of birth - Foreign born (%) - Multirace
Place of birth - Foreign born (%) - Other Race
Residents speaking English at home (%)
Residents speaking English at home - Born in the United States (%)
Residents speaking English at home - Native, born elsewhere (%)
Residents speaking English at home - Foreign born (%)
Residents speaking Spanish at home (%)
Residents speaking Spanish at home - Born in the United States (%)
Residents speaking Spanish at home - Native, born elsewhere (%)
Residents speaking Spanish at home - Foreign born (%)
Residents speaking other language at home (%)
Residents speaking other language at home - Born in the United States (%)
Residents speaking other language at home - Native, born elsewhere (%)
Residents speaking other language at home - Foreign born (%)
Marital status - Never married (%)
Marital status - Now married (%)
Marital status - Separated (%)
Marital status - Widowed (%)
Marital status - Divorced (%)
Ancestries Reported - Arab (%)
Ancestries Reported - Czech (%)
Ancestries Reported - Danish (%)
Ancestries Reported - Dutch (%)
Ancestries Reported - English (%)
Ancestries Reported - French (%)
Ancestries Reported - French Canadian (%)
Ancestries Reported - German (%)
Ancestries Reported - Greek (%)
Ancestries Reported - Hungarian (%)
Ancestries Reported - Irish (%)
Ancestries Reported - Italian (%)
Ancestries Reported - Lithuanian (%)
Ancestries Reported - Norwegian (%)
Ancestries Reported - Polish (%)
Ancestries Reported - Portuguese (%)
Ancestries Reported - Russian (%)
Ancestries Reported - Scotch-Irish (%)
Ancestries Reported - Scottish (%)
Ancestries Reported - Slovak (%)
Ancestries Reported - Subsaharan African (%)
Ancestries Reported - Swedish (%)
Ancestries Reported - Swiss (%)
Ancestries Reported - Ukrainian (%)
Ancestries Reported - United States (%)
Ancestries Reported - Welsh (%)
Ancestries Reported - West Indian (%)
Ancestries Reported - Other (%)
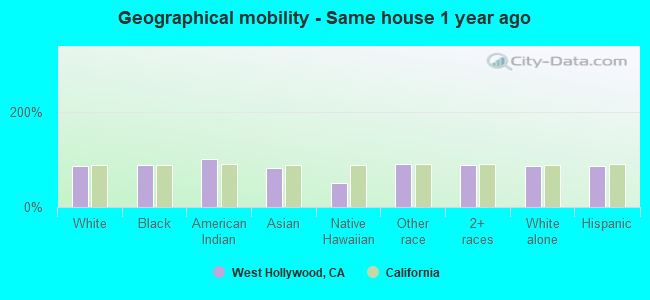
Geographical mobility - Same house 1 year ago (%)
Geographical mobility - Same house 1 year ago (%) - White
Geographical mobility - Same house 1 year ago (%) - Black or African American
Geographical mobility - Same house 1 year ago (%) - Asian
Geographical mobility - Same house 1 year ago (%) - Hispanic or Latino
Geographical mobility - Same house 1 year ago (%) - American Indian and Alaska Native
Geographical mobility - Same house 1 year ago (%) - Multirace
Geographical mobility - Same house 1 year ago (%) - Other Race
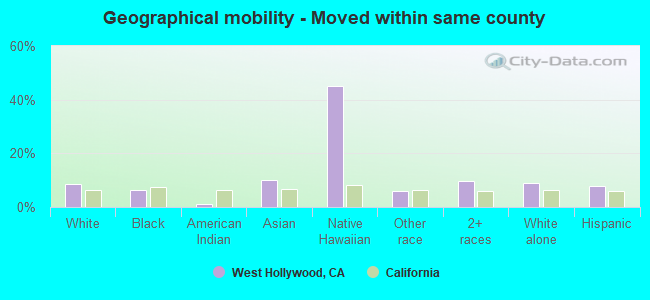
Geographical mobility - Moved within same county (%)
Geographical mobility - Moved within same county (%) - White
Geographical mobility - Moved within same county (%) - Black or African American
Geographical mobility - Moved within same county (%) - Asian
Geographical mobility - Moved within same county (%) - Hispanic or Latino
Geographical mobility - Moved within same county (%) - American Indian and Alaska Native
Geographical mobility - Moved within same county (%) - Multirace
Geographical mobility - Moved within same county (%) - Other Race
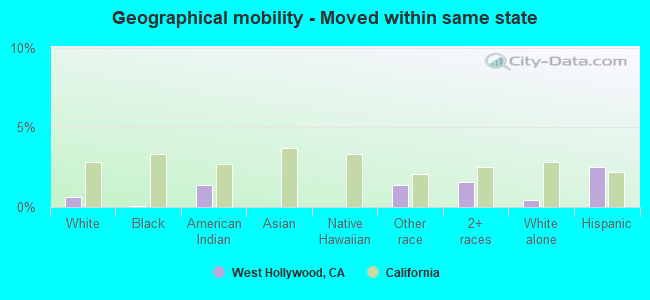
Geographical mobility - Moved from different county within same state (%)
Geographical mobility - Moved from different county within same state (%) - White
Geographical mobility - Moved from different county within same state (%) - Black or African American
Geographical mobility - Moved from different county within same state (%) - Asian
Geographical mobility - Moved from different county within same state (%) - Hispanic or Latino
Geographical mobility - Moved from different county within same state (%) - American Indian and Alaska Native
Geographical mobility - Moved from different county within same state (%) - Multirace
Geographical mobility - Moved from different county within same state (%) - Other Race
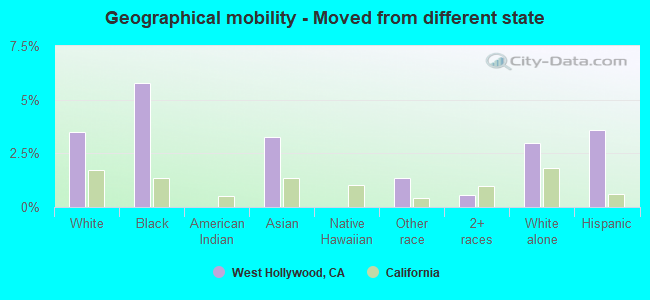
Geographical mobility - Moved from different state (%)
Geographical mobility - Moved from different state (%) - White
Geographical mobility - Moved from different state (%) - Black or African American
Geographical mobility - Moved from different state (%) - Asian
Geographical mobility - Moved from different state (%) - Hispanic or Latino
Geographical mobility - Moved from different state (%) - American Indian and Alaska Native
Geographical mobility - Moved from different state (%) - Multirace
Geographical mobility - Moved from different state (%) - Other Race
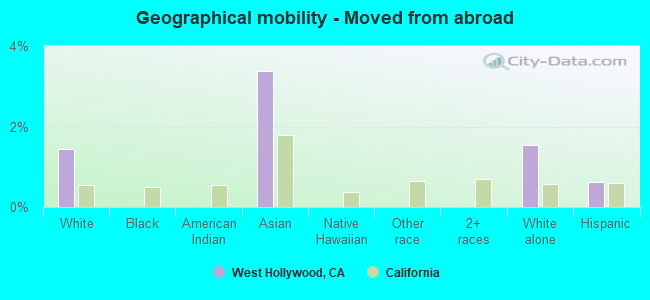
Geographical mobility - Moved from abroad (%)
Geographical mobility - Moved from abroad (%) - White
Geographical mobility - Moved from abroad (%) - Black or African American
Geographical mobility - Moved from abroad (%) - Asian
Geographical mobility - Moved from abroad (%) - Hispanic or Latino
Geographical mobility - Moved from abroad (%) - American Indian and Alaska Native
Geographical mobility - Moved from abroad (%) - Multirace
Geographical mobility - Moved from abroad (%) - Other Race
Place of birth for the foreign-born population - Ireland (%)
Place of birth for the foreign-born population - Denmark (%)
Place of birth for the foreign-born population - Norway (%)
Place of birth for the foreign-born population - Sweden (%)
Place of birth for the foreign-born population - United Kingdom (%)
Place of birth for the foreign-born population - England (%)
Place of birth for the foreign-born population - Scotland (%)
Place of birth for the foreign-born population - Other Northern Europe (%)
Place of birth for the foreign-born population - Austria (%)
Place of birth for the foreign-born population - Belgium (%)
Place of birth for the foreign-born population - France (%)
Place of birth for the foreign-born population - Germany (%)
Place of birth for the foreign-born population - Netherlands (%)
Place of birth for the foreign-born population - Switzerland (%)
Place of birth for the foreign-born population - Other Western Europe (%)
Place of birth for the foreign-born population - Greece (%)
Place of birth for the foreign-born population - Italy (%)
Place of birth for the foreign-born population - Portugal (%)
Place of birth for the foreign-born population - Spain (%)
Place of birth for the foreign-born population - Other Southern Europe (%)
Place of birth for the foreign-born population - Albania (%)
Place of birth for the foreign-born population - Belarus (%)
Place of birth for the foreign-born population - Bosnia and Herzegovina (%)
Place of birth for the foreign-born population - Bulgaria (%)
Place of birth for the foreign-born population - Croatia (%)
Place of birth for the foreign-born population - Czechoslovakia (%)
Place of birth for the foreign-born population - Hungary (%)
Place of birth for the foreign-born population - Latvia (%)
Place of birth for the foreign-born population - Lithuania (%)
Place of birth for the foreign-born population - North Macedonia (Macedonia) (%)
Place of birth for the foreign-born population - Moldova (%)
Place of birth for the foreign-born population - Poland (%)
Place of birth for the foreign-born population - Romania (%)
Place of birth for the foreign-born population - Russia (%)
Place of birth for the foreign-born population - Serbia (%)
Place of birth for the foreign-born population - Ukraine (%)
Place of birth for the foreign-born population - Other Eastern Europe (%)
Place of birth for the foreign-born population - China (%)
Place of birth for the foreign-born population - Hong Kong (%)
Place of birth for the foreign-born population - Taiwan (%)
Place of birth for the foreign-born population - Japan (%)
Place of birth for the foreign-born population - Korea (%)
Place of birth for the foreign-born population - Other Eastern Asia (%)
Place of birth for the foreign-born population - Afghanistan (%)
Place of birth for the foreign-born population - Bangladesh (%)
Place of birth for the foreign-born population - India (%)
Place of birth for the foreign-born population - Iran (%)
Place of birth for the foreign-born population - Kazakhstan (%)
Place of birth for the foreign-born population - Nepal (%)
Place of birth for the foreign-born population - Pakistan (%)
Place of birth for the foreign-born population - Sri Lanka (%)
Place of birth for the foreign-born population - Uzbekistan (%)
Place of birth for the foreign-born population - Other South Central Asia (%)
Place of birth for the foreign-born population - Burma (%)
Place of birth for the foreign-born population - Cambodia (%)
Place of birth for the foreign-born population - Indonesia (%)
Place of birth for the foreign-born population - Laos (%)
Place of birth for the foreign-born population - Malaysia (%)
Place of birth for the foreign-born population - Philippines (%)
Place of birth for the foreign-born population - Singapore (%)
Place of birth for the foreign-born population - Thailand (%)
Place of birth for the foreign-born population - Vietnam (%)
Place of birth for the foreign-born population - Other South Eastern Asia (%)
Place of birth for the foreign-born population - Armenia (%)
Place of birth for the foreign-born population - Iraq (%)
Place of birth for the foreign-born population - Israel (%)
Place of birth for the foreign-born population - Jordan (%)
Place of birth for the foreign-born population - Kuwait (%)
Place of birth for the foreign-born population - Lebanon (%)
Place of birth for the foreign-born population - Saudi Arabia (%)
Place of birth for the foreign-born population - Syria (%)
Place of birth for the foreign-born population - Turkey (%)
Place of birth for the foreign-born population - Yemen (%)
Place of birth for the foreign-born population - Other Western Asia (%)
Place of birth for the foreign-born population - Eritrea (%)
Place of birth for the foreign-born population - Ethiopia (%)
Place of birth for the foreign-born population - Kenya (%)
Place of birth for the foreign-born population - Somalia (%)
Place of birth for the foreign-born population - Uganda (%)
Place of birth for the foreign-born population - Zimbabwe (%)
Place of birth for the foreign-born population - Other Eastern Africa (%)
Place of birth for the foreign-born population - Cameroon (%)
Place of birth for the foreign-born population - Congo (%)
Place of birth for the foreign-born population - Democratic Republic of Congo (Zaire) (%)
Place of birth for the foreign-born population - Other Middle Africa (%)
Place of birth for the foreign-born population - Egypt (%)
Place of birth for the foreign-born population - Morocco (%)
Place of birth for the foreign-born population - Sudan (%)
Place of birth for the foreign-born population - Other Northern Africa (%)
Place of birth for the foreign-born population - South Africa (%)
Place of birth for the foreign-born population - Other Southern Africa (%)
Place of birth for the foreign-born population - Cabo Verde (%)
Place of birth for the foreign-born population - Ghana (%)
Place of birth for the foreign-born population - Liberia (%)
Place of birth for the foreign-born population - Nigeria (%)
Place of birth for the foreign-born population - Senegal (%)
Place of birth for the foreign-born population - Sierra Leone (%)
Place of birth for the foreign-born population - Other Western Africa (%)
Place of birth for the foreign-born population - Australia (%)
Place of birth for the foreign-born population - New Zealand (%)
Place of birth for the foreign-born population - Fiji (%)
Place of birth for the foreign-born population - Micronesia (%)
Place of birth for the foreign-born population - Bahamas (%)
Place of birth for the foreign-born population - Barbados (%)
Place of birth for the foreign-born population - Cuba (%)
Place of birth for the foreign-born population - Dominica (%)
Place of birth for the foreign-born population - Dominican Republic (%)
Place of birth for the foreign-born population - Grenada (%)
Place of birth for the foreign-born population - Haiti (%)
Place of birth for the foreign-born population - Jamaica (%)
Place of birth for the foreign-born population - St. Vincent and the Grenadines (%)
Place of birth for the foreign-born population - Trinidad and Tobago (%)
Place of birth for the foreign-born population - West Indies (%)
Place of birth for the foreign-born population - Other Caribbean (%)
Place of birth for the foreign-born population - Belize (%)
Place of birth for the foreign-born population - Costa Rica (%)
Place of birth for the foreign-born population - El Salvador (%)
Place of birth for the foreign-born population - Guatemala (%)
Place of birth for the foreign-born population - Honduras (%)
Place of birth for the foreign-born population - Mexico (%)
Place of birth for the foreign-born population - Nicaragua (%)
Place of birth for the foreign-born population - Panama (%)
Place of birth for the foreign-born population - Other Central America (%)
Place of birth for the foreign-born population - Argentina (%)
Place of birth for the foreign-born population - Bolivia (%)
Place of birth for the foreign-born population - Brazil (%)
Place of birth for the foreign-born population - Chile (%)
Place of birth for the foreign-born population - Colombia (%)
Place of birth for the foreign-born population - Ecuador (%)
Place of birth for the foreign-born population - Guyana (%)
Place of birth for the foreign-born population - Peru (%)
Place of birth for the foreign-born population - Uruguay (%)
Place of birth for the foreign-born population - Venezuela (%)
Place of birth for the foreign-born population - Other South America (%)
Place of birth for the foreign-born population - Canada (%)
Place of birth for the foreign-born population - Other Northern America (%)
Place of birth for the foreign-born population - Other (%)
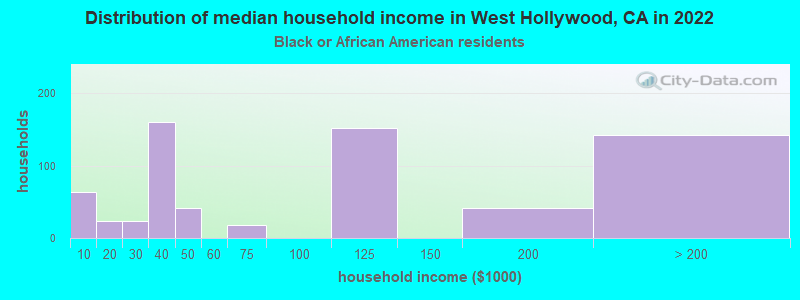
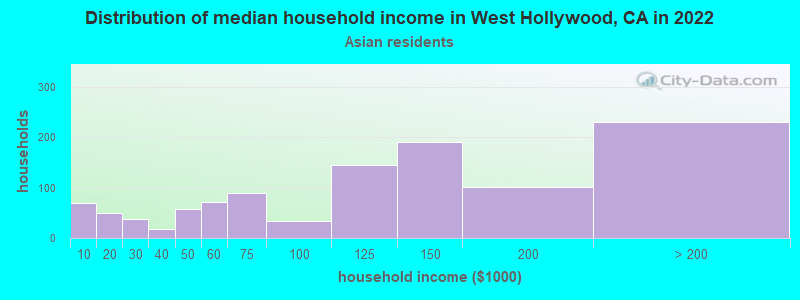
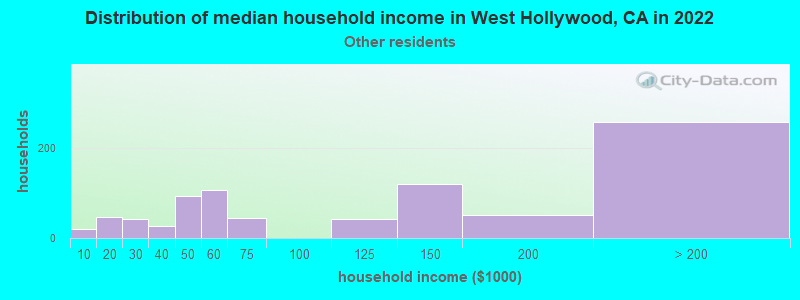
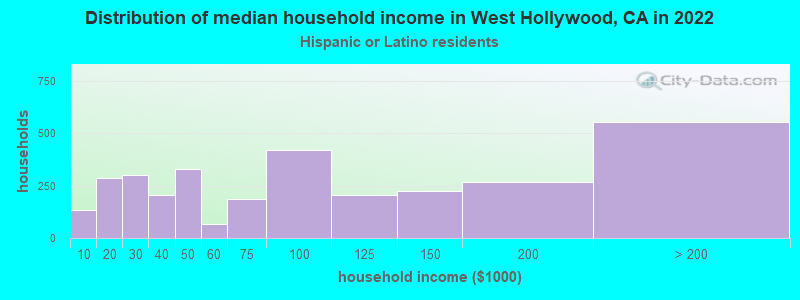
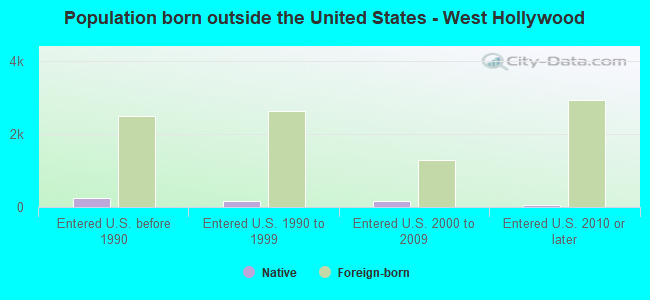
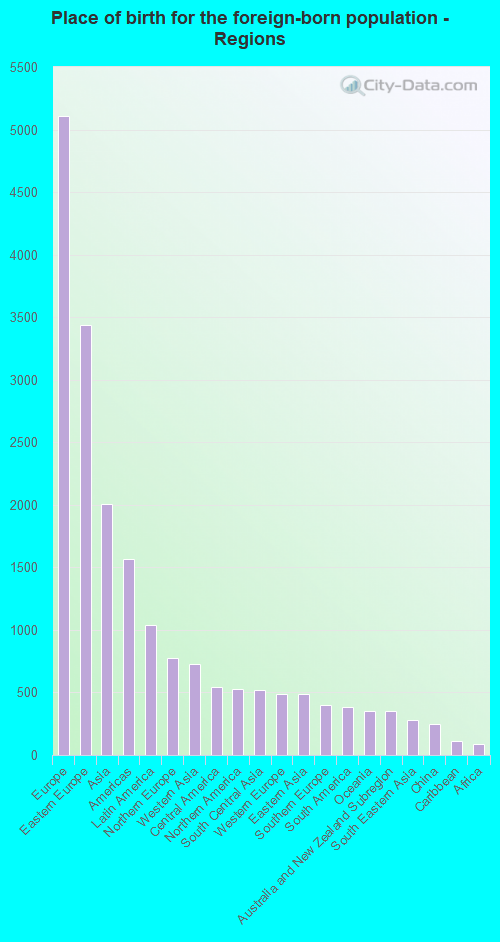
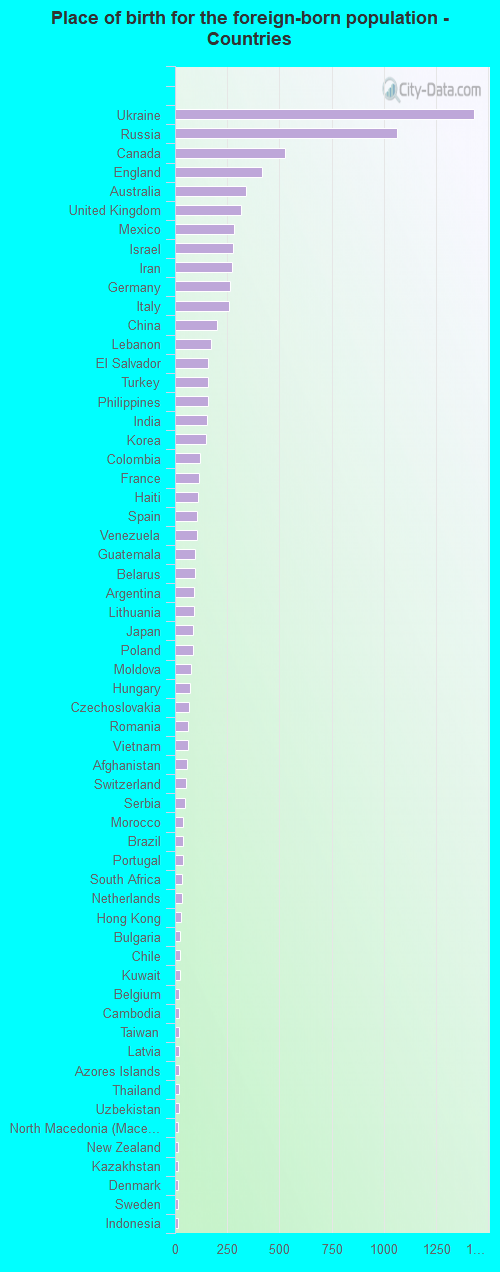
According to 2022 data, the most numerous races in West Hollywood, CA are Hispanic (3,811 residents), White alone (25,613 residents), and Asian alone (2,138 residents). 73.2% of West Hollywood residents speak English at home. 25.1% of West Hollywood, CA residents are foreign-born (13.8% born in Europe, 5.4% born in Asia, 2.8% born in Latin America), which is 3.6% less than the foreign-born rate of 26.0% across the entire state of California.
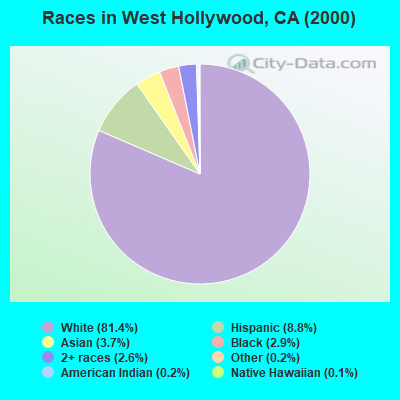
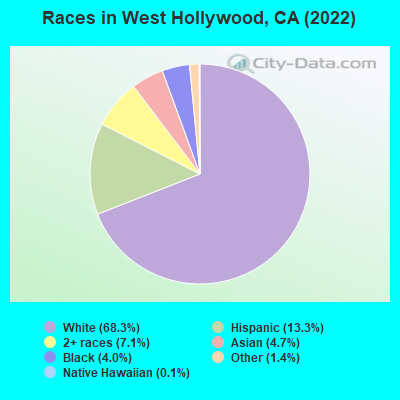
Race distribution in West Hollywood
2000 2022
15,816,790 46.7% White alone 10,966,556 32.4% Hispanic 3,648,860 10.8% Asian alone 2,181,926 6.4% Black alone 903,115 2.7% Two or more races 178,984 0.5% American Indian alone 103,736 0.3% Native Hawaiian and Other 71,681 0.2% Other race alone
15,732,184 40.3% Hispanic 13,160,426 33.7% White alone 5,957,867 15.3% Asian alone 2,025,218 5.2% Black alone 1,663,222 4.3% Two or more races 251,618 0.6% Other race alone 135,777 0.3% Native Hawaiian and Other 103,030 0.3% American Indian alone
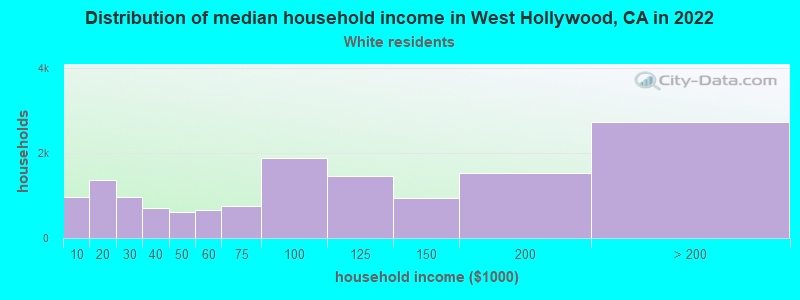
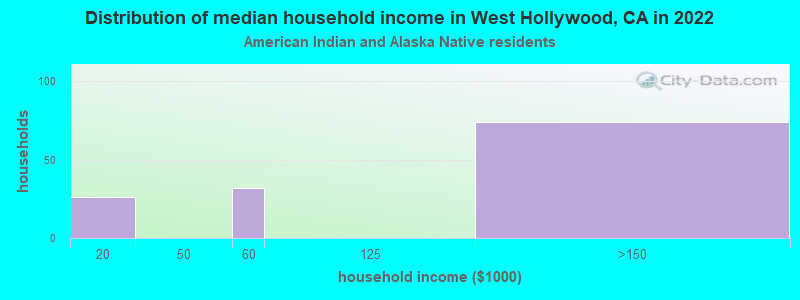
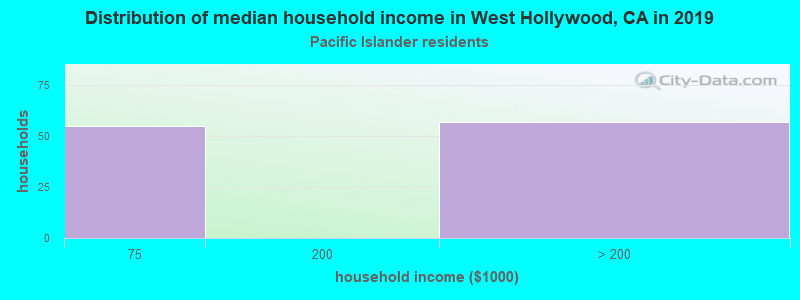
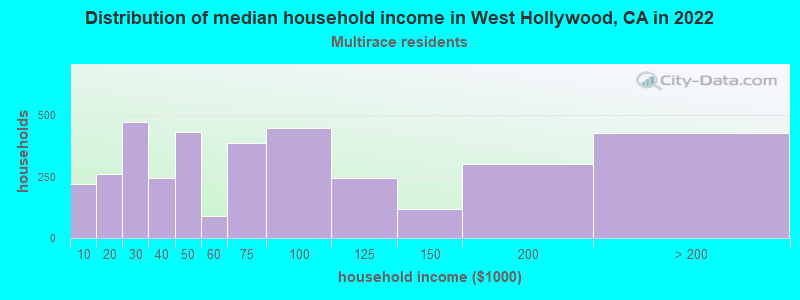
Income and house value in West Hollywood Median household income in 2022 $94,365 White non-Hispanic householders$59,225 Black householders$88,205 American Indian and Alaska Native householders$91,938 Asian householders$97,621 Some other race householders$89,439 Two or more races householders$101,498 Hispanic or Latino race householdersMedian 2022 house value over $1,000,000 White Non-Hispanic householdersover $1,000,000 Black or African American householders $706,541 Asian householders$584,885 Some other race householdersover $1,000,000 Two or more races householdersover $1,000,000 Hispanic or Latino householders
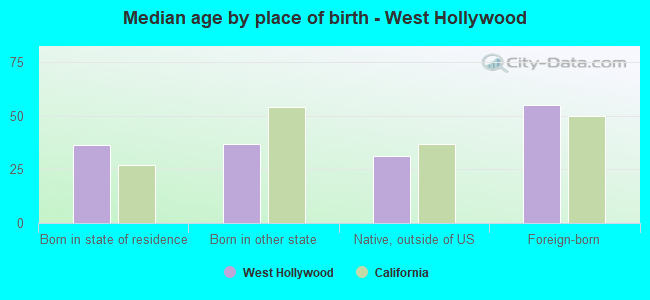
Median age by race in West Hollywood
42.7 Median age for White residents45.4 39.2 40.0 Median age for Black or African American residents39.2 44.0 33.3 Median age for American Indian / Alaska Native residents33.8 Median age for Asian residents33.7 33.8 39.5 Median age for Native Hawaiian / Pacific Islander residents34.9 Median age for Other race residents36.5 30.1 46.5 Median age for Two or more races residents47.5 42.6 41.0 Median age for White alone residents43.5 38.0 37.2 Median age for Hispanic or Latino residents38.9 33.9
Owner/renter occupied households by race in West Hollywood
House owners and renters - White residents 3,421 20.3% Owner occupied13,406 79.7% Renter occupiedHouse owners and renters - Black or African American residents 56 7.9% Owner occupied650 92.1% Renter occupiedHouse owners and renters - American Indian / Alaska Native residents 143 100.0% Renter occupiedHouse owners and renters - Asian residents 441 34.4% Owner occupied843 65.6% Renter occupiedHouse owners and renters - Native Hawaiian / Pacific Islander residents 111 100.0% Renter occupiedHouse owners and renters - Other race residents 60 9.4% Owner occupied586 90.6% Renter occupiedHouse owners and renters - Two or more races residents 441 11.2% Owner occupied3,492 88.8% Renter occupiedHouse owners and renters - White alone residents 3,486 19.8% Owner occupied14,133 80.2% Renter occupiedHouse owners and renters - Hispanic or Latino residents 227 10.2% Owner occupied1,999 89.8% Renter occupied
Language usage in West Hollywood
English speakers - Total 73.2% of residents of West Hollywood speak English at home.
6.3% of residents speak Spanish at home 1,740 76.7% Speak English very well529 23.3% Speak English less than very well21.0% of residents speak other language at home 4,138 55.0% Speak English very well3,382 45.0% Speak English less than very well
English speakers - Born in the United States 89.5% of residents of West Hollywood speak English at home.
4.7% of residents speak Spanish at home 714 96.0% Speak English very well30 4.0% Speak English less than very well5.9% of residents speak other language at home 792 84.3% Speak English very well147 15.7% Speak English less than very well
English speakers - Native, born elsewhere 63.9% of residents of West Hollywood speak English at home.
13.1% of residents speak Spanish at home 95 100.0% Speak English very well22.4% of residents speak other language at home 149 92.0% Speak English very well13 8.0% Speak English less than very well
English speakers - Foreign-born 31.8% of residents of West Hollywood speak English at home.
8.9% of residents speak Spanish at home 348 44.0% Speak English very well443 56.0% Speak English less than very well62.9% of residents speak other language at home 2,445 43.7% Speak English very well3,145 56.3% Speak English less than very well
White (Caucasian) - Speak only English Native:
94.5% (17,661)Foreign-born:
37.3% (1,785)
White (Caucasian) - Speak another language Native:
7.4% (1,377)Foreign-born:
67.8% (3,249)
Black or African American - Speak only English Native:
84.9% (969)Foreign-born:
48.9% (66)
Black or African American - Speak another language Native:
17.9% (204)Foreign-born:
47.7% (64)
American Indian / Alaska Native - Speak another language Native:
43.0% (59)Foreign-born:
99.6% (36)
Asian - Speak only English Native:
71.5% (864)Foreign-born:
34.2% (335)
Asian - Speak another language Native:
29.5% (356)Foreign-born:
68.4% (671)
Other race - Speak only English Native:
77.9% (710)Foreign-born:
26.8% (128)
Other race - Speak another language Native:
29.0% (264)Foreign-born:
78.8% (376)
Two or more races - Speak only English Native:
56.2% (2,642)Foreign-born:
17.6% (201)
Two or more races - Speak another language Native:
58.2% (2,734)Foreign-born:
74.7% (853)
White alone - Speak only English Native:
91.4% (17,141)Foreign-born:
28.2% (1,842)
White alone - Speak another language Native:
8.8% (1,651)Foreign-born:
71.7% (4,686)
Hispanic or Latino - Speak only English Native:
72.8% (2,128)Foreign-born:
22.7% (216)
Hispanic or Latino - Speak another language Native:
30.1% (879)Foreign-born:
81.1% (772)
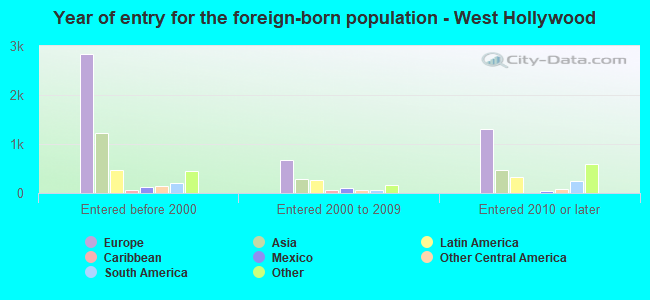
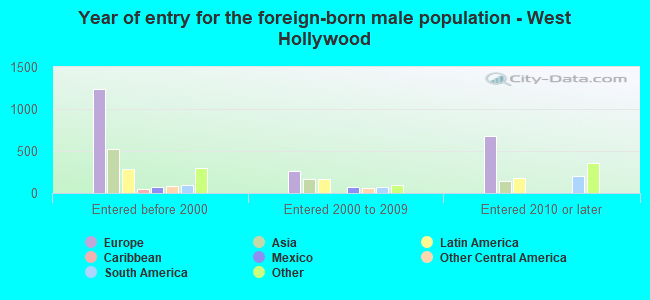
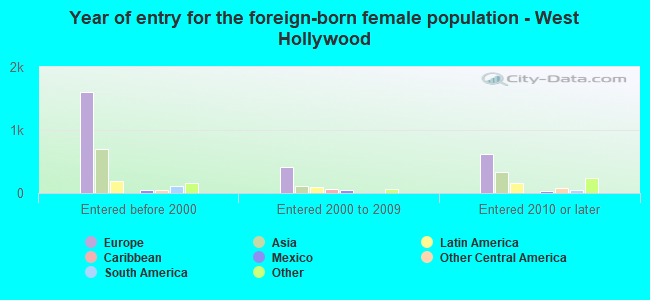
Foreign-born residents in West Hollywood 9,130 residents are foreign born (13.8% Europe , 5.4% Asia , 2.8% Latin America ).
This city:
25.1%California:
100.0%
Marital status for residents in West Hollywood Marital status - White (Caucasian) population 15 years and over
Males 65.5% Never married24.0% Now married0.3% Separated1.9% Widowed8.3% DivorcedFemales 52.8% Never married25.6% Now married0.7% Separated7.5% Widowed13.4% DivorcedWomen who gave birth in the past 12 months Now married:
77.4% (81)Unmarried:
22.6% (23)
Women who did not give birth in the past 12 months Now married:
22.4% (1,379)Unmarried:
77.6% (4,768)
Marital status - Black or African American population 15 years and over
Males 80.7% Never married6.9% Now married2.9% Separated0.0% Widowed9.5% DivorcedFemales 90.1% Never married6.2% Now married3.0% Separated0.6% Widowed0.0% DivorcedWomen who gave birth in the past 12 months Now married:
100.0% (22)Unmarried:
0.0% (0)
Women who did not give birth in the past 12 months Now married:
4.3% (18)Unmarried:
95.7% (396)
Marital status - American Indian / Alaska Native population 15 years and over
Males 0.0% Never married100.0% Now married0.0% Separated0.0% Widowed0.0% DivorcedFemales 3.8% Never married92.3% Now married0.0% Separated0.0% Widowed3.8% DivorcedWomen who did not give birth in the past 12 months Now married:
92.3% (70)Unmarried:
7.7% (6)
Marital status - Asian population 15 years and over
Males 69.8% Never married23.2% Now married0.0% Separated0.0% Widowed7.0% DivorcedFemales 50.4% Never married33.9% Now married2.1% Separated4.4% Widowed9.2% DivorcedWomen who gave birth in the past 12 months Now married:
100.0% (26)Unmarried:
0.0% (0)
Women who did not give birth in the past 12 months Now married:
30.9% (280)Unmarried:
69.1% (627)
Marital status - Other race population 15 years and over
Males 63.7% Never married31.9% Now married0.0% Separated0.0% Widowed4.4% DivorcedFemales 61.3% Never married38.7% Now married0.0% Separated0.0% Widowed0.0% DivorcedWomen who did not give birth in the past 12 months Now married:
32.3% (140)Unmarried:
67.7% (294)
Marital status - Two or more races population 15 years and over
Males 91.2% Never married2.4% Now married1.3% Separated0.0% Widowed5.2% DivorcedFemales 56.2% Never married32.4% Now married2.4% Separated9.0% Widowed0.0% DivorcedWomen who did not give birth in the past 12 months Now married:
38.3% (682)Unmarried:
61.7% (1,100)
Marital status - White alone, not Hispanic / Latino population 15 years and over
Males 64.9% Never married24.6% Now married0.2% Separated2.1% Widowed8.2% DivorcedFemales 52.6% Never married25.4% Now married0.7% Separated8.0% Widowed13.3% DivorcedWomen who gave birth in the past 12 months Now married:
77.4% (93)Unmarried:
22.6% (27)
Women who did not give birth in the past 12 months Now married:
21.8% (1,439)Unmarried:
78.2% (5,164)
Marital status - Hispanic or Latino population 15 years and over
Males 70.5% Never married20.6% Now married1.1% Separated0.0% Widowed7.8% DivorcedFemales 57.2% Never married34.6% Now married0.0% Separated0.0% Widowed8.2% DivorcedWomen who did not give birth in the past 12 months Now married:
33.9% (389)Unmarried:
66.1% (758)
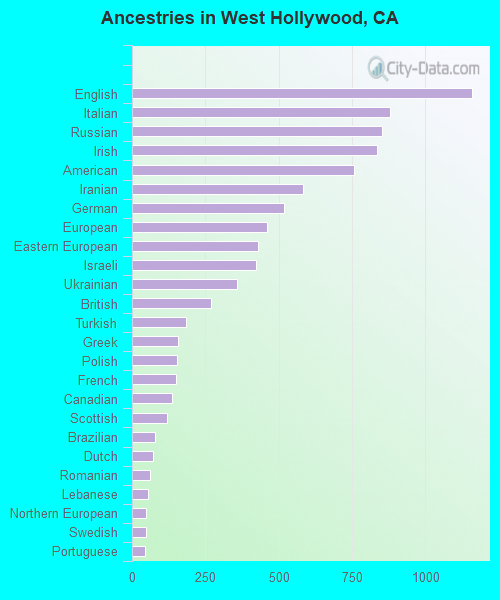
Ancestries in West Hollywood
974 5.9% Russian906 5.5% Italian891 5.4% American811 4.9% German751 4.6% Irish692 4.2% Ukrainian624 3.8% English577 3.5% European511 3.1% Eastern European465 2.8% Iranian255 1.6% Polish211 1.3% British191 1.2% Turkish161 1.0% Scottish149 0.9% Israeli141 0.9% French116 0.7% Haitian115 0.7% Greek98 0.6% Romanian91 0.6% Australian83 0.5% Welsh81 0.5% Canadian74 0.5% Scotch-Irish72 0.4% African71 0.4% Lithuanian69 0.4% Lebanese65 0.4% Serbian62 0.4% Portuguese59 0.4% Dutch57 0.3% Albanian55 0.3% Norwegian47 0.3% Swiss47 0.3% Syrian46 0.3% Austrian44 0.3% Egyptian40 0.2% Hungarian40 0.2% Croatian39 0.2% Czech38 0.2% Bulgarian36 0.2% Jamaican28 0.2% French Canadian27 0.2% Danish26 0.2% Slovak23 0.1% Northern European23 0.1% Basque21 0.1% Moroccan21 0.1% Swedish20 0.1% Scandinavian18 0.1% Estonian18 0.1% Brazilian16 0.10% Palestinian16 0.10% Macedonian16 0.10% Armenian13 0.08% Latvian12 0.07% Assyrian10 0.06% Finnish
Geographical mobility in West Hollywood Same house 1 year ago 20,516 85.3% White (Caucasian)1,124 88.6% Black or African American175 100.0% American Indian / Alaska Native1,747 80.9% Asian51 50.5% Native Hawaiian / Pacific Islander1,238 91.1% Other race5,001 87.3% Two or more races22,131 85.3% White alone, not Hispanic / Latino3,239 84.8% Hispanic or LatinoMoved within same county 2,042 8.5% White / Caucasian82 6.5% Black or African American2 1.2% American Indian / Alaska Native214 9.9% Asian45 45.2% Native Hawaiian / Pacific Islander80 5.9% Other race564 9.9% Two or more races2,357 9.1% White alone, not Hispanic / Latino306 8.0% Hispanic or LatinoMoved within same state 145 0.6% White / Caucasian1 0.1% Black or African American2 1.4% American Indian / Alaska Native19 1.4% Other race92 1.6% Two or more races119 0.5% White alone, not Hispanic / Latino96 2.5% Hispanic or LatinoMoved from different state 841 3.5% White / Caucasian73 5.8% Black or African American70 3.3% Asian18 1.3% Other race33 0.6% Two or more races778 3.0% White alone, not Hispanic / Latino137 3.6% Hispanic or LatinoMoved from abroad 347 1.4% White73 3.4% Asian397 1.5% White alone, not Hispanic / Latino24 0.6% Hispanic or Latino
Children Nativity (place of birth) in West Hollywood
Children under 6 years - Living with two parents Both parents native 506 96.4% Native19 3.6% Foreign-bornBoth parents foreign-born 44 57.4% Native32 42.6% Foreign-bornOne native, one foreign-born parent 75 100.0% NativeChildren under 6 years - Living with one parent Native parent 58 100.0% NativeForeign-born parent 51 100.0% NativeChildren 6 to 17 years - Living with two parents Both parents native 137 87.9% Native19 12.1% Foreign-bornBoth parents foreign-born 109 100.0% NativeOne native, one foreign-born parent 10 100.0% NativeChildren 6 to 17 years - Living with one parent Native parent 195 100.0% NativeForeign-born parent 124 61.3% Native78 38.7% Foreign-born