Races in West Park, Florida (FL) Detailed Stats
Data:
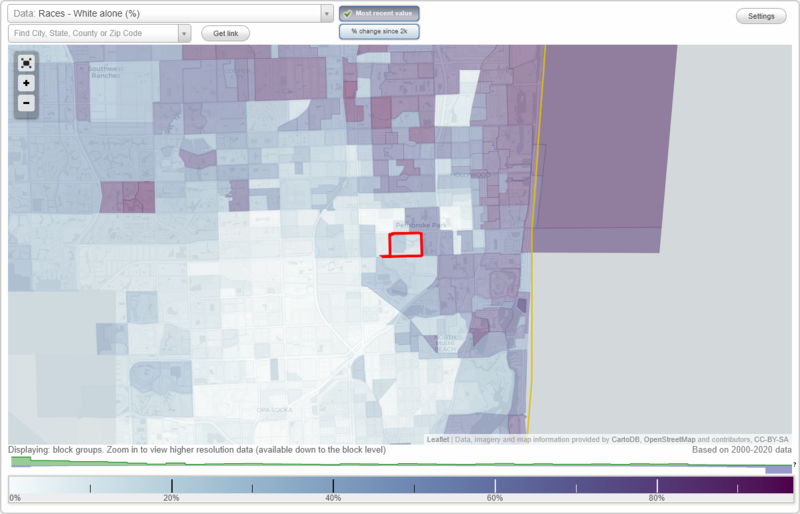
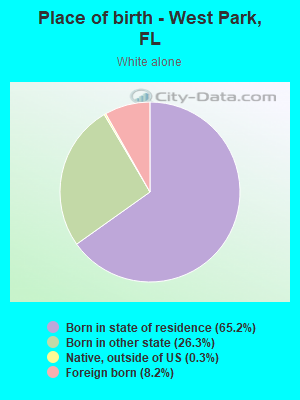
Races - White alone (%)
Races - White alone (% change since 2000)
Races - Black alone (%)
Races - Black alone (% change since 2000)
Races - American Indian alone (%)
Races - American Indian alone (% change since 2000)
Races - Asian alone (%)
Races - Asian alone (% change since 2000)
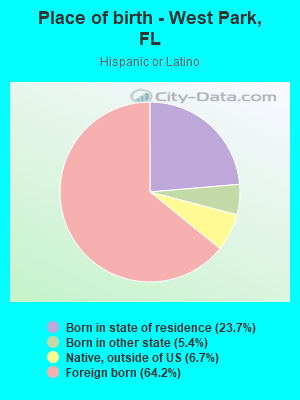
Races - Hispanic (%)
Races - Hispanic (% change since 2000)
Races - Native Hawaiian and Other Pacific Islander alone (%)
Races - Native Hawaiian and Other Pacific Islander alone (% change since 2000)
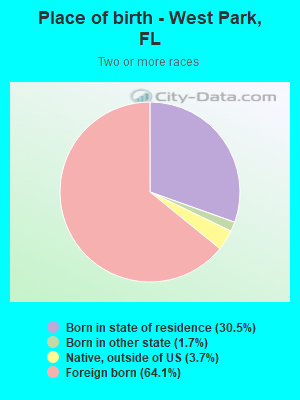
Races - Two or more races(%)
Races - Two or more races(% change since 2000)
Races - Other race alone (%)
Races - Other race alone (% change since 2000)
Racial diversity
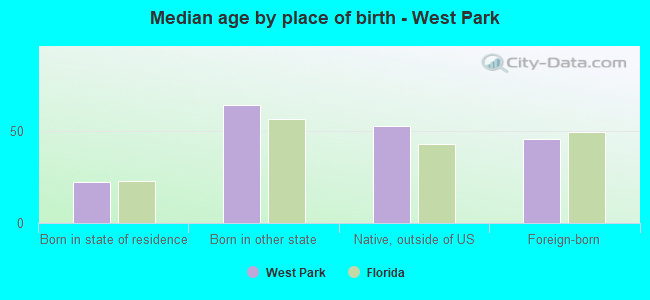
Place of birth - Born in state of residence (%)
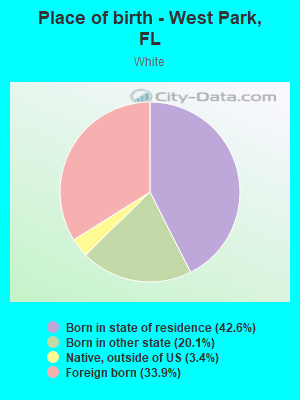
Place of birth - Born in state of residence (%) - White
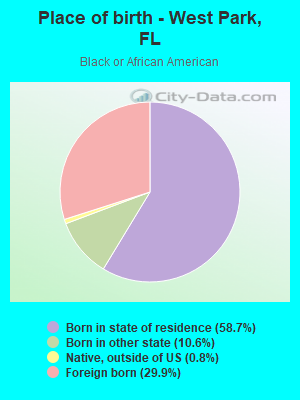
Place of birth - Born in state of residence (%) - Black or African American
Place of birth - Born in state of residence (%) - Asian
Place of birth - Born in state of residence (%) - Hispanic or Latino
Place of birth - Born in state of residence (%) - American Indian and Alaska Native
Place of birth - Born in state of residence (%) - Multirace
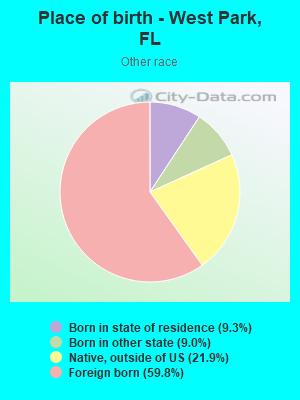
Place of birth - Born in state of residence (%) - Other Race
Place of birth - Born in other state (%)
Place of birth - Born in other state (%) - White
Place of birth - Born in other state (%) - Black or African American
Place of birth - Born in other state (%) - Asian
Place of birth - Born in other state (%) - Hispanic or Latino
Place of birth - Born in other state (%) - American Indian and Alaska Native
Place of birth - Born in other state (%) - Multirace
Place of birth - Born in other state (%) - Other Race
Place of birth - Native, outside of US (%)
Place of birth - Native, outside of US (%) - White
Place of birth - Native, outside of US (%) - Black or African American
Place of birth - Native, outside of US (%) - Asian
Place of birth - Native, outside of US (%) - Hispanic or Latino
Place of birth - Native, outside of US (%) - American Indian and Alaska Native
Place of birth - Native, outside of US (%) - Multirace
Place of birth - Native, outside of US (%) - Other Race
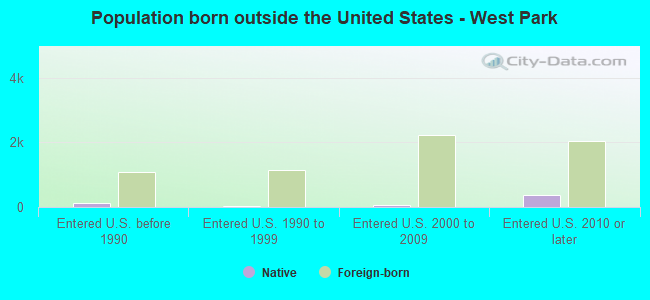
Place of birth - Foreign born (%)
Place of birth - Foreign born (%) - White
Place of birth - Foreign born (%) - Black or African American
Place of birth - Foreign born (%) - Asian
Place of birth - Foreign born (%) - Hispanic or Latino
Place of birth - Foreign born (%) - American Indian and Alaska Native
Place of birth - Foreign born (%) - Multirace
Place of birth - Foreign born (%) - Other Race
Residents speaking English at home (%)
Residents speaking English at home - Born in the United States (%)
Residents speaking English at home - Native, born elsewhere (%)
Residents speaking English at home - Foreign born (%)
Residents speaking Spanish at home (%)
Residents speaking Spanish at home - Born in the United States (%)
Residents speaking Spanish at home - Native, born elsewhere (%)
Residents speaking Spanish at home - Foreign born (%)
Residents speaking other language at home (%)
Residents speaking other language at home - Born in the United States (%)
Residents speaking other language at home - Native, born elsewhere (%)
Residents speaking other language at home - Foreign born (%)
Marital status - Never married (%)
Marital status - Now married (%)
Marital status - Separated (%)
Marital status - Widowed (%)
Marital status - Divorced (%)
Ancestries Reported - Arab (%)
Ancestries Reported - Czech (%)
Ancestries Reported - Danish (%)
Ancestries Reported - Dutch (%)
Ancestries Reported - English (%)
Ancestries Reported - French (%)
Ancestries Reported - French Canadian (%)
Ancestries Reported - German (%)
Ancestries Reported - Greek (%)
Ancestries Reported - Hungarian (%)
Ancestries Reported - Irish (%)
Ancestries Reported - Italian (%)
Ancestries Reported - Lithuanian (%)
Ancestries Reported - Norwegian (%)
Ancestries Reported - Polish (%)
Ancestries Reported - Portuguese (%)
Ancestries Reported - Russian (%)
Ancestries Reported - Scotch-Irish (%)
Ancestries Reported - Scottish (%)
Ancestries Reported - Slovak (%)
Ancestries Reported - Subsaharan African (%)
Ancestries Reported - Swedish (%)
Ancestries Reported - Swiss (%)
Ancestries Reported - Ukrainian (%)
Ancestries Reported - United States (%)
Ancestries Reported - Welsh (%)
Ancestries Reported - West Indian (%)
Ancestries Reported - Other (%)
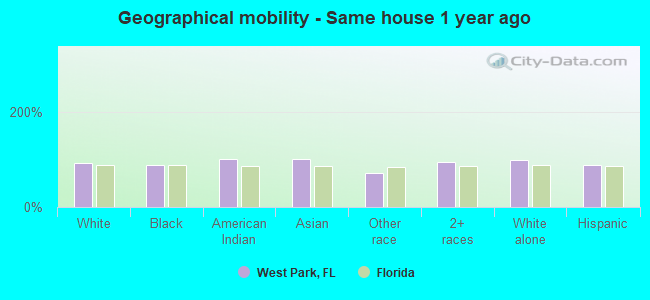
Geographical mobility - Same house 1 year ago (%)
Geographical mobility - Same house 1 year ago (%) - White
Geographical mobility - Same house 1 year ago (%) - Black or African American
Geographical mobility - Same house 1 year ago (%) - Asian
Geographical mobility - Same house 1 year ago (%) - Hispanic or Latino
Geographical mobility - Same house 1 year ago (%) - American Indian and Alaska Native
Geographical mobility - Same house 1 year ago (%) - Multirace
Geographical mobility - Same house 1 year ago (%) - Other Race
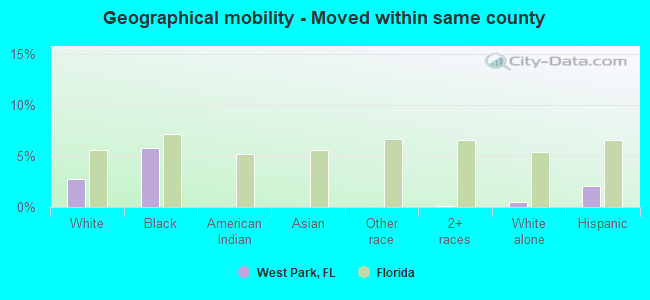
Geographical mobility - Moved within same county (%)
Geographical mobility - Moved within same county (%) - White
Geographical mobility - Moved within same county (%) - Black or African American
Geographical mobility - Moved within same county (%) - Asian
Geographical mobility - Moved within same county (%) - Hispanic or Latino
Geographical mobility - Moved within same county (%) - American Indian and Alaska Native
Geographical mobility - Moved within same county (%) - Multirace
Geographical mobility - Moved within same county (%) - Other Race
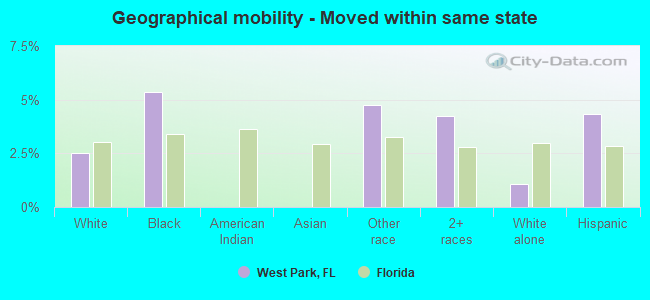
Geographical mobility - Moved from different county within same state (%)
Geographical mobility - Moved from different county within same state (%) - White
Geographical mobility - Moved from different county within same state (%) - Black or African American
Geographical mobility - Moved from different county within same state (%) - Asian
Geographical mobility - Moved from different county within same state (%) - Hispanic or Latino
Geographical mobility - Moved from different county within same state (%) - American Indian and Alaska Native
Geographical mobility - Moved from different county within same state (%) - Multirace
Geographical mobility - Moved from different county within same state (%) - Other Race
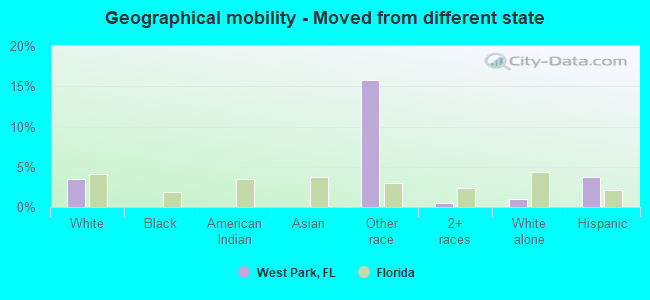
Geographical mobility - Moved from different state (%)
Geographical mobility - Moved from different state (%) - White
Geographical mobility - Moved from different state (%) - Black or African American
Geographical mobility - Moved from different state (%) - Asian
Geographical mobility - Moved from different state (%) - Hispanic or Latino
Geographical mobility - Moved from different state (%) - American Indian and Alaska Native
Geographical mobility - Moved from different state (%) - Multirace
Geographical mobility - Moved from different state (%) - Other Race
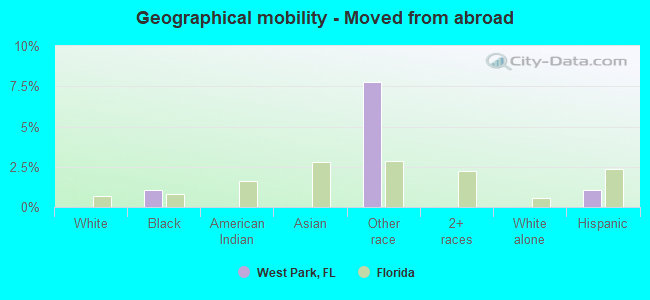
Geographical mobility - Moved from abroad (%)
Geographical mobility - Moved from abroad (%) - White
Geographical mobility - Moved from abroad (%) - Black or African American
Geographical mobility - Moved from abroad (%) - Asian
Geographical mobility - Moved from abroad (%) - Hispanic or Latino
Geographical mobility - Moved from abroad (%) - American Indian and Alaska Native
Geographical mobility - Moved from abroad (%) - Multirace
Geographical mobility - Moved from abroad (%) - Other Race
Place of birth for the foreign-born population - Ireland (%)
Place of birth for the foreign-born population - Denmark (%)
Place of birth for the foreign-born population - Norway (%)
Place of birth for the foreign-born population - Sweden (%)
Place of birth for the foreign-born population - United Kingdom (%)
Place of birth for the foreign-born population - England (%)
Place of birth for the foreign-born population - Scotland (%)
Place of birth for the foreign-born population - Other Northern Europe (%)
Place of birth for the foreign-born population - Austria (%)
Place of birth for the foreign-born population - Belgium (%)
Place of birth for the foreign-born population - France (%)
Place of birth for the foreign-born population - Germany (%)
Place of birth for the foreign-born population - Netherlands (%)
Place of birth for the foreign-born population - Switzerland (%)
Place of birth for the foreign-born population - Other Western Europe (%)
Place of birth for the foreign-born population - Greece (%)
Place of birth for the foreign-born population - Italy (%)
Place of birth for the foreign-born population - Portugal (%)
Place of birth for the foreign-born population - Spain (%)
Place of birth for the foreign-born population - Other Southern Europe (%)
Place of birth for the foreign-born population - Albania (%)
Place of birth for the foreign-born population - Belarus (%)
Place of birth for the foreign-born population - Bosnia and Herzegovina (%)
Place of birth for the foreign-born population - Bulgaria (%)
Place of birth for the foreign-born population - Croatia (%)
Place of birth for the foreign-born population - Czechoslovakia (%)
Place of birth for the foreign-born population - Hungary (%)
Place of birth for the foreign-born population - Latvia (%)
Place of birth for the foreign-born population - Lithuania (%)
Place of birth for the foreign-born population - North Macedonia (Macedonia) (%)
Place of birth for the foreign-born population - Moldova (%)
Place of birth for the foreign-born population - Poland (%)
Place of birth for the foreign-born population - Romania (%)
Place of birth for the foreign-born population - Russia (%)
Place of birth for the foreign-born population - Serbia (%)
Place of birth for the foreign-born population - Ukraine (%)
Place of birth for the foreign-born population - Other Eastern Europe (%)
Place of birth for the foreign-born population - China (%)
Place of birth for the foreign-born population - Hong Kong (%)
Place of birth for the foreign-born population - Taiwan (%)
Place of birth for the foreign-born population - Japan (%)
Place of birth for the foreign-born population - Korea (%)
Place of birth for the foreign-born population - Other Eastern Asia (%)
Place of birth for the foreign-born population - Afghanistan (%)
Place of birth for the foreign-born population - Bangladesh (%)
Place of birth for the foreign-born population - India (%)
Place of birth for the foreign-born population - Iran (%)
Place of birth for the foreign-born population - Kazakhstan (%)
Place of birth for the foreign-born population - Nepal (%)
Place of birth for the foreign-born population - Pakistan (%)
Place of birth for the foreign-born population - Sri Lanka (%)
Place of birth for the foreign-born population - Uzbekistan (%)
Place of birth for the foreign-born population - Other South Central Asia (%)
Place of birth for the foreign-born population - Burma (%)
Place of birth for the foreign-born population - Cambodia (%)
Place of birth for the foreign-born population - Indonesia (%)
Place of birth for the foreign-born population - Laos (%)
Place of birth for the foreign-born population - Malaysia (%)
Place of birth for the foreign-born population - Philippines (%)
Place of birth for the foreign-born population - Singapore (%)
Place of birth for the foreign-born population - Thailand (%)
Place of birth for the foreign-born population - Vietnam (%)
Place of birth for the foreign-born population - Other South Eastern Asia (%)
Place of birth for the foreign-born population - Armenia (%)
Place of birth for the foreign-born population - Iraq (%)
Place of birth for the foreign-born population - Israel (%)
Place of birth for the foreign-born population - Jordan (%)
Place of birth for the foreign-born population - Kuwait (%)
Place of birth for the foreign-born population - Lebanon (%)
Place of birth for the foreign-born population - Saudi Arabia (%)
Place of birth for the foreign-born population - Syria (%)
Place of birth for the foreign-born population - Turkey (%)
Place of birth for the foreign-born population - Yemen (%)
Place of birth for the foreign-born population - Other Western Asia (%)
Place of birth for the foreign-born population - Eritrea (%)
Place of birth for the foreign-born population - Ethiopia (%)
Place of birth for the foreign-born population - Kenya (%)
Place of birth for the foreign-born population - Somalia (%)
Place of birth for the foreign-born population - Uganda (%)
Place of birth for the foreign-born population - Zimbabwe (%)
Place of birth for the foreign-born population - Other Eastern Africa (%)
Place of birth for the foreign-born population - Cameroon (%)
Place of birth for the foreign-born population - Congo (%)
Place of birth for the foreign-born population - Democratic Republic of Congo (Zaire) (%)
Place of birth for the foreign-born population - Other Middle Africa (%)
Place of birth for the foreign-born population - Egypt (%)
Place of birth for the foreign-born population - Morocco (%)
Place of birth for the foreign-born population - Sudan (%)
Place of birth for the foreign-born population - Other Northern Africa (%)
Place of birth for the foreign-born population - South Africa (%)
Place of birth for the foreign-born population - Other Southern Africa (%)
Place of birth for the foreign-born population - Cabo Verde (%)
Place of birth for the foreign-born population - Ghana (%)
Place of birth for the foreign-born population - Liberia (%)
Place of birth for the foreign-born population - Nigeria (%)
Place of birth for the foreign-born population - Senegal (%)
Place of birth for the foreign-born population - Sierra Leone (%)
Place of birth for the foreign-born population - Other Western Africa (%)
Place of birth for the foreign-born population - Australia (%)
Place of birth for the foreign-born population - New Zealand (%)
Place of birth for the foreign-born population - Fiji (%)
Place of birth for the foreign-born population - Micronesia (%)
Place of birth for the foreign-born population - Bahamas (%)
Place of birth for the foreign-born population - Barbados (%)
Place of birth for the foreign-born population - Cuba (%)
Place of birth for the foreign-born population - Dominica (%)
Place of birth for the foreign-born population - Dominican Republic (%)
Place of birth for the foreign-born population - Grenada (%)
Place of birth for the foreign-born population - Haiti (%)
Place of birth for the foreign-born population - Jamaica (%)
Place of birth for the foreign-born population - St. Vincent and the Grenadines (%)
Place of birth for the foreign-born population - Trinidad and Tobago (%)
Place of birth for the foreign-born population - West Indies (%)
Place of birth for the foreign-born population - Other Caribbean (%)
Place of birth for the foreign-born population - Belize (%)
Place of birth for the foreign-born population - Costa Rica (%)
Place of birth for the foreign-born population - El Salvador (%)
Place of birth for the foreign-born population - Guatemala (%)
Place of birth for the foreign-born population - Honduras (%)
Place of birth for the foreign-born population - Mexico (%)
Place of birth for the foreign-born population - Nicaragua (%)
Place of birth for the foreign-born population - Panama (%)
Place of birth for the foreign-born population - Other Central America (%)
Place of birth for the foreign-born population - Argentina (%)
Place of birth for the foreign-born population - Bolivia (%)
Place of birth for the foreign-born population - Brazil (%)
Place of birth for the foreign-born population - Chile (%)
Place of birth for the foreign-born population - Colombia (%)
Place of birth for the foreign-born population - Ecuador (%)
Place of birth for the foreign-born population - Guyana (%)
Place of birth for the foreign-born population - Peru (%)
Place of birth for the foreign-born population - Uruguay (%)
Place of birth for the foreign-born population - Venezuela (%)
Place of birth for the foreign-born population - Other South America (%)
Place of birth for the foreign-born population - Canada (%)
Place of birth for the foreign-born population - Other Northern America (%)
Place of birth for the foreign-born population - Other (%)
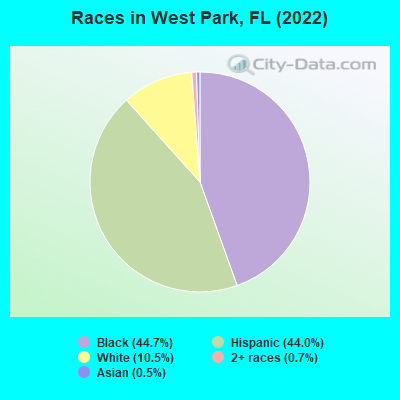
According to 2022 data, the most numerous races in West Park, FL are White alone (1,582 residents), Hispanic (6,652 residents), and Black alone (6,757 residents). 48.7% of West Park residents speak English at home.
Race distribution in West Park 6,757 44.7% Black alone 6,652 44.0% Hispanic 1,582 10.5% White alone 104 0.7% Two or more races 73 0.5% Asian alone
2000 2022
10,458,509 65.4% White alone 2,682,715 16.8% Hispanic 2,264,268 14.2% Black alone 261,693 1.6% Asian alone 236,954 1.5% Two or more races 42,358 0.3% American Indian alone 28,994 0.2% Other race alone 6,887 0.04% Native Hawaiian and Other
11,309,403 50.8% White alone 6,025,039 27.1% Hispanic 3,241,015 14.6% Black alone 861,630 3.9% Two or more races 623,692 2.8% Asian alone 152,054 0.7% Other race alone 22,504 0.1% American Indian alone 9,486 0.04% Native Hawaiian and Other
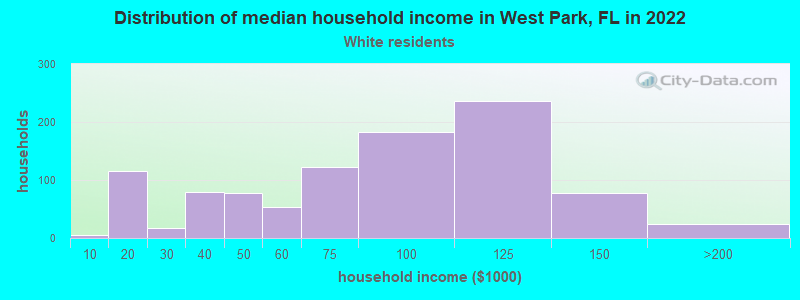
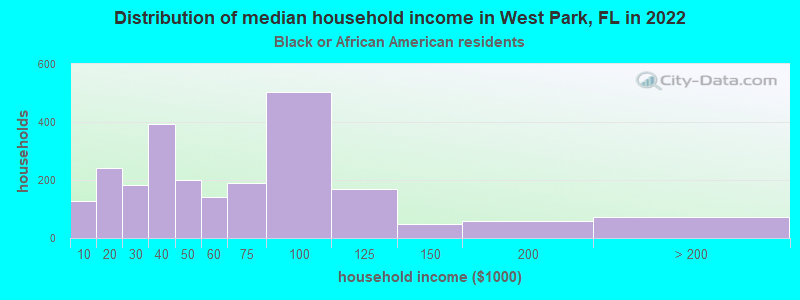
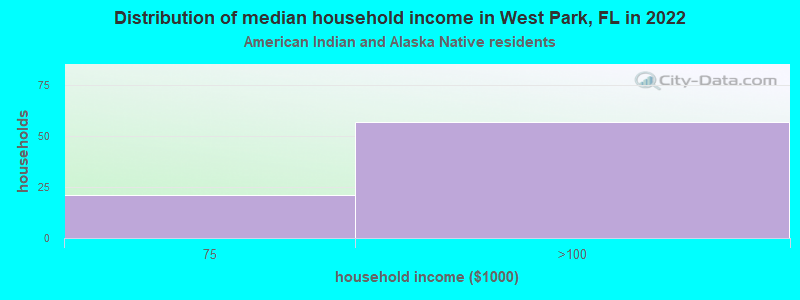
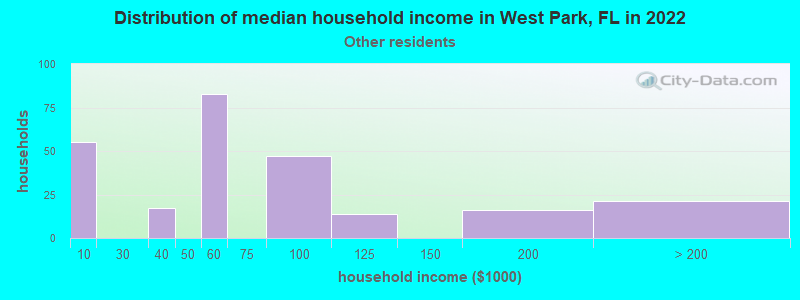
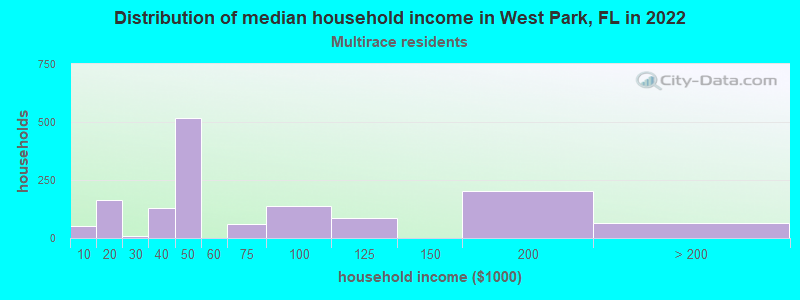
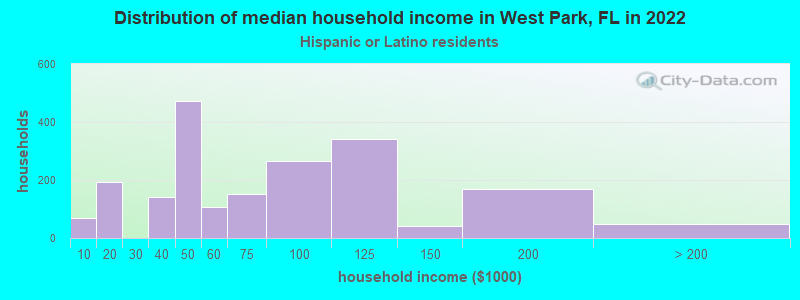
Income and house value in West Park Median household income in 2022 $78,411 White non-Hispanic householders$50,672 Black householders$60,682 Some other race householders$44,827 Two or more races householders$62,166 Hispanic or Latino race householders
Median age by race in West Park
43.2 Median age for White residents46.1 36.2 33.9 Median age for Black or African American residents31.2 36.6 26.6 Median age for American Indian / Alaska Native residents20.8 -735,362,996.9 43.1 Median age for Asian residents-669,991,686.8 -669,841,269.2 -437,357,630.5 Median age for Native Hawaiian / Pacific Islander residents-454,756,380.1 -666,666,666.0 39.1 Median age for Other race residents36.1 49.4 35.0 Median age for Two or more races residents33.7 37.8 33.8 Median age for White alone residents34.8 33.8 39.0 Median age for Hispanic or Latino residents38.7 39.7
Owner/renter occupied households by race in West Park
House owners and renters - White residents 864 85.3% Owner occupied149 14.7% Renter occupiedHouse owners and renters - Black or African American residents 1,267 54.1% Owner occupied1,074 45.9% Renter occupiedHouse owners and renters - American Indian / Alaska Native residents 14 28.8% Owner occupied35 71.2% Renter occupiedHouse owners and renters - Asian residents 38 100.0% Owner occupiedHouse owners and renters - Other race residents 190 75.7% Owner occupied61 24.3% Renter occupiedHouse owners and renters - Two or more races residents 725 53.5% Owner occupied631 46.5% Renter occupiedHouse owners and renters - White alone residents 350 81.0% Owner occupied82 19.0% Renter occupiedHouse owners and renters - Hispanic or Latino residents 1,266 66.3% Owner occupied645 33.7% Renter occupied
Language usage in West Park
English speakers - Total 48.7% of residents of West Park speak English at home.
42.8% of residents speak Spanish at home 3,040 49.7% Speak English very well3,073 50.3% Speak English less than very well9.3% of residents speak other language at home 977 73.7% Speak English very well348 26.3% Speak English less than very well
English speakers - Born in the United States 79.3% of residents of West Park speak English at home.
18.6% of residents speak Spanish at home 244 91.0% Speak English very well24 9.0% Speak English less than very well0.8% of residents speak other language at home 12 100.0% Speak English very well
English speakers - Native, born elsewhere 13.9% of residents of West Park speak English at home.
85.1% of residents speak Spanish at home 264 59.2% Speak English very well182 40.8% Speak English less than very well
English speakers - Foreign-born 19.2% of residents of West Park speak English at home.
64.4% of residents speak Spanish at home 1,382 32.8% Speak English very well2,830 67.2% Speak English less than very well17.6% of residents speak other language at home 801 69.7% Speak English very well349 30.3% Speak English less than very well
White (Caucasian) - Speak only English Native:
67.7% (1,383)Foreign-born:
2.2% (24)
White (Caucasian) - Speak another language Native:
27.2% (556)Foreign-born:
91.9% (985)
Black or African American - Speak only English Native:
96.0% (4,056)Foreign-born:
46.1% (937)
Black or African American - Speak another language Native:
4.6% (194)Foreign-born:
54.2% (1,102)
Other race - Speak only English Native:
18.7% (61)Foreign-born:
29.4% (159)
Other race - Speak another language Native:
79.1% (258)Foreign-born:
71.1% (385)
Two or more races - Speak only English Native:
18.5% (302)Foreign-born:
6.2% (192)
Two or more races - Speak another language Native:
83.2% (1,360)Foreign-born:
94.1% (2,918)
White alone - Speak only English Native:
94.7% (1,318)Foreign-born:
12.9% (17)
White alone - Speak another language Native:
5.3% (73)Foreign-born:
85.7% (111)
Hispanic or Latino - Speak only English Native:
14.3% (313)Foreign-born:
6.2% (270)
Hispanic or Latino - Speak another language Native:
85.3% (1,871)Foreign-born:
93.8% (4,057)
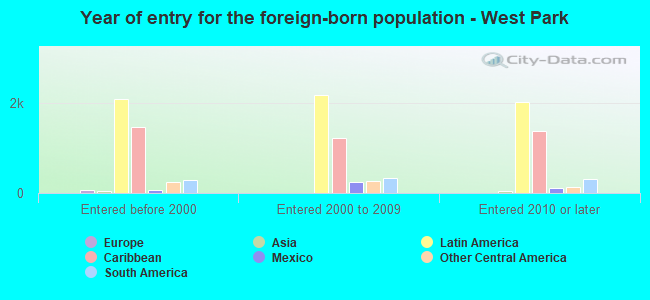
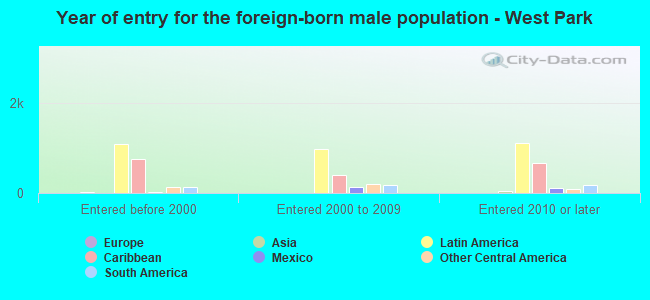
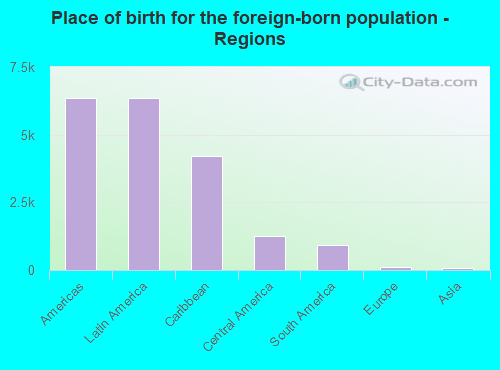
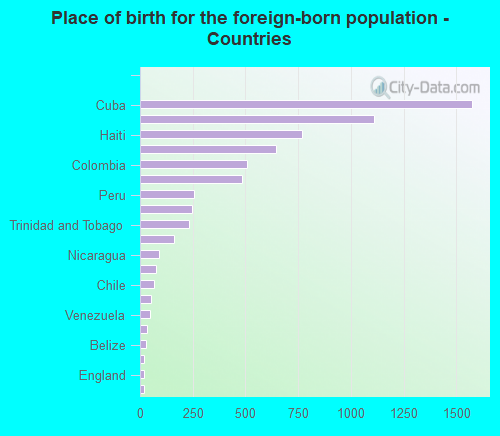
Foreign-born residents in West Park
Marital status for residents in West Park Marital status - White (Caucasian) population 15 years and over
Males 31.0% Never married46.4% Now married7.2% Separated0.9% Widowed14.4% DivorcedFemales 35.1% Never married36.2% Now married2.8% Separated5.8% Widowed20.1% DivorcedWomen who gave birth in the past 12 months Now married:
100.0% (10)Unmarried:
0.0% (0)
Women who did not give birth in the past 12 months Now married:
30.7% (245)Unmarried:
69.3% (552)
Marital status - Black or African American population 15 years and over
Males 56.0% Never married26.6% Now married0.0% Separated0.8% Widowed16.6% DivorcedFemales 41.4% Never married24.2% Now married0.8% Separated14.6% Widowed19.1% DivorcedWomen who gave birth in the past 12 months Now married:
38.5% (10)Unmarried:
61.5% (15)
Women who did not give birth in the past 12 months Now married:
21.1% (324)Unmarried:
78.9% (1,210)
Marital status - American Indian / Alaska Native population 15 years and over
Males 56.6% Never married43.4% Now married0.0% Separated0.0% Widowed0.0% DivorcedFemales 0.0% Never married100.0% Now married0.0% Separated0.0% Widowed0.0% DivorcedMarital status - Asian population 15 years and over
Males 100.0% Never married0.0% Now married0.0% Separated0.0% Widowed0.0% DivorcedFemales 0.0% Never married0.0% Now married0.0% Separated100.0% Widowed0.0% DivorcedMarital status - Other race population 15 years and over
Males 34.2% Never married60.3% Now married0.0% Separated0.0% Widowed5.5% DivorcedFemales 30.3% Never married46.7% Now married0.0% Separated0.0% Widowed23.0% DivorcedWomen who did not give birth in the past 12 months Now married:
57.7% (179)Unmarried:
42.3% (131)
Marital status - Two or more races population 15 years and over
Males 36.0% Never married43.1% Now married3.8% Separated3.8% Widowed13.2% DivorcedFemales 31.7% Never married48.6% Now married1.6% Separated11.6% Widowed6.5% DivorcedWomen who gave birth in the past 12 months Now married:
0.0% (0)Unmarried:
100.0% (21)
Women who did not give birth in the past 12 months Now married:
47.6% (443)Unmarried:
52.4% (488)
Marital status - White alone, not Hispanic / Latino population 15 years and over
Males 47.5% Never married40.9% Now married0.0% Separated2.6% Widowed9.1% DivorcedFemales 36.9% Never married31.8% Now married1.6% Separated15.7% Widowed14.0% DivorcedWomen who did not give birth in the past 12 months Now married:
17.8% (63)Unmarried:
82.2% (289)
Marital status - Hispanic or Latino population 15 years and over
Males 31.9% Never married46.9% Now married6.2% Separated1.5% Widowed13.5% DivorcedFemales 32.9% Never married43.9% Now married2.2% Separated4.5% Widowed16.5% DivorcedWomen who gave birth in the past 12 months Now married:
48.1% (13)Unmarried:
51.9% (14)
Women who did not give birth in the past 12 months Now married:
44.2% (682)Unmarried:
55.8% (862)
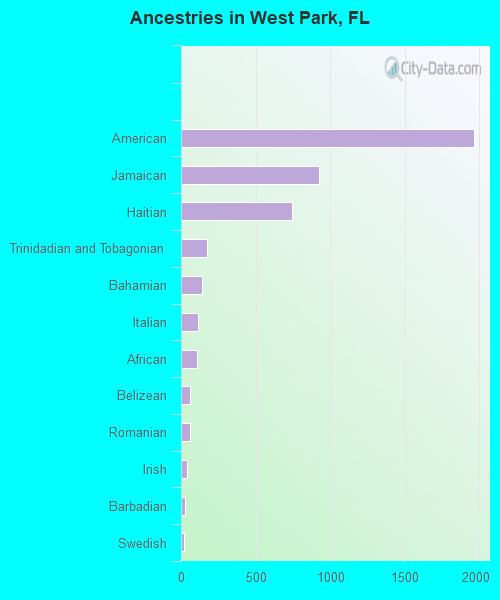
Ancestries in West Park
1,967 17.4% American928 8.2% Jamaican746 6.6% Haitian173 1.5% Trinidadian and Tobagonian140 1.2% Bahamian117 1.0% Italian108 1.0% African61 0.5% Belizean57 0.5% Romanian39 0.3% Irish25 0.2% Barbadian20 0.2% Swedish15 0.1% British12 0.1% German8 0.07% Portuguese6 0.05% European
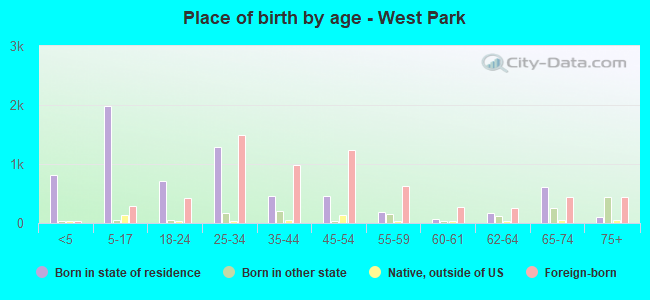
Children Nativity (place of birth) in West Park
Children under 6 years - Living with two parents Both parents native 153 100.0% NativeBoth parents foreign-born 275 100.0% NativeOne native, one foreign-born parent 64 100.0% NativeChildren under 6 years - Living with one parent Native parent 403 100.0% NativeForeign-born parent 47 100.0% NativeChildren 6 to 17 years - Living with two parents Both parents native 336 100.0% NativeBoth parents foreign-born 543 78.6% Native148 21.4% Foreign-bornOne native, one foreign-born parent 198 100.0% NativeChildren 6 to 17 years - Living with one parent Native parent 460 100.0% NativeForeign-born parent 453 55.5% Native363 44.5% Foreign-born
Grandparents responsible for own grandchildren in West Park
Grandparents (30 to 59 years) White / Caucasian 43 100.0% Not responsible for grandchildrenBlack or African American 19 13.9% Responsible for grandchildren116 86.1% Not responsible for grandchildrenTwo or more races 98 100.0% Not responsible for grandchildrenWhite alone, not Hispanic / Latino 30 100.0% Not responsible for grandchildrenHispanic or Latino 71 100.0% Not responsible for grandchildrenGrandparents (60 years and over) White / Caucasian 119 100.0% Not responsible for grandchildrenBlack or African American 9 10.1% Responsible for grandchildren81 89.9% Not responsible for grandchildrenWhite alone, not Hispanic / Latino 131 100.0% Not responsible for grandchildrenHispanic or Latino 1 2.5% Responsible for grandchildren37 97.5% Not responsible for grandchildren